/
Glaciers, Climates and  Global Warming Glaciers, Climates and  Global Warming

Glaciers, Climates and Global Warming - PowerPoint Presentation

sophie
sophie . @sophie
Follow
65 views
Uploaded On 2023-10-26

Glaciers, Climates and Global Warming - PPT Presentation

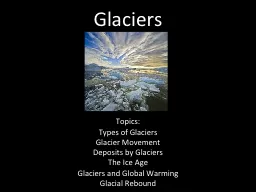
Glaciers Large masses of ice that form on land for a number of years more snow falls in winter than melts in summer deform and flow due to their own weight force of gravity strength of ice Parts in the Mountains ID: 1024804

heat increasing objects temperature increasing heat temperature objects hot ice rays emit hemisphere drops rises sun air greenhouse energy

Share:

Link:

Embed:

Download Presentation from below link

Download Presentation The PPT/PDF document "Glaciers, Climates and Global Warming" is the property of its rightful owner. Permission is granted to download and print the materials on this web site for personal, non-commercial use only, and to display it on your personal computer provided you do not modify the materials and that you retain all copyright notices contained in the materials. By downloading content from our website, you accept the terms of this agreement.


Presentation Transcript

1. Glaciers, Climates and Global Warming

2. GlaciersLarge masses of ice that form on landfor a number of years, more snow falls in winter than melts in summerdeform and flow due to their own weight force of gravitystrength of ice

3. Parts in the Mountains

4. Glacial Budget

5. Changing GlaciersStationary GlacierAccumulation = AblationReceding GlacierAccumulation < AblationAdvancing GlacierAccumulation > AblationHow can you tell?

6. Measure Them:

7. Glacier FeaturesEnd (terminal) moraineKettle lakes

8. The Nature of LightLight is one STRANGE phenomenon!Electric and magnetic forces are really two aspects of the same phenomenon, which we now call electromagnetismLight exhibits BOTH wave-like (wavelength) AND particle-like (photon) natures

9. The Electromagnetic SpectrumAll objects emit radiationE = energy of a photonh = Planck’s Constant6.6 x 10-34c = speed of light3 x 108λ =wavelength 

10. An opaque object emits electromagnetic radiationaccording to its temperature (example in VIS)Hot objects emit more radiation per unit surface area than cold objects

11. Example in IR (That’s Not Me!)Hot objects emit shorter wavelength (higher energy) photons than cold objects

12. Atmospheric PressurePressure: a measure of the weight of overlying molecules of airPSImmHg or inHgBarGravity pulls the molecules toward Earth

13.

14. Temperature Variations IICan I ask a simple question?If Hot Air rises, why is there snow in the mountains?Answer is not so simple!How is each layer heated? It needs:Heat Source, which emits some…Type of RadiationSubstance that absorbs a particular set of photons.Good Absorbers make Good Emitters – BUTNot all materials are GOOD absorbers – some are SELECTIVE absorbers!

15. The Solar Curve

16. The ThermosphereTemperature rises with increasing altitudeEnergetic rays of the Sun are absorbed by ions of O and NHighest temperature of any layer is reached - more than 1000°C!!Pressure is VERY low - very few atoms or molecules aroundThermosphere grades out into the vacuum of space.

17. The MesosphereTemperature drops with increasing altitude“Heat source” is hot material (atoms) escaping from the StratosphereOzone doesn’t exist in this thin airSun’s rays are extremely energetic, but there is nothing there to absorb the energy!Top of Mesosphere is the Mesopause.

18. The StratosphereTemperature rises with increasing altitudeThe SUN must be the heat source!OZONE absorbs UV rays and becomes warmer“Heat Rises”, but......what this really means is that “Air that is warmer than its surroundings will rise”Air doesn’t rise much in Stratosphere - lack of vertical motion results in layering Top of Stratosphere is called the Stratopause.

19. The TroposphereThis is also known as the “Weather Sphere”Temperature drops with increasing altitudeRate of decrease with altitude is known as the Environmental Lapse Rate (ELR)Average (or Normal) ELR is around 6.5°C/km (3.5°F/1000 ft), but varies widely with place, season, etc.Earth is the source of heat for the TroposphereDiscussed further in a momentTop is defined where the temperature stops dropping - called the Tropopause.

20. Troposphere: Where the Weather HappensTemperature DROPS with altitudeAbundance of Greenhouse GasesCould this be heated by the Sun?Gamma, X-rays absorbed in ThermosphereUV absorbed in StratosphereVIS passes through it all!How do we know that?

21.

22. AlbedoReflectivity of surfaceFresh snow:Asphalt:Green Forest:

23. Greenhouse GasesH2Oabsorbs ~ 5X more microwaves than all other GHGs combined!!Can we control its abundance in the atmosphere?CO2 – stable in our atmosphereNow at about 400 ppm (0.040%)Can we control its abundance in the atmosphere?CH4 (Methane)Very strong absorber at Breaks down to H2O and CO2

24. Absorption Spectra

25. Greenhouse Effect

26. AnalogyThink of GHGs as baseball mitts…Are mitts being added?

27. Water Vapor in the AirIncrease in CO2Increase the TemperatureIncrease the TemperatureIncrease the H2OIncrease the H2OIncrease the TemperatureRepeat…

28. Adding Mitts?Popclock: http://opr.princeton.edu/popclock/

29.

30. Predictions of Climate ChangeGlobally, average surface temperatures will increaseGlobally, average precipitation will increase, but its distribution is uncertainNorthern hemisphere ice will decrease, southern hemisphere ice may increaseArctic land areas will experience wintertime warmingSea level will rise at an increasing rate with drowning of low-level coastal plainsDecreasing soil moisture in the northern hemisphere may make farming nearly impossible in much of North America and EuropePlants and animal ranges will expand in some cases, shrink or disappear altogether in others