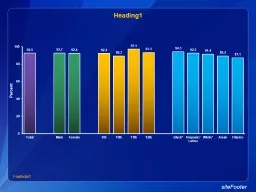
Grade and RaceEthnicity 2016 When riding in a car driven by someone else All Hispanic students are included in the Hispanic category All other races are nonHispanic Missing bar indicates fewer than 100 students in this subgroup ID: 810573
Download The PPT/PDF document "Percentage of High School Students Who R..." is the property of its rightful owner. Permission is granted to download and print the materials on this web site for personal, non-commercial use only, and to display it on your personal computer provided you do not modify the materials and that you retain all copyright notices contained in the materials. By downloading content from our website, you accept the terms of this agreement.
Slide1
Slide2Slide3Percentage of High School Students Who Rarely or Never Wore a Seat Belt,* by Sex, Grade, and Race/Ethnicity, 2016
*When riding in a car driven by someone elseAll Hispanic students are included in the Hispanic category. All other races are non-Hispanic.Missing bar indicates fewer than 100 students in this subgroup.Note: This graph contains weighted results.
Nebraska - YRBS, 2016 - QN8
Slide4Percentage of High School Students Who Rarely or Never Wore a Seat Belt,* 1991-2017†
*When riding in a car driven by someone else†Decreased 1991-2016, decreased 1991-2005, decreased 2005-2016 [Based on linear and quadratic trend analyses using logistic regression models controlling for sex, race/ethnicity, and grade (p < 0.05). Significant linear trends (if present) across all available years are described first followed by linear changes in each segment of significant quadratic trends (if present).]Data not available for 1995, 1997, 1999, 2001, 2007, 2009.
Note: This graph contains weighted results.Nebraska - YRBS, 1991-2017 - QN8
Slide5Percentage of High School Students Who Rode with a Driver Who Had Been Drinking Alcohol,* by Sex,† Grade,† and Race/Ethnicity,
† 2016*In a car or other vehicle, one or more times during the 30 days before the survey
†F > M; 12th > 11th; H > W (Based on t-test analysis, p < 0.05.)All Hispanic students are included in the Hispanic category. All other races are non-Hispanic.Missing bar indicates fewer than 100 students in this subgroup.
Note: This graph contains weighted results.
Nebraska - YRBS, 2016 - QN9
Slide6Percentage of High School Students Who Rode with a Driver Who Had Been Drinking Alcohol,* 1991-2017†
*In a car or other vehicle, one or more times during the 30 days before the survey†Decreased 1991-2016, decreased 1991-2003, decreased 2003-2016 [Based on linear and quadratic trend analyses using logistic regression models controlling for sex, race/ethnicity, and grade (p < 0.05). Significant linear trends (if present) across all available years are described first followed by linear changes in each segment of significant quadratic trends (if present).]Data not available for 1995, 1997, 1999, 2001, 2007, 2009.
Note: This graph contains weighted results.
Nebraska - YRBS, 1991-2017 - QN9
Slide7Percentage of High School Students Who Drove a Car or Other Vehicle When They Had Been Drinking Alcohol,* by Sex, Grade,† and Race/Ethnicity,
2016*One or more times during the 30 days before the survey, among students who had driven a car or other vehicle during the 30 days before the survey†11th > 9th, 12th > 9th, 12th > 10th (Based on t-test analysis, p < 0.05.)
All Hispanic students are included in the Hispanic category. All other races are non-Hispanic.Missing bar indicates fewer than 100 students in this subgroup.Note: This graph contains weighted results.
Nebraska - YRBS, 2016 - QN10
Slide8Percentage of High School Students Who Drove a Car or Other Vehicle When They Had Been Drinking Alcohol,* 2014-2017†
*One or more times during the 30 days before the survey, among students who had driven a car or other vehicle during the 30 days before the survey†No change 2014-2016 [Based on linear trend analyses using logistic regression models controlling for sex, race/ethnicity, and grade (p < 0.05).]Note: This graph contains weighted results.
Nebraska - YRBS, 2014-2017 - QN10
Slide9Percentage of High School Students Who Texted or E-Mailed While Driving a Car or Other Vehicle,* by Sex, Grade,† and Race/Ethnicity,
2016*On at least 1 day during the 30 days before the survey, among students who had driven a car or other vehicle during the 30 days before the survey†10th > 9th, 11th > 9th, 11th > 10th, 12th > 9th, 12th > 10th, 12th > 11th (Based on t-test analysis, p < 0.05.)
All Hispanic students are included in the Hispanic category. All other races are non-Hispanic.Missing bar indicates fewer than 100 students in this subgroup.
Note: This graph contains weighted results.
Nebraska - YRBS, 2016 - QN11
Slide10Percentage of High School Students Who Were Threatened or Injured with a Weapon on School Property,* 1993-2017†
*Such as a gun, knife, or club, one or more times during the 12 months before the survey†Increased, 1993-2005, decreased, 2005-2016 [Based on linear and quadratic trend analyses using logistic regression models controlling for sex, race/ethnicity, and grade (p < 0.05). Significant linear trends (if present) across all available years are described first followed by linear changes in each segment of significant quadratic trends (if present).]Data not available for 1995, 1997, 1999, 2001, 2007, 2009.
Note: This graph contains weighted results.
Nebraska - YRBS, 1993-2017 - QN16
Slide11Percentage of High School Students Who Were in a Physical Fight,* by Sex,† Grade,† and Race/Ethnicity,
2016*One or more times during the 12 months before the survey†M > F; 9th > 12th (Based on t-test analysis, p < 0.05.)
All Hispanic students are included in the Hispanic category. All other races are non-Hispanic.Missing bar indicates fewer than 100 students in this subgroup.Note: This graph contains weighted results.
Nebraska - YRBS, 2016 - QN17
Slide12Percentage of High School Students Who Were in a Physical Fight,* 1991-2017†
*One or more times during the 12 months before the survey†Decreased 1991-2016 [Based on linear and quadratic trend analyses using logistic regression models controlling for sex, race/ethnicity, and grade (p < 0.05). Significant linear trends (if present) across all available years are described first followed by linear changes in each segment of significant quadratic trends (if present).]Data not available for 1995, 1997, 1999, 2001, 2007, 2009.
Note: This graph contains weighted results.Nebraska - YRBS, 1991-2017 - QN17
Slide13Percentage of High School Students Who Were in a Physical Fight on School Property,* by Sex,† Grade,† and Race/Ethnicity,
2016*One or more times during the 12 months before the survey†M > F; 10th > 12th (Based on t-test analysis, p < 0.05.)
All Hispanic students are included in the Hispanic category. All other races are non-Hispanic.Missing bar indicates fewer than 100 students in this subgroup.Note: This graph contains weighted results.
Nebraska - YRBS, 2016 - QN18
Slide14Percentage of High School Students Who Were in a Physical Fight on School Property,* 1993-2017†
*One or more times during the 12 months before the survey†Decreased 1993-2016 [Based on linear and quadratic trend analyses using logistic regression models controlling for sex, race/ethnicity, and grade (p < 0.05). Significant linear trends (if present) across all available years are described first followed by linear changes in each segment of significant quadratic trends (if present).]Data not available for 1995, 1997, 1999, 2001, 2007, 2009.
Note: This graph contains weighted results.Nebraska - YRBS, 1993-2017 - QN18
Slide15Percentage of High School Students Who Were Ever Physically Forced to Have Sexual Intercourse,* by Sex,† Grade,†
and Race/Ethnicity, 2016*When they did not want to†F > M; 12th > 9th (Based on t-test analysis, p < 0.05.)
All Hispanic students are included in the Hispanic category. All other races are non-Hispanic.Missing bar indicates fewer than 100 students in this subgroup.Note: This graph contains weighted results.
Nebraska - YRBS, 2016 - QN19
Slide16Percentage of High School Students Who Were Ever Physically Forced to Have Sexual Intercourse,* 2003-2017†
*When they did not want to†Decreased 2003-2016 [Based on linear and quadratic trend analyses using logistic regression models controlling for sex, race/ethnicity, and grade (p < 0.05). Significant linear trends (if present) across all available years are described first followed by linear changes in each segment of significant quadratic trends (if present).]Data not available for 2007, 2009.Note: This graph contains weighted results.
Nebraska - YRBS, 2003-2017 - QN19
Slide17Percentage of High School Students Who Experienced Sexual Violence,* by Sex,† Grade,† and Race/Ethnicity,
† 2016*Being forced by anyone to do sexual things [counting such things as kissing, touching, or being physically forced to have sexual intercourse] that they did not want to, one or more times during the 12 months before the survey
†F > M; 11th > 9th, 12th > 9th; H > W (Based on t-test analysis, p < 0.05.)All Hispanic students are included in the Hispanic category. All other races are non-Hispanic.
Missing bar indicates fewer than 100 students in this subgroup.
Note: This graph contains weighted results.
Nebraska - YRBS, 2016 - QN20
Slide18Percentage of High School Students Who Experienced Sexual Dating Violence,* by Sex,† Grade, and Race/Ethnicity, 2016
*Being forced by someone they were dating or going out with to do sexual things [counting such things as kissing, touching, or being physically forced to have sexual intercourse] that they did not want to, one or more times during the 12 months before the survey, among students who dated or went out with someone during the 12 months before the survey†
F > M (Based on t-test analysis, p < 0.05.)All Hispanic students are included in the Hispanic category. All other races are non-Hispanic.Missing bar indicates fewer than 100 students in this subgroup.
Note: This graph contains weighted results.
Nebraska - YRBS, 2016 - QN21
Slide19Percentage of High School Students Who Experienced Sexual Dating Violence,* 2014-2017†
*Being forced by someone they were dating or going out with to do sexual things [counting such things as kissing, touching, or being physically forced to have sexual intercourse] that they did not want to, one or more times during the 12 months before the survey, among students who dated or went out with someone during the 12 months before the survey†No change 2014-2016 [Based on linear trend analyses using logistic regression models controlling for sex, race/ethnicity, and grade (p < 0.05).]Note: This graph contains weighted results.
Nebraska - YRBS, 2014-2017 - QN21
Slide20Percentage of High School Students Who Felt Sad or Hopeless,* by Sex,† Grade,† and Race/Ethnicity,
2016*Almost every day for >=2 weeks in a row so that they stopped doing some usual activities, ever during the 12 months before the survey†
F > M; 11th > 10th (Based on t-test analysis, p < 0.05.)All Hispanic students are included in the Hispanic category. All other races are non-Hispanic.Missing bar indicates fewer than 100 students in this subgroup.
Note: This graph contains weighted results.
Nebraska - YRBS, 2016 - QN25
Slide21Percentage of High School Students Who Felt Sad or Hopeless,* 2003-2017†
*Almost every day for >=2 weeks in a row so that they stopped doing some usual activities, ever during the 12 months before the survey†Decreased, 2003-2012, increased, 2012-2016 [Based on linear and quadratic trend analyses using logistic regression models controlling for sex, race/ethnicity, and grade (p < 0.05). Significant linear trends (if present) across all available years are described first followed by linear changes in each segment of significant quadratic trends (if present).]Data not available for 2007, 2009.
Note: This graph contains weighted results.
Nebraska - YRBS, 2003-2017 - QN25
Slide22Percentage of High School Students Who Seriously Considered Attempting Suicide,* by Sex,† Grade, and Race/Ethnicity,
† 2016*Ever during the 12 months before the survey†F > M; H > W (Based on t-test analysis, p < 0.05.)
All Hispanic students are included in the Hispanic category. All other races are non-Hispanic.Missing bar indicates fewer than 100 students in this subgroup.Note: This graph contains weighted results.
Nebraska - YRBS, 2016 - QN26
Slide23Percentage of High School Students Who Seriously Considered Attempting Suicide,* 1991-2017†
*Ever during the 12 months before the survey†Decreased 1991-2016, decreased 1991-2012, increased 2012-2016 [Based on linear and quadratic trend analyses using logistic regression models controlling for sex, race/ethnicity, and grade (p < 0.05). Significant linear trends (if present) across all available years are described first followed by linear changes in each segment of significant quadratic trends (if present).]Data not available for 1995, 1997, 1999, 2001, 2007, 2009.
Note: This graph contains weighted results.Nebraska - YRBS, 1991-2017 - QN26
Slide24Percentage of High School Students Who Made a Plan About How They Would Attempt Suicide,* by Sex,† Grade,† and Race/Ethnicity,
† 2016*During the 12 months before the survey†
F > M; 9th > 10th; H > W (Based on t-test analysis, p < 0.05.)All Hispanic students are included in the Hispanic category. All other races are non-Hispanic.Missing bar indicates fewer than 100 students in this subgroup.
Note: This graph contains weighted results.
Nebraska - YRBS, 2016 - QN27
Slide25Percentage of High School Students Who Made a Plan About How They Would Attempt Suicide,* 1991-2017†
*During the 12 months before the survey†Decreased 1991-2016 [Based on linear and quadratic trend analyses using logistic regression models controlling for sex, race/ethnicity, and grade (p < 0.05). Significant linear trends (if present) across all available years are described first followed by linear changes in each segment of significant quadratic trends (if present).]Data not available for 1995, 1997, 1999, 2001, 2007, 2009.
Note: This graph contains weighted results.Nebraska - YRBS, 1991-2017 - QN27
Slide26Percentage of High School Students Who Attempted Suicide,* by Sex,† Grade,† and Race/Ethnicity,
† 2016*One or more times during the 12 months before the survey†
F > M; 9th > 10th; H > W (Based on t-test analysis, p < 0.05.)All Hispanic students are included in the Hispanic category. All other races are non-Hispanic.Missing bar indicates fewer than 100 students in this subgroup.
Note: This graph contains weighted results.
Nebraska - YRBS, 2016 - QN28
Slide27Percentage of High School Students Who Attempted Suicide,* 1991-2017†
*One or more times during the 12 months before the survey†Decreased 1991-2016, no change 1991-2003, decreased 2003-2016 [Based on linear and quadratic trend analyses using logistic regression models controlling for sex, race/ethnicity, and grade (p < 0.05). Significant linear trends (if present) across all available years are described first followed by linear changes in each segment of significant quadratic trends (if present).]Data not available for 1995, 1997, 1999, 2001, 2007, 2009.
Note: This graph contains weighted results.Nebraska - YRBS, 1991-2017 - QN28
Slide28Percentage of High School Students Who Had a Suicide Attempt That Resulted in an Injury, Poisoning, or Overdose That Had to Be Treated by a Doctor or Nurse,* by Sex, Grade, and Race/Ethnicity, 2016
*During the 12 months before the surveyAll Hispanic students are included in the Hispanic category. All other races are non-Hispanic.Missing bar indicates fewer than 100 students in this subgroup.Note: This graph contains weighted results.
Nebraska - YRBS, 2016 - QN29
Slide29Percentage of High School Students Who Had a Suicide Attempt That Resulted in an Injury, Poisoning, or Overdose That Had to Be Treated by a Doctor or Nurse,* 1991-2017†
*During the 12 months before the survey†Increased, 1991-2003, decreased, 2003-2016 [Based on linear and quadratic trend analyses using logistic regression models controlling for sex, race/ethnicity, and grade (p < 0.05). Significant linear trends (if present) across all available years are described first followed by linear changes in each segment of significant quadratic trends (if present).]Data not available for 1995, 1997, 1999, 2001, 2007, 2009.
Note: This graph contains weighted results.
Nebraska - YRBS, 1991-2017 - QN29
Slide30Percentage of High School Students Who Currently Smoked Cigarettes Frequently,* 1991-2017†
*On 20 or more days during the 30 days before the survey†Decreased 1991-2016, decreased 1991-2005, decreased 2005-2016 [Based on linear and quadratic trend analyses using logistic regression models controlling for sex, race/ethnicity, and grade (p < 0.05). Significant linear trends (if present) across all available years are described first followed by linear changes in each segment of significant quadratic trends (if present).]Data not available for 1995, 1997, 1999, 2001, 2007, 2009.
Note: This graph contains weighted results.
Nebraska - YRBS, 1991-2017 - QNFRCIG
Slide31Percentage of High School Students Who Currently Smoked Cigarettes Daily,* by Sex, Grade,† and Race/Ethnicity, 2016
*On all 30 days during the 30 days before the survey†11th > 9th (Based on t-test analysis, p < 0.05.)All Hispanic students are included in the Hispanic category. All other races are non-Hispanic.
Missing bar indicates fewer than 100 students in this subgroup.Note: This graph contains weighted results.
Nebraska - YRBS, 2016 - QNDAYCIG
Slide32Percentage of High School Students Who Currently Smoked Cigarettes Daily,* 1991-2017†
*On all 30 days during the 30 days before the survey†Decreased 1991-2016, decreased 1991-2005, decreased 2005-2016 [Based on linear and quadratic trend analyses using logistic regression models controlling for sex, race/ethnicity, and grade (p < 0.05). Significant linear trends (if present) across all available years are described first followed by linear changes in each segment of significant quadratic trends (if present).]Data not available for 1995, 1997, 1999, 2001, 2007, 2009.
Note: This graph contains weighted results.
Nebraska - YRBS, 1991-2017 - QNDAYCIG
Slide33Percentage of High School Students Who Smoked More Than 10 Cigarettes Per Day,* by Sex, Grade, and Race/Ethnicity, 2016
*On the days they smoked during the 30 days before the survey, among students who currently smoked cigarettesAll Hispanic students are included in the Hispanic category. All other races are non-Hispanic.Missing bar indicates fewer than 100 students in this subgroup.Note: This graph contains weighted results.
Nebraska - YRBS, 2016 - QN33
Slide34Percentage of High School Students Who Smoked More Than 10 Cigarettes Per Day,* 1991-2017†
*On the days they smoked during the 30 days before the survey, among students who currently smoked cigarettes†Decreased 1991-2016 [Based on linear and quadratic trend analyses using logistic regression models controlling for sex, race/ethnicity, and grade (p < 0.05). Significant linear trends (if present) across all available years are described first followed by linear changes in each segment of significant quadratic trends (if present).]Data not available for 1995, 1997, 1999, 2001, 2007, 2009.
Note: This graph contains weighted results.
Nebraska - YRBS, 1991-2017 - QN33
Slide35Percentage of High School Students Who Ever Used an Electronic Vapor Product,* by Sex, Grade,† and Race/Ethnicity, 2016
*Including e-cigarettes, e-cigars, e-pipes, vape pipes, vaping pens, e-hookahs, and hookah pens [such as blu, NJOY, Vuse, MarkTen, Logic, Vapin Plus, eGo, and Halo]†10th > 9th, 11th > 9th, 12th > 9th (Based on t-test analysis, p < 0.05.)
All Hispanic students are included in the Hispanic category. All other races are non-Hispanic.Missing bar indicates fewer than 100 students in this subgroup.Note: This graph contains weighted results.
Nebraska - YRBS, 2016 - QN34
Slide36Percentage of High School Students Who Ever Used an Electronic Vapor Product,* 2014-2017†
*Including e-cigarettes, e-cigars, e-pipes, vape pipes, vaping pens, e-hookahs, and hookah pens [such as blu, NJOY, Vuse, MarkTen, Logic, Vapin Plus, eGo, and Halo]†No change 2014-2016 [Based on linear trend analyses using logistic regression models controlling for sex, race/ethnicity, and grade (p < 0.05).]Note: This graph contains weighted results.
Nebraska - YRBS, 2014-2017 - QN34
Slide37Percentage of High School Students Who Currently Used an Electronic Vapor Product,* by Sex,† Grade,† and Race/Ethnicity,
2016*Including e-cigarettes, e-cigars, e-pipes, vape pipes, vaping pens, e-hookahs, and hookah pens [such as blu, NJOY, Vuse, MarkTen, Logic, Vapin Plus, eGo, and Halo], on at least 1 day during the 30 days before the survey†
M > F; 12th > 9th (Based on t-test analysis, p < 0.05.)All Hispanic students are included in the Hispanic category. All other races are non-Hispanic.Missing bar indicates fewer than 100 students in this subgroup.
Note: This graph contains weighted results.
Nebraska - YRBS, 2016 - QN35
Slide38Percentage of High School Students Who Currently Used an Electronic Vapor Product,* 2014-2017†
*Including e-cigarettes, e-cigars, e-pipes, vape pipes, vaping pens, e-hookahs, and hookah pens [such as blu, NJOY, Vuse, MarkTen, Logic, Vapin Plus, eGo, and Halo], on at least 1 day during the 30 days before the survey†Decreased 2014-2016 [Based on linear trend analyses using logistic regression models controlling for sex, race/ethnicity, and grade (p < 0.05).]Note: This graph contains weighted results.
Nebraska - YRBS, 2014-2017 - QN35
Slide39Percentage of High School Students Who Usually Got Their Own Electronic Vapor Products by Buying Them in a Store,* by Sex, Grade, and Race/Ethnicity, 2016
*Such as a convenience store, supermarket, discount store, gas station, or vape store, during the 30 days before the survey, among students who currently used electronic vapor products and who were aged <18 yearsAll Hispanic students are included in the Hispanic category. All other races are non-Hispanic.Missing bar indicates fewer than 100 students in this subgroup.
Note: This graph contains weighted results.
Nebraska - YRBS, 2016 - QN36
Slide40Percentage of High School Students Who Currently Smoked Cigarettes or Cigars or Used Smokeless Tobacco or Electronic Vapor Products,* by Sex,† Grade,†
and Race/Ethnicity, 2016*On at least 1 day during the 30 days before the survey†M > F; 11th > 9th, 12th > 9th (Based on t-test analysis, p < 0.05.)
All Hispanic students are included in the Hispanic category. All other races are non-Hispanic.Missing bar indicates fewer than 100 students in this subgroup.
Note: This graph contains weighted results.
Nebraska - YRBS, 2016 - QNTB4
Slide41Percentage of High School Students Who Tried to Quit Using All Tobacco Products,* by Sex, Grade, and Race/Ethnicity, 2016
*Including cigarettes, cigars, smokeless tobacco, shisha or hookah tobacco, and electronic vapor products, ever during the 12 months before the survey, among students who used any tobacco products during the 12 months before the surveyAll Hispanic students are included in the Hispanic category. All other races are non-Hispanic.Missing bar indicates fewer than 100 students in this subgroup.
Note: This graph contains weighted results.
Nebraska - YRBS, 2016 - QN39
Slide42Percentage of High School Students Who Ever Drank Alcohol,* by Sex,† Grade,† and Race/Ethnicity,
2016*At least one drink of alcohol, on at least 1 day during their life†F > M; 11th > 9th, 12th > 9th, 12th > 10th (Based on t-test analysis, p < 0.05.)
All Hispanic students are included in the Hispanic category. All other races are non-Hispanic.Missing bar indicates fewer than 100 students in this subgroup.
Note: This graph contains weighted results.
Nebraska - YRBS, 2016 - QN40
Slide43Percentage of High School Students Who Ever Drank Alcohol,* 1991-2017†
*At least one drink of alcohol, on at least 1 day during their life†Decreased 1991-2016, decreased 1991-2003, decreased 2003-2016 [Based on linear and quadratic trend analyses using logistic regression models controlling for sex, race/ethnicity, and grade (p < 0.05). Significant linear trends (if present) across all available years are described first followed by linear changes in each segment of significant quadratic trends (if present).]Data not available for 1995, 1997, 1999, 2001, 2007, 2009.
Note: This graph contains weighted results.
Nebraska - YRBS, 1991-2017 - QN40
Slide44Percentage of High School Students Who Had Their First Drink of Alcohol Before Age 13 Years,* by Sex, Grade, and Race/Ethnicity, 2016
*Other than a few sipsAll Hispanic students are included in the Hispanic category. All other races are non-Hispanic.Missing bar indicates fewer than 100 students in this subgroup.Note: This graph contains weighted results.
Nebraska - YRBS, 2016 - QN41
Slide45Percentage of High School Students Who Had Their First Drink of Alcohol Before Age 13 Years,* 1991-2017†
*Other than a few sips†Decreased 1991-2016, decreased 1991-2003, decreased 2003-2016 [Based on linear and quadratic trend analyses using logistic regression models controlling for sex, race/ethnicity, and grade (p < 0.05). Significant linear trends (if present) across all available years are described first followed by linear changes in each segment of significant quadratic trends (if present).]Data not available for 1995, 1997, 1999, 2001, 2007, 2009.
Note: This graph contains weighted results.Nebraska - YRBS, 1991-2017 - QN41
Slide46Percentage of High School Students Who Currently Drank Alcohol,* by Sex,† Grade,† and Race/Ethnicity,
2016*At least one drink of alcohol, on at least 1 day during the 30 days before the survey†F > M; 10th > 9th, 11th > 9th, 12th > 9th, 12th > 10th (Based on t-test analysis, p < 0.05.)
All Hispanic students are included in the Hispanic category. All other races are non-Hispanic.Missing bar indicates fewer than 100 students in this subgroup.
Note: This graph contains weighted results.
Nebraska - YRBS, 2016 - QN42
Slide47Percentage of High School Students Who Currently Drank Alcohol,* 1991-2017†
*At least one drink of alcohol, on at least 1 day during the 30 days before the survey†Decreased 1991-2016, decreased 1991-2003, decreased 2003-2016 [Based on linear and quadratic trend analyses using logistic regression models controlling for sex, race/ethnicity, and grade (p < 0.05). Significant linear trends (if present) across all available years are described first followed by linear changes in each segment of significant quadratic trends (if present).]Data not available for 1995, 1997, 1999, 2001, 2007, 2009.
Note: This graph contains weighted results.
Nebraska - YRBS, 1991-2017 - QN42
Slide48Percentage of High School Students Who Usually Got the Alcohol They Drank by Someone Giving It to Them,* by Sex, Grade, and Race/Ethnicity, 2016
*During the 30 days before the survey, among students who currently drank alcoholAll Hispanic students are included in the Hispanic category. All other races are non-Hispanic.Missing bar indicates fewer than 100 students in this subgroup.Note: This graph contains weighted results.
Nebraska - YRBS, 2016 - QN43
Slide49Percentage of High School Students Who Usually Got the Alcohol They Drank by Someone Giving It to Them,* 2012-2017†
*During the 30 days before the survey, among students who currently drank alcohol†No change 2012-2016 [Based on linear trend analyses using logistic regression models controlling for sex, race/ethnicity, and grade (p < 0.05).]Note: This graph contains weighted results.
Nebraska - YRBS, 2012-2017 - QN43
Slide50Percentage of High School Students Who Currently Used Marijuana,* by Sex, Grade,† and Race/Ethnicity, 2016
*One or more times during the 30 days before the survey†11th > 9th, 12th > 9th (Based on t-test analysis, p < 0.05.)All Hispanic students are included in the Hispanic category. All other races are non-Hispanic.
Missing bar indicates fewer than 100 students in this subgroup.Note: This graph contains weighted results.
Nebraska - YRBS, 2016 - QN48
Slide51Percentage of High School Students Who Currently Used Marijuana,* 1991-2017†
*One or more times during the 30 days before the survey†Increased, 1991-2003, decreased, 2003-2016 [Based on linear and quadratic trend analyses using logistic regression models controlling for sex, race/ethnicity, and grade (p < 0.05). Significant linear trends (if present) across all available years are described first followed by linear changes in each segment of significant quadratic trends (if present).]Data not available for 1995, 1997, 1999, 2001, 2007, 2009.
Note: This graph contains weighted results.Nebraska - YRBS, 1991-2017 - QN48
Slide52Percentage of High School Students Who Ever Used Cocaine,* by Sex, Grade,† and Race/Ethnicity, 2016
*Any form of cocaine, including powder, crack, or freebase, one or more times during their life†12th > 9th (Based on t-test analysis, p < 0.05.)
All Hispanic students are included in the Hispanic category. All other races are non-Hispanic.Missing bar indicates fewer than 100 students in this subgroup.Note: This graph contains weighted results.
Nebraska - YRBS, 2016 - QN49
Slide53Percentage of High School Students Who Ever Used Cocaine,* 1991-2017†
*Any form of cocaine, including powder, crack, or freebase, one or more times during their life†Decreased 1991-2016, increased 1991-2005, decreased 2005-2016 [Based on linear and quadratic trend analyses using logistic regression models controlling for sex, race/ethnicity, and grade (p < 0.05). Significant linear trends (if present) across all available years are described first followed by linear changes in each segment of significant quadratic trends (if present).]Data not available for 1995, 1997, 1999, 2001, 2007, 2009.
Note: This graph contains weighted results.
Nebraska - YRBS, 1991-2017 - QN49
Slide54Percentage of High School Students Who Ever Used Inhalants,* by Sex, Grade, and Race/Ethnicity,† 2016
*Sniffed glue, breathed the contents of aerosol spray cans, or inhaled any paints or sprays to get high, one or more times during their life†H > W (Based on t-test analysis, p < 0.05.)
All Hispanic students are included in the Hispanic category. All other races are non-Hispanic.Missing bar indicates fewer than 100 students in this subgroup.Note: This graph contains weighted results.
Nebraska - YRBS, 2016 - QN50
Slide55Percentage of High School Students Who Ever Used Inhalants,* 2003-2017†
*Sniffed glue, breathed the contents of aerosol spray cans, or inhaled any paints or sprays to get high, one or more times during their life†Decreased 2003-2016 [Based on linear and quadratic trend analyses using logistic regression models controlling for sex, race/ethnicity, and grade (p < 0.05). Significant linear trends (if present) across all available years are described first followed by linear changes in each segment of significant quadratic trends (if present).]Data not available for 2007, 2009.
Note: This graph contains weighted results.
Nebraska - YRBS, 2003-2017 - QN50
Slide56Percentage of High School Students Who Ever Used Heroin,* by Sex,† Grade, and Race/Ethnicity, 2016
*Also called "smack," "junk," or "China White," one or more times during their life†M > F (Based on t-test analysis, p < 0.05.)All Hispanic students are included in the Hispanic category. All other races are non-Hispanic.
Missing bar indicates fewer than 100 students in this subgroup.Note: This graph contains weighted results.
Nebraska - YRBS, 2016 - QN51
Slide57Percentage of High School Students Who Ever Used Heroin,* 2003-2017†
*Also called "smack," "junk," or "China White," one or more times during their life†Decreased 2003-2016 [Based on linear and quadratic trend analyses using logistic regression models controlling for sex, race/ethnicity, and grade (p < 0.05). Significant linear trends (if present) across all available years are described first followed by linear changes in each segment of significant quadratic trends (if present).]Data not available for 2007, 2009.
Note: This graph contains weighted results.Nebraska - YRBS, 2003-2017 - QN51
Slide58Percentage of High School Students Who Ever Used Methamphetamines,* by Sex,† Grade,† and Race/Ethnicity,
2016*Also called "speed," "crystal," "crank," or "ice," one or more times during their life†M > F; 12th > 10th (Based on t-test analysis, p < 0.05.)
All Hispanic students are included in the Hispanic category. All other races are non-Hispanic.Missing bar indicates fewer than 100 students in this subgroup.
Note: This graph contains weighted results.
Nebraska - YRBS, 2016 - QN52
Slide59Percentage of High School Students Who Ever Used Methamphetamines,* 2003-2017†
*Also called "speed," "crystal," "crank," or "ice," one or more times during their life†Decreased 2003-2016 [Based on linear and quadratic trend analyses using logistic regression models controlling for sex, race/ethnicity, and grade (p < 0.05). Significant linear trends (if present) across all available years are described first followed by linear changes in each segment of significant quadratic trends (if present).]Data not available for 2007, 2009.
Note: This graph contains weighted results.Nebraska - YRBS, 2003-2017 - QN52
Slide60Percentage of High School Students Who Ever Took Prescription Pain Medicine Without a Doctor's Prescription or Differently Than How a Doctor Told Them to Use It,* by Sex, Grade,† and Race/Ethnicity,
2016*Counting drugs such as codeine, Vicodin, OxyContin, Hydrocodone, and Percocet, one or more times during their life†11th > 10th, 12th > 9th, 12th > 10th (Based on t-test analysis, p < 0.05.)
All Hispanic students are included in the Hispanic category. All other races are non-Hispanic.Missing bar indicates fewer than 100 students in this subgroup.
Note: This graph contains weighted results.
Nebraska - YRBS, 2016 - QN56
Slide61Percentage of High School Students Who Ever Injected Any Illegal Drug,* by Sex, Grade, and Race/Ethnicity, 2016
*Used a needle to inject any illegal drug into their body, one or more times during their lifeAll Hispanic students are included in the Hispanic category. All other races are non-Hispanic.Missing bar indicates fewer than 100 students in this subgroup.Note: This graph contains weighted results.
Nebraska - YRBS, 2016 - QN57
Slide62Percentage of High School Students Who Ever Injected Any Illegal Drug,* 2003-2017†
*Used a needle to inject any illegal drug into their body, one or more times during their life†No change 2003-2016 [Based on linear and quadratic trend analyses using logistic regression models controlling for sex, race/ethnicity, and grade (p < 0.05). Significant linear trends (if present) across all available years are described first followed by linear changes in each segment of significant quadratic trends (if present).]Data not available for 2007, 2009.
Note: This graph contains weighted results.Nebraska - YRBS, 2003-2017 - QN57
Slide63Percentage of High School Students Who Were Offered, Sold, or Given an Illegal Drug on School Property,* by Sex, Grade, and Race/Ethnicity, 2016
*During the 12 months before the surveyAll Hispanic students are included in the Hispanic category. All other races are non-Hispanic.Missing bar indicates fewer than 100 students in this subgroup.Note: This graph contains weighted results.
Nebraska - YRBS, 2016 - QN58
Slide64Percentage of High School Students Who Were Offered, Sold, or Given an Illegal Drug on School Property,* 1993-2017†
*During the 12 months before the survey†Increased 1993-2016, increased 1993-2005, decreased 2005-2016 [Based on linear and quadratic trend analyses using logistic regression models controlling for sex, race/ethnicity, and grade (p < 0.05). Significant linear trends (if present) across all available years are described first followed by linear changes in each segment of significant quadratic trends (if present).]Data not available for 1995, 1997, 1999, 2001, 2007, 2009.
Note: This graph contains weighted results.
Nebraska - YRBS, 1993-2017 - QN58
Slide65Percentage of High School Students Who Ever Had Sexual Intercourse, by Sex, Grade,* and Race/Ethnicity, 2016
*10th > 9th, 11th > 9th, 11th > 10th, 12th > 9th, 12th > 10th (Based on t-test analysis, p < 0.05.)All Hispanic students are included in the Hispanic category. All other races are non-Hispanic.
Missing bar indicates fewer than 100 students in this subgroup.Note: This graph contains weighted results.
Nebraska - YRBS, 2016 - QN59
Slide66Percentage of High School Students Who Ever Had Sexual Intercourse, 1991-2017*
*Decreased 1991-2016, decreased 1991-2010, decreased 2010-2016 [Based on linear and quadratic trend analyses using logistic regression models controlling for sex, race/ethnicity, and grade (p < 0.05). Significant linear trends (if present) across all available years are described first followed by linear changes in each segment of significant quadratic trends (if present).]Data not available for 1995, 1997, 1999, 2001, 2007, 2009.
Note: This graph contains weighted results.Nebraska - YRBS, 1991-2017 - QN59
Slide67Percentage of High School Students Who Had Sexual Intercourse for the First Time Before Age 13 Years, by Sex, Grade, and Race/Ethnicity, 2016
All Hispanic students are included in the Hispanic category. All other races are non-Hispanic.Missing bar indicates fewer than 100 students in this subgroup.Note: This graph contains weighted results.
Nebraska - YRBS, 2016 - QN60
Slide68Percentage of High School Students Who Had Sexual Intercourse for the First Time Before Age 13 Years, 1991-2017*
*Decreased 1991-2016 [Based on linear and quadratic trend analyses using logistic regression models controlling for sex, race/ethnicity, and grade (p < 0.05). Significant linear trends (if present) across all available years are described first followed by linear changes in each segment of significant quadratic trends (if present).]Data not available for 1995, 1997, 1999, 2001, 2007, 2009.Note: This graph contains weighted results.
Nebraska - YRBS, 1991-2017 - QN60
Slide69Percentage of High School Students Who Had Sexual Intercourse with Four or More Persons During Their Life, by Sex, Grade,* and Race/Ethnicity, 2016
*10th > 9th, 11th > 9th, 12th > 9th (Based on t-test analysis, p < 0.05.)All Hispanic students are included in the Hispanic category. All other races are non-Hispanic.
Missing bar indicates fewer than 100 students in this subgroup.Note: This graph contains weighted results.
Nebraska - YRBS, 2016 - QN61
Slide70Percentage of High School Students Who Used a Condom During Last Sexual Intercourse,* 1991-2017†
*Among students who were currently sexually active†Increased 1991-2016, increased 1991-2012, decreased 2012-2016 [Based on linear and quadratic trend analyses using logistic regression models controlling for sex, race/ethnicity, and grade (p < 0.05). Significant linear trends (if present) across all available years are described first followed by linear changes in each segment of significant quadratic trends (if present).]Data not available for 1995, 1997, 1999, 2001, 2007, 2009.
Note: This graph contains weighted results.
Nebraska - YRBS, 1991-2017 - QN64
Slide71Percentage of High School Students Who Used Birth Control Pills Before Last Sexual Intercourse,* by Sex, Grade, and Race/Ethnicity, 2016
*To prevent pregnancy, among students who were currently sexually activeAll Hispanic students are included in the Hispanic category. All other races are non-Hispanic.Missing bar indicates fewer than 100 students in this subgroup.Note: This graph contains weighted results.
Nebraska - YRBS, 2016 - QN65
Slide72Percentage of High School Students Who Used Birth Control Pills Before Last Sexual Intercourse,* 1991-2017†
*To prevent pregnancy, among students who were currently sexually active†No change 1991-2016 [Based on linear and quadratic trend analyses using logistic regression models controlling for sex, race/ethnicity, and grade (p < 0.05). Significant linear trends (if present) across all available years are described first followed by linear changes in each segment of significant quadratic trends (if present).]Data not available for 1995, 1997, 1999, 2001, 2007, 2009.
Note: This graph contains weighted results.
Nebraska - YRBS, 1991-2017 - QN65
Slide73Percentage of High School Students Who Used an IUD (e.g., Mirena or Paragard) or Implant (e.g., Implanon or Nexplanon),* by Sex, Grade, and Race/Ethnicity, 2016
*Before last sexual intercourse to prevent pregnancy among students who were currently sexually activeAll Hispanic students are included in the Hispanic category. All other races are non-Hispanic.Missing bar indicates fewer than 100 students in this subgroup.
Note: This graph contains weighted results.Nebraska - YRBS, 2016 - QNIUDIMP
Slide74Percentage of High School Students Who Used an IUD (e.g., Mirena or Paragard) or Implant (e.g., Implanon or Nexplanon),* 2014-2017†
*Before last sexual intercourse to prevent pregnancy among students who were currently sexually active†No change 2014-2016 [Based on linear trend analyses using logistic regression models controlling for sex, race/ethnicity, and grade (p < 0.05).]Note: This graph contains weighted results.
Nebraska - YRBS, 2014-2017 - QNIUDIMP
Slide75Percentage of High School Students Who Used a Shot (e.g., Depo-Provera), Patch (e.g., Orthoevra), or Birth Control Ring (e.g., Nuvaring),* by Sex, Grade, and Race/Ethnicity, 2016
*During last sexual intercourse among students who were currently sexually activeAll Hispanic students are included in the Hispanic category. All other races are non-Hispanic.Missing bar indicates fewer than 100 students in this subgroup.
Note: This graph contains weighted results.Nebraska - YRBS, 2016 - QNSHPARG
Slide76Percentage of High School Students Who Used a Shot (e.g., Depo-Provera), Patch (e.g., Orthoevra), or Birth Control Ring (e.g., Nuvaring),* 2014-2017†
*During last sexual intercourse among students who were currently sexually active†No change 2014-2016 [Based on linear trend analyses using logistic regression models controlling for sex, race/ethnicity, and grade (p < 0.05).]Note: This graph contains weighted results.
Nebraska - YRBS, 2014-2017 - QNSHPARG
Slide77Percentage of High School Students Who Used Birth Control Pills; an IUD or Implant; or a Shot, Patch, or Birth Control Ring,* by Sex,† Grade, and Race/Ethnicity,
2016*Before last sexual intercourse to prevent pregnancy among students who were currently sexually active†F > M (Based on t-test analysis, p < 0.05.)
All Hispanic students are included in the Hispanic category. All other races are non-Hispanic.Missing bar indicates fewer than 100 students in this subgroup.Note: This graph contains weighted results.
Nebraska - YRBS, 2016 - QNOTHHPL
Slide78Percentage of High School Students Who Used Birth Control Pills; an IUD or Implant; or a Shot, Patch, or Birth Control Ring,* 2014-2017†
*Before last sexual intercourse to prevent pregnancy among students who were currently sexually active†No change 2014-2016 [Based on linear trend analyses using logistic regression models controlling for sex, race/ethnicity, and grade (p < 0.05).]Note: This graph contains weighted results.
Nebraska - YRBS, 2014-2017 - QNOTHHPL
Slide79Percentage of High School Students Who Used Both a Condom During and Birth Control Pills; an IUD or Implant; or a Shot, Patch, or Birth Control Ring Before Last Sexual Intercourse,* by Sex, Grade, and Race/Ethnicity, 2016
*To prevent STD and pregnancy among students who were currently sexually activeAll Hispanic students are included in the Hispanic category. All other races are non-Hispanic.Missing bar indicates fewer than 100 students in this subgroup.
Note: This graph contains weighted results.Nebraska - YRBS, 2016 - QNDUALBC
Slide80Percentage of High School Students Who Were Overweight,* 2003-2017†
* ≥ 85th percentile but <95th percentile for body mass index, based on sex- and age-specific reference data from the 2000 CDC growth charts. In 2017, new, slightly different ranges were used to calculate biologically implausible responses to height and weight questions.†No change, 2003-2010, increased, 2010-2016 [Based on linear and quadratic trend analyses using logistic regression models controlling for sex, race/ethnicity, and grade (p < 0.05). Significant linear trends (if present) across all available years are described first followed by linear changes in each segment of significant quadratic trends (if present).]
Data not available for 2007, 2009.Note: This graph contains weighted results.
Nebraska - YRBS, 2003-2017 - QNOWT
Slide81Percentage of High School Students Who Described Themselves As Slightly or Very Overweight, by Sex,* Grade, and Race/Ethnicity,*
2016*F > M; H > W (Based on t-test analysis, p < 0.05.)
All Hispanic students are included in the Hispanic category. All other races are non-Hispanic.Missing bar indicates fewer than 100 students in this subgroup.Note: This graph contains weighted results.
Nebraska - YRBS, 2016 - QN68
Slide82Percentage of High School Students Who Described Themselves As Slightly or Very Overweight, 1991-2017*
*Decreased 1991-2016 [Based on linear and quadratic trend analyses using logistic regression models controlling for sex, race/ethnicity, and grade (p < 0.05). Significant linear trends (if present) across all available years are described first followed by linear changes in each segment of significant quadratic trends (if present).]Data not available for 1995, 1997, 1999, 2001, 2007, 2009.Note: This graph contains weighted results.
Nebraska - YRBS, 1991-2017 - QN68
Slide83Percentage of High School Students Who Were Trying to Lose Weight, by Sex,* Grade, and Race/Ethnicity,*
2016*F > M; H > W (Based on t-test analysis, p < 0.05.)
All Hispanic students are included in the Hispanic category. All other races are non-Hispanic.Missing bar indicates fewer than 100 students in this subgroup.Note: This graph contains weighted results.
Nebraska - YRBS, 2016 - QN69
Slide84Percentage of High School Students Who Were Trying to Lose Weight, 1991-2017*
*Decreased 1991-2016, no change 1991-2005, decreased 2005-2016 [Based on linear and quadratic trend analyses using logistic regression models controlling for sex, race/ethnicity, and grade (p < 0.05). Significant linear trends (if present) across all available years are described first followed by linear changes in each segment of significant quadratic trends (if present).]Data not available for 1995, 1997, 1999, 2001, 2007, 2009.
Note: This graph contains weighted results.Nebraska - YRBS, 1991-2017 - QN69
Slide85Percentage of High School Students Who Did Not Drink Fruit Juice,* by Sex, Grade, and Race/Ethnicity, 2016
*100% fruit juices one or more times during the 7 days before the surveyAll Hispanic students are included in the Hispanic category. All other races are non-Hispanic.Missing bar indicates fewer than 100 students in this subgroup.Note: This graph contains weighted results.
Nebraska - YRBS, 2016 - QN70
Slide86Percentage of High School Students Who Did Not Drink Fruit Juice,* 2003-2017†
*100% fruit juices one or more times during the 7 days before the survey†Increased 2003-2016 [Based on linear and quadratic trend analyses using logistic regression models controlling for sex, race/ethnicity, and grade (p < 0.05). Significant linear trends (if present) across all available years are described first followed by linear changes in each segment of significant quadratic trends (if present).]Data not available for 2007, 2009.
Note: This graph contains weighted results.Nebraska - YRBS, 2003-2017 - QN70
Slide87Percentage of High School Students Who Did Not Eat Fruit,* by Sex,† Grade,† and Race/Ethnicity,
2016*One or more times during the 7 days before the survey†M > F; 12th > 10th (Based on t-test analysis, p < 0.05.)
All Hispanic students are included in the Hispanic category. All other races are non-Hispanic.Missing bar indicates fewer than 100 students in this subgroup.Note: This graph contains weighted results.
Nebraska - YRBS, 2016 - QN71
Slide88Percentage of High School Students Who Did Not Eat Fruit,* 2003-2017†
*One or more times during the 7 days before the survey†Decreased 2003-2016 [Based on linear and quadratic trend analyses using logistic regression models controlling for sex, race/ethnicity, and grade (p < 0.05). Significant linear trends (if present) across all available years are described first followed by linear changes in each segment of significant quadratic trends (if present).]Data not available for 2007, 2009.Note: This graph contains weighted results.
Nebraska - YRBS, 2003-2017 - QN71
Slide89Percentage of High School Students Who Did Not Eat Fruit or Drink 100% Fruit Juices,* by Sex, Grade, and Race/Ethnicity, 2016
*Such as orange juice, apple juice, or grape juice, during the 7 days before the surveyAll Hispanic students are included in the Hispanic category. All other races are non-Hispanic.Missing bar indicates fewer than 100 students in this subgroup.Note: This graph contains weighted results.
Nebraska - YRBS, 2016 - QNFR0
Slide90Percentage of High School Students Who Ate Fruit or Drank 100% Fruit Juices Three or More Times Per Day,* 2003-2017†
*Such as orange juice, apple juice, or grape juice, during the 7 days before the survey†No change 2003-2016 [Based on linear and quadratic trend analyses using logistic regression models controlling for sex, race/ethnicity, and grade (p < 0.05). Significant linear trends (if present) across all available years are described first followed by linear changes in each segment of significant quadratic trends (if present).]Data not available for 2007, 2009.
Note: This graph contains weighted results.
Nebraska - YRBS, 2003-2017 - QNFR3
Slide91Percentage of High School Students Who Did Not Eat Green Salad,* by Sex,† Grade, and Race/Ethnicity,†
2016*One or more times during the 7 days before the survey†M > F; H > W (Based on t-test analysis, p < 0.05.)
All Hispanic students are included in the Hispanic category. All other races are non-Hispanic.Missing bar indicates fewer than 100 students in this subgroup.Note: This graph contains weighted results.
Nebraska - YRBS, 2016 - QN72
Slide92Percentage of High School Students Who Did Not Eat Green Salad,* 2003-2017†
*One or more times during the 7 days before the survey†Increased 2003-2016 [Based on linear and quadratic trend analyses using logistic regression models controlling for sex, race/ethnicity, and grade (p < 0.05). Significant linear trends (if present) across all available years are described first followed by linear changes in each segment of significant quadratic trends (if present).]Data not available for 2007, 2009.Note: This graph contains weighted results.
Nebraska - YRBS, 2003-2017 - QN72
Slide93Percentage of High School Students Who Did Not Eat Potatoes,* by Sex, Grade,† and Race/Ethnicity,†
2016*One or more times during the 7 days before the survey†9th > 10th; H > W (Based on t-test analysis, p < 0.05.)
All Hispanic students are included in the Hispanic category. All other races are non-Hispanic.Missing bar indicates fewer than 100 students in this subgroup.Note: This graph contains weighted results.
Nebraska - YRBS, 2016 - QN73
Slide94Percentage of High School Students Who Did Not Eat Potatoes,* 2003-2017†
*One or more times during the 7 days before the survey†Increased 2003-2016 [Based on linear and quadratic trend analyses using logistic regression models controlling for sex, race/ethnicity, and grade (p < 0.05). Significant linear trends (if present) across all available years are described first followed by linear changes in each segment of significant quadratic trends (if present).]Data not available for 2007, 2009.Note: This graph contains weighted results.
Nebraska - YRBS, 2003-2017 - QN73
Slide95Percentage of High School Students Who Did Not Eat Carrots,* by Sex, Grade, and Race/Ethnicity, 2016
*One or more times during the 7 days before the surveyAll Hispanic students are included in the Hispanic category. All other races are non-Hispanic.Missing bar indicates fewer than 100 students in this subgroup.Note: This graph contains weighted results.
Nebraska - YRBS, 2016 - QN74
Slide96Percentage of High School Students Who Did Not Eat Carrots,* 2003-2017†
*One or more times during the 7 days before the survey†Increased 2003-2016, increased 2003-2010, no change 2010-2016 [Based on linear and quadratic trend analyses using logistic regression models controlling for sex, race/ethnicity, and grade (p < 0.05). Significant linear trends (if present) across all available years are described first followed by linear changes in each segment of significant quadratic trends (if present).]Data not available for 2007, 2009.
Note: This graph contains weighted results.Nebraska - YRBS, 2003-2017 - QN74
Slide97Percentage of High School Students Who Did Not Eat Other Vegetables,* by Sex, Grade, and Race/Ethnicity, 2016
*One or more times during the 7 days before the surveyAll Hispanic students are included in the Hispanic category. All other races are non-Hispanic.Missing bar indicates fewer than 100 students in this subgroup.Note: This graph contains weighted results.
Nebraska - YRBS, 2016 - QN75
Slide98Percentage of High School Students Who Did Not Eat Other Vegetables,* 2003-2017†
*One or more times during the 7 days before the survey†Increased 2003-2016 [Based on linear and quadratic trend analyses using logistic regression models controlling for sex, race/ethnicity, and grade (p < 0.05). Significant linear trends (if present) across all available years are described first followed by linear changes in each segment of significant quadratic trends (if present).]Data not available for 2007, 2009.Note: This graph contains weighted results.
Nebraska - YRBS, 2003-2017 - QN75
Slide99Percentage of High School Students Who Did Not Eat Vegetables,* by Sex,† Grade, and Race/Ethnicity, 2016
*Green salad, potatoes [excluding French fries, fried potatoes, or potato chips], carrots, or other vegetables, during the 7 days before the survey†M > F (Based on t-test analysis, p < 0.05.)
All Hispanic students are included in the Hispanic category. All other races are non-Hispanic.Missing bar indicates fewer than 100 students in this subgroup.Note: This graph contains weighted results.
Nebraska - YRBS, 2016 - QNVEG0
Slide100Slide101Slide102Slide103Slide104Slide105Slide106Slide107Slide108Slide109Slide110Slide111Slide112Slide113Slide114Slide115Slide116Slide117Slide118Slide119Slide120Slide121Slide122Slide123Slide124Slide125Slide126Slide127Slide128Slide129Slide130Slide131Slide132Slide133Slide134Slide135Slide136Slide137Slide138Slide139Slide140Slide141Slide142Slide143Slide144Slide145Slide146Slide147Slide148Slide149Slide150Slide151Slide152Slide153Slide154Slide155Slide156Slide157Slide158Slide159Slide160Slide161Slide162Slide163Slide164Slide165Slide166Slide167Slide168Slide169Slide170Slide171Slide172Slide173Slide174Slide175Slide176Slide177Slide178Slide179Slide180Slide181Slide182Slide183Slide184Slide185Slide186Slide187Slide188Slide189Slide190Slide191Slide192Slide193Slide194Slide195Slide196Slide197Slide198Slide199Slide200Slide201Slide202Slide203Slide204Slide205Slide206Slide207Slide208Slide209Slide210Slide211Slide212Slide213Slide214Slide215Slide216Slide217Slide218Slide219Slide220Slide221Slide222Slide223Slide224Slide225Slide226Slide227Slide228Slide229Slide230Slide231Slide232Slide233