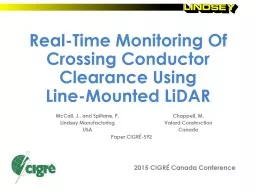
McCall J Spillane P Lindsey K Lindsey Manufacturing USA CIGRE US National Committee 2015 Grid of the Future Symposium The Trouble with Line Crossings Numerous variables affect clearance between crossing or colocated lines ID: 654610
Download Presentation The PPT/PDF document "Determining Crossing Conductor Clearance..." is the property of its rightful owner. Permission is granted to download and print the materials on this web site for personal, non-commercial use only, and to display it on your personal computer provided you do not modify the materials and that you retain all copyright notices contained in the materials. By downloading content from our website, you accept the terms of this agreement.
Slide1
Determining Crossing Conductor Clearance Using Line-Mounted LiDAR
McCall, J., Spillane, P., Lindsey, K.Lindsey ManufacturingUSA
CIGRE
US National Committee
2015 Grid of the Future SymposiumSlide2
The Trouble with Line Crossings
Numerous variables affect clearance between crossing or co-located lines:
Conductor
characteristics
Ambient temperature and wind assumptions (for conductor movement)
Insulator and structure deflection
Sag of each line, which depend on:
Current (for heating)
S
olar radiation
C
ooling
associated with
wind
Insulator
swing and tower movement from wind and conductor expansion/contraction,
Weight
effects of ice and snow
loading
etcSlide3
ENMAX
’ Particular Problem
138kV line co-located above a 25kV circuit for 9.3km
The T and D
lines
have
very
different
loading
profiles
New Shepard Energy Centre
adds
800MW
local generation
Altered
power flows
result
in very
different loading profiles on
138kV circuit
Identified
system
contingencies
could
result in
greatly
increased sag
Concern over verifying clearanceSlide4
Transmission Line Monitor with Integrated LiDAR
Enmax
chose the Lindsey TLM conductor monitor designed for dynamic line rating applications
Integrated LiDAR provides direct and continuous measurement of conductor
c
learance to ground
Accurately detects changes in clearance from:
Conductor sag from heating / cooling
Vegetation growthSlide5
138kV
25kV
Difference in measurements provides inter-line clearanceSlide6
Added algorithm to blocks s
tep
changes of
>1m:
Reported
line-to-ground clearance reported by
either TLM
Calculated difference
between monitor
sets
Bad Measurement
TRUCKINGSlide7
LiDAR Geometrical Corrections
LiDAR Angular CorrectionsBoth TILT (conductor slope) and ROLL (conductor roll) are correctedResult is a direct downward looking measurement
Conductor Swing (Lateral)Swing will result in either:
Slight under-reporting
(report C instead of B),or
Report worse case (A)
Based on application need, no compensation requiredSlide8
Clearance varies by 2.3m over the day
BUT…
138kV line current is 2x as high here
as it is here,
While 25kV current is almost constant
Counterintuitive:
Increased current produces increased sag
Should reduce clearance
What’s happening? Slide9
138kV Span Clearance Comparison
Why
do spans
less than ¼ mile away behave so differently?Slide10
138kV Span Elevation Comparison
Span A
Span BSlide11
138kV Span Elevation Comparison
Span A
Span B
Uniform adjacent spans
Elevated adjacent spans
Sag of the elevated spans lift the middle span.
A 100mm outward pull on the insulators results in 1.5m sag decreaseSlide12
Summary
Ensuring clearance between line crossings or parallel lines is awkward at bestLine mounted LiDAR-based monitors successfully provide direct measurement of crossing clearanceUnexpected phenomena, such as traffic, can be successfully dealt withNext Steps
Additional deployment of monitor steps along lineEvaluation of moving to pilot dynamic line rating system