PDF-Linear Algebra and Music Derrick Smith
Author : stefany-barnette | Published Date : 2014-12-01
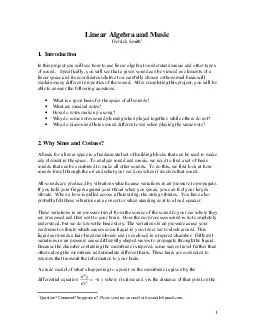
Introduction In this project you will see how to use linear algebra to understand music and other types of sound Specifically you will see that a given sound can
Presentation Embed Code
Download Presentation
Download Presentation The PPT/PDF document "Linear Algebra and Music Derrick Smith" is the property of its rightful owner. Permission is granted to download and print the materials on this website for personal, non-commercial use only, and to display it on your personal computer provided you do not modify the materials and that you retain all copyright notices contained in the materials. By downloading content from our website, you accept the terms of this agreement.
Linear Algebra and Music Derrick Smith: Transcript
Download Rules Of Document
"Linear Algebra and Music Derrick Smith"The content belongs to its owner. You may download and print it for personal use, without modification, and keep all copyright notices. By downloading, you agree to these terms.
Related Documents