PDF-Maple Pro ject olar Plots plot in maple the parametric equations with a yp the command plotft gt ta
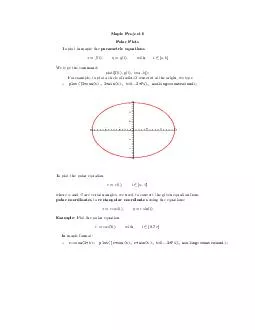
b or example to plot circle of radius cen tered at the origin yp plot3cost 3sint t02Pi scalingconstra ine d 1 3 2 2 1 3 plot the olar equation 57355 where and are
Download Presentation
"Maple Pro ject olar Plots plot in maple the parametric equat " is the property of its rightful owner. Permission is granted to download and print materials on this website for personal, non-commercial use only, provided you retain all copyright notices. By downloading content from our website, you accept the terms of this agreement.
Presentation Transcript
Transcript not available.