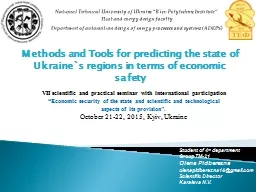
Heat and energy design faculty Department of automation design of energy processes and systems ADEPS Methods and Tools for predicting the state of Ukraines regions in terms of economic safety ID: 326368
Download Presentation The PPT/PDF document "National Technical University of Ukraine..." is the property of its rightful owner. Permission is granted to download and print the materials on this web site for personal, non-commercial use only, and to display it on your personal computer provided you do not modify the materials and that you retain all copyright notices contained in the materials. By downloading content from our website, you accept the terms of this agreement.
Slide1
National Technical University of Ukraine “Kiev Polytechnic Institute”Heat and energy design facultyDepartment of automation design of energy processes and systems (ADEPS)
Methods and Tools for predicting the state of Ukraine`s regions in terms of economic safety
VІI scientific and practical seminar with international participation
“Economic security of the state and scientific and technological aspects of its provision".
October 21-22, 2015, Kyiv, Ukraine
Student of 4
th
department
Group
TM-21
Olena
Pidberezna
olenapidberezna16@gmail.com
Scientific
Director
Karaieva
N.V.Slide2
Scientists estimated that there are over 150 different methods of predicting, but in practice only two or three dozen are used.To choose the method of prediction you should determine:
purpose;
problems of prediction;period for which it is formed;
take account of the specificity of the prediction`s object;
species, completeness and reliability of input data;other factors.Methods of predictingVІI scientific and practical seminar with international participation"Economic security of the state and scientific and technological aspects of its provision"Slide3
VІI scientific and practical seminar with international participation"Economic security of the state and scientific and technological aspects of its provision"Methods of predicting the general principle of action and ways to get informationSlide4
Value of the coefficient of correlationConnection[-0,1...0,1)feedback
[0,1...0,3)
slight[0,3...0,5)
moderate[
0,5...0,7)significant[0,7...0,9)high[0,9...0,99]
very
high
1,0
functional
Quality evaluation
Qualitative assessment of connection
degree
of random variables can be performed using the correlation coefficient of the
Cheddok`s
scale.
Cheddok`s scale
VІI scientific and practical seminar with international participation
"Economic security of the state and scientific and technological aspects of its provision
"Slide5
Methods of cluster analysis
Methods
of
cluster analysis
Hierarchical
N
on-hierarchical
A
gglomerative
D
i
visive
Algorithms
of
combining
:
CURE
The
methods
of grouping: method of nearest neighbor or a single bond; method of the most distant neighbors or full bond; Ward`s method; unweighted average pairwise method; method of inter-group communication.
Algorithms of Optimization: k-means; PAM; CLOPE; HCM (HardC-means); FuzzyC-means; Kohonen self-organizing maps and others.
Algorithms of division:- algorithm of BIRCH- algorithm of MST-
VІI scientific and practical seminar with international participation
"Economic security of the state and scientific and technological aspects of its provision
"Slide6
RegionIndicators
GRP(million UAH)EP
(million kg)SP
(million UAH)IP
(million UAH)I(million USD)E(million USD)
Kiev
69663,00
308,1
227722,60
55941,00
1982,97
4793,23
Donetsk
170775,00
1714,7664615,90158003,00
14127,184168,47
Dnipropetrovsk
147970,00
1173,1
447705,40
118823,00
10129,72
6538,26
…
………………Zaporizhia54828,00316124278,2059191,004004,802013,43Lviv61962,00253,9131984,6072828,001343,543373,48Odessa64743,00169141059,4070429,001784,644304,58Kiev city275685,00259,21378512,30194436,0012770,31
26115,99The value of selected ecological and economic indicators of development of Ukraine`s regions (2012 year)GRP - gross regional productEP - emissions of pollutants into the atmosphereSP - the volume of sold productsIP - income of populationE - exportI - importSlide7
Regression analysisThe regression equation will look like:
According to the indicators that
remained after the
multicollinear analysis, in the table, we can predict values of EP. It is Y*(for 25 regions of Ukraine).Slide8
Chartemissions of pollutants into the atmosphere(million kg)
predictable valuenumber of Ukraine`s regions
VІI scientific and practical seminar with international participation"Economic security of the state and scientific and technological aspects of its provision
"Slide9
software packages for statistical data processing;software for assessing the environmental parameters of economic activity;software for the analysis of safety engineering systems;
software packages to assess the financial parameters of enterprises;geoinformational data processing
with the using of GIS technology;Software tools
At present there are many software tools developed for the implementation of diverse analysis of economic security. Each of them has different specialization and is intended for processing components of analysis process:
VІI scientific and practical seminar with international participation"Economic security of the state and scientific and technological aspects of its provision"Slide10
The most famous foreign packages for statistical data processingBMDP, STATGRAPHICS
, SAS,
SPSS, E.
Views, RATS,
MikroTSP, Minitab, STADIA, SYSTAT, MEZOZAVR, EVRISTAThe basic functions of these software packages are:business graphics;parametric tests (Student’s t test, Fisher’s test, histogram);
nonparametric tests;
categorical analysis;
dispersion analysis (single, double, multi);
regression analysis;
time series (smoothing, filtering, autocorrelation);
multivariate methods;
VІI scientific and practical seminar with international participation
"Economic security of the state and scientific and technological aspects of its provision
"Slide11
Software packages for the valuation of financial options of enterprise
COMFAR, Project
Expert, "Alt-INVEST", "INEC-Holding", "Theo-INVEST", Energy Invest, "І
nvestor-PL", Millenium, "ALT-F
іnansi", "AFSP", "AuditExpert“which are classical approaches to financial analysisVІI scientific and practical seminar with international participation
"Economic security of the state and scientific and technological aspects of its provision
"Slide12
Means for making geoinformation analysis
COMPARATIVE DATAARCGIS
GRASSGISMAPINFO
GVSIGOPENNESS
-++-WORK WITH THE DB
+
+
+
-
OPTIMIZATION for working with SQL-server
+
+
+
-
FRONTENDODE, API ActiveX, COM, AMLAPI ActiveX, ODBC, BDEBDE, OLE DB, APIAPI ActiveX
The ability to create their own modules+-+
-
Tool GIS
PC Arc/Info, PC
ArcCad
, MapInfo, ArcGIS
GIS Viewers
ArcView,
GisView
, GeoDrawHelp mapping systemBY-Sell, ИНТЕК-2, WireMapVectorizer raster imagesMapEdit, TRACK, AURE, CorelDrawSpecialized tools of spatial modelingGeostatistical Software Tool V3.03, MAG SoftwareTYPES OF GISVІI scientific and practical seminar with international participation"Economic security of the state and scientific and technological aspects of its provision
"Slide13
Thanks for your attention!VІI scientific and practical seminar with international participation"Economic security of the state and scientific and technological aspects of its provision"