PPT-ORGANIZATION CHART
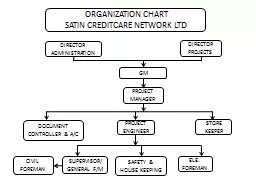
SATIN CREDITCARE NETWORK LTD GM DIRECTOR ADMINISTRATION PROJECT MANAGER DIRECTOR PROJECTS DOCUMENT CONTROLLER amp AC PROJECT ENGINEER STORE KEEPER ELE FOREMAN SUPERVISORGENERAL
Download Presentation
"ORGANIZATION CHART" is the property of its rightful owner. Permission is granted to download and print materials on this website for personal, non-commercial use only, provided you retain all copyright notices. By downloading content from our website, you accept the terms of this agreement.
Presentation Transcript
Transcript not available.