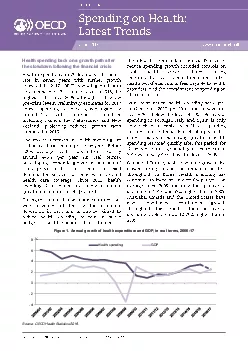
/
Source: NRF 2018 Back-to-School/College Spending Source: NRF 2018 Back-to-School/College Spending

Source: NRF 2018 Back-to-School/College Spending - PowerPoint Presentation

stefany-barnette
stefany-barnette . @stefany-barnette
Follow
349 views
Uploaded On 2019-02-25

Source: NRF 2018 Back-to-School/College Spending - PPT Presentation

Survey Excludes holidays and back to schoolcollege Valentines Day Is a Major Spending Event 2 2018 Expected Household Spend Valentines Day Isnt Just For Couples Source NRF Valentines Day 2018 ID: 753851

2018 source day broadcast source 2018 broadcast day gfk index adults valentine

Share:

Link:

Embed:

Download Presentation from below link

Download Presentation The PPT/PDF document "Source: NRF 2018 Back-to-School/College ..." is the property of its rightful owner. Permission is granted to download and print the materials on this web site for personal, non-commercial use only, and to display it on your personal computer provided you do not modify the materials and that you retain all copyright notices contained in the materials. By downloading content from our website, you accept the terms of this agreement.


Presentation Transcript

Slide1
Slide2

Source: NRF 2018 Back-to-School/College Spending

Survey; Excludes holidays and back to school/college.Valentine’s Day Is a Major Spending Event

2

2018

Expected Household SpendSlide3

Valentine’s Day Isn’t Just For Couples

Source: NRF Valentine’s Day 2018

$ Consumers Plan to Spend

3Slide4

Broadcast: Great Way to

Reach Valentine’s

Day Shoppers

Source: Nielsen NPower 1/1/2018 - 2/14/2018 Adults 25-54 Live+1

Ratings; Broadcast Includes all Networks and Syndication. 10 Cable Networks based on A25-54 Ratings.

Adults 25-54 Live+1 Ratings4Slide5

Broadcast TV’s Reach: Significantly Higher Than Cable

Source: Nielsen

NPower. February

7th 2018 Adults 25-54 Live+1 Ratings.5Slide6

TV

Influenced Retail Consumers Most6

Source: GfK TVB Purchase Funnel

2018 Retail Category (% Most important media type among those who saw/heard ads)Slide7

TV Has Highest Reach of Ad Supported Platforms

Source: GfK TVB Media Comparisons Study 2018. M-S 6A-12M. Persons 18+. Online/internet platforms such as e-mail, social media, internet radio and websites, are totaled for any online device-PC, Smartphone and Tablets. Broadcast TV News Websites/Apps includes local TV station & network websites/apps for news/weather/sports.

7Slide8

People Spend the Most Time with Television of All Ad Supported Platforms

Source: GfK TVB Media Comparisons Study 2018. M-S 6A-12M. Persons 18+. Online/internet platforms such as e-mail, social media, internet radio and websites, are totaled for any online device-PC, Smartphone and Tablets. Broadcast TV News Websites/Apps includes local TV station & network websites/apps for news/weather/sports.

8Slide9

Top Spending Categories For

Valentine’s Day

Source: NRF's 2018 annual Valentine's Day Spending Survey, conducted by Prosper Insights &

Analytics.In Billions

9Slide10

Broadcast Delivers Jewelry Shoppers

Source: GfK MRI Spring 2018 Adults 18

+ Index. Fine jewelry – purchased for someone else (gift).

Syndication

– Entertainment

Tonight,

Family Guy, Modern Family.

206

189

186

176

180

175

161

154

154

Index

161

10Slide11

Target Key Markets with Local TV

Source: GfK MRI

2018 Market-by-Market weighted by Adult 18+ population. Purchased Fine Jewelry at Jared, Kay or

Zales.

The Redder the

better

- High Index

11Slide12

Wining and Dining with Broadcast Viewers

Source: GfK MRI Spring 2018 Adults 18

+ Index. Spent

$100+ at a family restaurant/steakhouse in the last 30 days.

Syndication

– Seinfeld.

172

165

161

150

159

150

149

145

141

143

Index

12Slide13

Feast on Geographical Strengths with Local TV

Source: GfK MRI 2018 Market-by-Market weighted by Adult 18+ population. Bought at in the last 6 months: The Cheesecake Factory, Red Lobster.

The Redder the

better

- High Index

13Slide14

Consumers Plan to Shop at

Department, Discount Stores and Online

Source: NRF's 2018 annual Valentine's Day Spending Survey, conducted by Prosper Insights & Analytics.

14Slide15

Broadcast TV Delivers Department Store & Discount Store Shoppers

Source: GfK MRI Spring 2018 Adults 18+ Index. Shopped at a

Department Store

or Discount Store in the last 6 months for clothing, shoes, cosmetics, or perfume/cologne.

Department Stores

Discount Stores

15Slide16

Broadcast TV Delivers Online Shoppers

Source: GfK MRI Spring 2018 Adults 18+ Index.

Internet

Shopping: Spent $50 or more on any item in last 12 months.

142

141

139

130

137

126

125

124

122

123

Index

16Slide17

“Have TV ads influenced your search selections?”17

Source: GfK TVB Purchase Funnel 2018 Retail Category “When doing an online search, how often, if at all, have TV ads you have seen in this category influenced you in some ways in your search?” (Yes = combination of Every time, Most of the time & Sometimes)Slide18

Broadcast TV Websites/Apps Provide Multi-platform Opportunities

18Slide19

“When Visiting a Television Station’s Website or App,

do you View the Ads?”

19

Source: GfK TVB Purchase Funnel 2018 Retail Category “How often do you look at the video ads on that local television station’s website or app?” (Yes = combination of Every time, Most of the time & Sometimes)Slide20

Broadcast Television Reaches More Adults in

4

Days than YouTube Reaches in a Month...

20

Source: November 2018 Nielsen; Most Current, Live+SD. ComScore, People 2+, Data Source: VMX Desktop, 151,775,000 Unduplicated Viewers; All of YouTube Category compared to the 6 Broadcast Nets.

Time Frame

Days

# of Channels

2

1

6

5800

3

4

8

9

10

11

12

13

14

15

16

17

18

19

20

21

22

23

24

25

26

27

28

29

30

1

3

4

5

6

7

2Slide21

...And Broadcast TV Reaches More Adults

in

1

Day Than Social Media Videos Reach in a

Month21

Source: November 2018 Nielsen; Most Current, Live+SD. ComScore, People 2+, Data Source: VMX Desktop, 68,109,000 Unduplicated Viewers; All of Social Media Category compared to the 6 Broadcast Nets.

Time Frame

Days

29

30

31

1

8

9

10

11

12

13

14

15

16

17

18

19

20

21

22

23

24

25

26

27

28

29

30

1

3

4

5

6

7

2

35 Programs on 6 Networks

Nielsen 60 second viewer

requirement

4.9 Billion Videos on 79 Platforms

ComScore 3

second viewer

requirementSlide22

Key Valentine’s Day Takeaways

Valentine’s

Day is a major spending

event.Broadcast is a great way to reach Valentine’s Day shoppers.

Broadcast TV delivers high reach and targeted ratings.

People spend more time with TV – 5 times that of any other media platform.Top gifts for this Valentine’s Day are jewelry, and an evening out.

Local TV’s geographic flexibility allows advertisers to support high sales markets.

Broadcast TV delivers brick and mortar and online shoppers.

TV

ads

influence search

selections.

Local

Broadcast TV websites

offer

multi-platform

opportunities.

22Slide23