/
Most FrequentPrincipalDiagnosesfor Inpatient Stays in US Hospitals 201 Most FrequentPrincipalDiagnosesfor Inpatient Stays in US Hospitals 201

Most FrequentPrincipalDiagnosesfor Inpatient Stays in US Hospitals 201 - PDF document

stella
stella . @stella
Follow
343 views
Uploaded On 2021-09-26

Most FrequentPrincipalDiagnosesfor Inpatient Stays in US Hospitals 201 - PPT Presentation

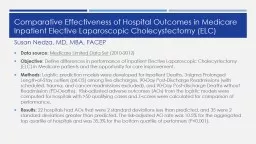
1 Agency for Healthcare Research and QualityHighlightsThe most frequent principal whereas cardiovascular and musculoskeletal diagnoses ranked among the topfive principal diagnoses for those aged 45 y ID: 885860

diagnoses stays principal 000 stays diagnoses 000 principal hospital cost 100 hcup healthcare mci x0000 percent health 600 years

Share:

Link:

Embed:

Download Presentation from below link

Download Pdf The PPT/PDF document "Most FrequentPrincipalDiagnosesfor Inpat..." is the property of its rightful owner. Permission is granted to download and print the materials on this web site for personal, non-commercial use only, and to display it on your personal computer provided you do not modify the materials and that you retain all copyright notices contained in the materials. By downloading content from our website, you accept the terms of this agreement.


Presentation Transcript

1 1 Most FrequentPrincipalDiagnosesfor I
1 Most FrequentPrincipalDiagnosesfor Inpatient Stays in U.S. Hospitals, 2018STATISTICAL BRIEF #277JulyKimberly W. McDermott, Ph.D.Marc Roemer, M.S.IntroductionIdentifying themost frequent Agency for Healthcare Research and Quality HighlightsThe most frequent principal whereas cardiovascular and musculoskeletal diagnoses ranked among the topfive principal diagnoses for those aged 45 years and older. HEALTHCARE COST AND UTILIZATION PROJECT ��2 &#x/MCI; 0 ;&#x/MCI; 0 ;FindingsMost frequent principal diagnosesamong nonmaternal, nonneonatal inpatient stays, 2018Figure 1 displays the aggregate cost of nonmaternal, nonneonatal inpatient stays for the 10 most frequent principal diagnoss in 2018, as indicated by the size of each circle. The mean cost per stay and total number of stays are shown on the yaxis and xaxis, respectively.stimates of costs and number of stays are also reported in Table 1.Figure 1. Aggregate cost of nonmaternal, nonneonatalhospitalinpatient stays, by mean cost andnumberof stays10 most frequent principal diagnoses, 2018Abbreviation: B, billion; COPD, chronic obstructive pulmonary disease; ICDCM, InternationalClassification of Diseases, Tenth Revision, Clinical ModificationNoteDiagnoses were identified using the Clinical Classifications Software Refined (CCSR) for ICDCM Diagnoses. The pneumonia diagnosis group excludes pneumonia caused by tuberculosis.Source: Agency for Healthcare Research and Quality (AHRQ), Healthcare Cost and Utilization Project (HCUP), NationInpatient Sample (NIS), 201Septicemia, the most common principal diagnosisamong nonmaternal, nonneonatal staysin 2018, accounted for $41.5 billion in aggregate costs.Of the 10 most common principal diagnosesamong nonmaternal, nonneonatal inpatient staysin 2018, septicemia was the most frequent and accounted for the highestaggregate costs ($41.5 billion)The mean cost perstaywasalsohigherfor septicemiathan for the other top 10 conditionwith the exception of acute myocardial infarctionAMI).Osteoarthritis was the second most costlyprincipal diagnosisamong the top 10diagnoses, with stays totaling $18.0 billion in aggregate costs.Of the 10 most frequent principal diagnoses, osteoarthritis rankedthird in terms of both number of stays(after septicemia and heart failure) andmean cost per stay afterAMI and septicemia).Two circulatory conditionsheart failure and AMIranked inthe top 10principal diagnoses in 2018 accounted for $14.5 and $14.7 billion in aggregate costs, respectively. Compared with stays for heart failure, stays for AMI were far less common but more expensive on average ��3 &#x/MCI; 0 ;&#

2 x/MCI; 0 ;Table 1 presents the 20 mo
x/MCI; 0 ;Table 1 presents the 20 most frequent principal diagnoses among nonmaternal, nonneonatal inpatient stays in 2018.Total number of stays, aggregate cost, and mean cost per stay are provided for each diagnosisTable 1. Top 20 principal iagnoses mong nonmaternal, nonneonatal inpatient tays, 2018RankPrincipal diagnosisNumber of staysPercent of stays Aggregate cost, $ billions Percent of ggregate cost Mean cost per stay, $ All nonmaternal/nonneonatal stays 27,833,500 100.0 403.6 100.0 14,500 Top 20 diagnoses 13,236,300 47.6 188.3 46.7 14,200 Septicemia 2,2100 8.041.510.3 18,700 2 Heart failure 1,135,900 4.1 14.5 3.6 12,800 Osteoarthritis 1,128,100 4.118.04.5 16,000 4 Pneumonia (except that caused by tuberculosis) 740,700 2.77.71.9 10,500 5 Diabetes mellitus with complication 678,600 2.47.91.9 11,600 Acute myocardial infarction 658,600 2.414.73.6 22,300 Cardiac dysrhythmias 620,000 2.27.51.9 12,100 COPDand bronchiectasis 569,600 2.05.31.3 9,200 9 Acute and unspecified renal failure 565,800 2.05.41.3 9,600 10 Cerebral infarction 533,400 1.9 7.9 2.0 14,900 11 Skin and subcutaneous tissue infections 529,600 1.94.01.0 7,600 Depressive disorders 525,000 1.92.80.7 5,400 13 Spondylopathies/ Spondyloarthropathy 519,600 1.912.53.1 24,000 14 Urinary tract infections 508,700 1.8 3.8 0.9 7,500 15 Respiratory failure; insufficiency; arrest 506,800 1.82.2 17,900 16 Schizophrenia spectrum and other psychotic disorders 399,900 1.43.70.9 9,300 17 Coronary atherosclerosis and other heart disease 358,900 1.38.72.2 24,400 Biliary tract disease 349,900 1.34.51.1 13,000 19 Fluid and electrolyte disorders 349,800 1.32.70.7 7,600 20 Complication of select surgical or medical care, injury, initial encounter * 338,800 1.26.01.5 17,700 Abbreviations:COPD, chronic obstructive pulmonary diseaseICDCM, International Classification of Diseases, TenthRevision, Clinical ModificationNotes:Diagnoses were identified using the Clinical Classifications Software Refined (CCSR) for ICDCM Diagnoses. Number of stays is rounded to the nearest hundred. Mean cost per stay is rounded to the nearest $100.This includes complications, such as infection, for surgical or medical care other than those from cardiovascular, genitourinary, or internal orthopedic devices or from organ/tissue transplants.Source: Agency for Healthcare Research and Quality (AHRQ), Healthcare Cost and Utilization Project (HCUP), National Inpatient Sample (NIS),

3 2018 ��4 &#x/MCI; 2
2018 ��4 &#x/MCI; 2 ;&#x/MCI; 2 ;■ The top 20 principal diagnoses constitutednearly half of allnonmaternalnonneonatalinpatient stays and nearly half of aggregate costs for these stays in 2018In 2018, there were 27,833,500 nonmaternal, nonneonatal hospital stays in the United States. The 20 most frequent principal diagnoses accounted for47.6 percent of these stays13,23,300stays) and 46.7 percent of aggregate costs for these stays ($188.3 billionepticemia accounted for 8 percentof all nonmaternalnonneonatal stays in 2018. Heart failure and osteoarthritis each accounted for 4 percent.Inpatient stays with a principal diagnosis of epticemiaaccounted for 8.0 percent f all nonmaternalnonneonatal stays2,21stays)3 percent of aggregate costs for these stays ($41.5billion). Fivecirculatoryconditions were among the 20 most common principal diagnoses in 2018: heart failure (1,135,900stays; $14.5 billion in aggregate costs)AMI658,600 stays; $14.7 billion), cardiac dysrhythmias (620,000 stays; $7.5 billion), cerebral infarction (533,400 stays; $7.9 billioncoronary atherosclerosis and other heart disease (358,900 stays; $8.7 billion). Combined, thesdiagnoses accounted for 1percent of staysand 13.2 percent of aggregate costsStays for two of these circulatory diagnosescoronary atherosclerosis and other heart diseaseand AMIwere relatively expensive compared withmost other top diagnoses, averaging more than $20,000per stay. Three respiratory diagnoseswere also among the top 20principal diagnoses: pneumonia (740,700 stays; $7.7 billion in aggregate costs), COPD and bronchiectasis (569,600 stays; $5.3 billion), and respiratory failure, insufficiency, or arrest (506,800 stays; $9.1 billion). Together, these diagnoses constituted 6.5 percent of staysand 5.5 percent of aggregate costs. The averagecost of stayfor respiratory failure, insufficiency, or arrestwas relatively high compared with stays for pneumonia and stays for COPD and bronchiectasis ($17,900 vs. $10,500 and $9,200, respectively).The two musculoskeletal diagnoses in the top 20rankingsosteoarthritis (1,128,100 stays; $18.0 billion in aggregate costs) and spondylopathies/spondyloarthropathy (519,600 stays; $12.5 billionmade up 5.9 percent of staysand7.6 percent of aggregate costs.Of these two principal diagnoses, osteoarthritis was far more commonaccounting for more than twice as many stays as spondylopathies/spondyloarthropathy. However, on average, stays for spondylopathies/spondyloarthropathywere more expensive than stays for osteoarthritis ($24,000 vs. $16,000 per stay) ��5 &#x/MCI; 0 ;&#x/MCI; 0 ;Figure 2 presents the distributio

4 n of nonmaternal, nonneonatalinpatient s
n of nonmaternal, nonneonatalinpatient stays for each of the 20 most common principal diagnosesby primary expected payerThedistribution by payer for all nonmaternal, nonneonatal stays is also presented for comparison.Figure 2. Top 20 principal diagnoses among nonmaternal, nonneonatal inpatient stays, by primary expected payer, 2018Abbreviations: COPD, chronic obstructive pulmonary diseaseICDCM, International Classification of Diseases, Tenth Revision, Clinical ModificationNoteDiagnoses were identified using the Clinical Classifications Software Refined (CCSR) for ICDCM Diagnoses.Primary xpected payer was missing for less than 0.3of stays.Complication of selectsurgical or medical care, injury, initial encounterThis includes complications, such as infection, for surgical or medical care other than those from cardiovascular, genitourinary, or internal orthopedic devices or from organ/tissue transplants. Selfpay/No charge: includes selpay, no charge, charity, and no expected payment. Source: Agency for Healthcare Research and Quality (AHRQ), Healthcare Cost and Utilization Project (HCUP), National InpatientSample (NIS), 2018 ��6 &#x/MCI; 2 ;&#x/MCI; 2 ;■ Medicare was the primary expected payer for nearly 60 percent ofinpatient staysinvolving themost frequentprincipal diagnoses.Medicare was the primary expected payer for the majority of nonmaternal, nonneonatal stays (52.1percentall stays and 57.7 percent of stays for the top 20 diagnoses combinedthe most common primary expected payerfor 18 of the top 20 principal diagnoses (all conditions except for depressive disorders and schizophrenia spectrum disorders). The percentage of stays for the 18 common principal diagnoses for which Medicare was the most frequent payer ranged from 40.2 percent for biliary tract disease to 73.5 percent for heart failure.wo mental disorder diagnosesdepressive disorders and schizophrenia spectrum disorderswere among the 20 most common diagnoses, and Medicaid was the primary expected payer for more than onethird of these stays.Among stays for schizophrenia spectrum and other psychotic disorders, Medicaid was the most common primary expected payer (41.9 percent of stays), followed by Medicare (36.3 percent) and private insurance (12.6 percent). Among stays for depressive disorders,Medicaid and private insurance each accounted for approximately onethird of stays (34.9 and 34.0 percent, respectivelywith Medicare accounting for 18.0 percent.Selfpay/no charge represented more than 7 percent of discharges for 4 of the top 20 diagnosesFor of the top 20 principal diagnoses, selfpay/no charge accounted formore than7 percent of stays:

5 skin and subcutaneous tissue infections
skin and subcutaneous tissue infections (7.9percent), depressive disorders (7.7percent), diabetes mellitus with complication (7.5percent), and biliary tract disease (7.1percent ��7 &#x/MCI; 0 ;&#x/MCI; 0 ;Most frequent principal diagnoses by patient and hospital characteristic, 2018Table presentsstatistics focusing on the five most frequent principal diagnosamongnonmaternal, nonneonatal staysin the United Statesby patient location(urbanicity)in 2018. Specifically, the rank of eachprincipal diagnosiswithin each of the four patient locations is provided, along with the umber of stays, rate per 100,000 populationmean length of stayand mean cost per stayTable requency and outcomes for the five most commonprincipal diagnosesamong nonmaternal, nonneonatalinpatient staysby patient location, Rank within United States Principal diagnosis, patient location Rank within location category Number of staysRate per 100,000 population Mean length of stay, days Mean cost per stay, $ 1 Septicemia Large central metropolitan 1 661, 0 00 653. 4 7.5 21,500 Large fringe metropolitan (suburbs) 1 502, 3 00 618. 3 7.1 18,500 Medium and small metropolitan 1 687, 7 00 701. 5 7.0 17,100 Micropolitan and noncore (rural) 1 354, 3 00 768. 4 6.6 16,600 2 Heart failure Large central metropolitan 2 326,000 322.3 5.6 14,400 Large fringe metropolitan (suburbs) 3 267,500 329.3 5.5 13,100 Medium and small metropolitan 3 341,500 348.3 5.3 11,800 Micropolitan and noncore (rural) 3 195,000 422.9 4.9 11,300 3 Osteoarthritis Large central metropolitan 3 262,200 259.2 2.1 16,300 Large fringe metropolitan (suburbs) 2 292,100 359.6 2.0 15,400 Medium and small metropolitan 2 363,900 371.2 2.0 15,300 Micropolitan and noncore (rural) 2 208,900 453.0 2.1 17,500 4 Pneumonia (except that caused by tuberculosis) Large central metropolitan 5 178,100 176.1 4.9 11,600 Large fringe metropolitan (suburbs) 4 168,400 207.3 4.8 10,600 Medium and small metropolitan 4 225,300 229.8 4.8 9,800 Micropolitan and noncore (rural) 4 166,600 361.2 4.4 9,900 5 Diabetes mellitus with complication Large central metropolitan 4 212,100 209.7 5.0 12,800 Large fringe metropolitan (suburbs) 7 148, 5 00 182.9 4.8 11,700 Medium and small metropolitan 5 205,400 209.5 4.8 10,700 Micropolitan and noncore (rural) 8 107,600 233.4 4.6 10,600 Abbreviations: ICDCM, International Classification of Diseases, Tenth Revisi

6 on, Clinical ModificationNotes:Diagnoses
on, Clinical ModificationNotes:Diagnoses were identified using the Clinical Classifications Software Refined (CCSR) for ICDCM Diagnoses. Number of stays is rounded to the nearest hundred. Mean cost per stay is rounded to the nearest $100.Source: Agency for Healthcare Research and Quality (AHRQ), Healthcare Cost and Utilization Project (HCUP), National Inpatient Sample (NIS), 2018For each of thefive most commonprincipaldiagnosesin the United Statesthe rate of stays was highest in rural areas. Rural areas had the highest rate of stays for septicemia, heart failure, osteoarthritis, pneumonia, and diabetes mellitus with complication. For three of thesediagnosesheart failure, osteoarthritis, and pneumoniathe rate of staysconsistentlyincreased with rurality.In the caseof pneumonia, the rate in rural areas was twice the rate in large central metropolitan areas (361.2 vs. 176.1 per 100,000 population). ��8 &#x/MCI; 2 ;&#x/MCI; 2 ;■ For four of the fivetop diagnosesmean length of stay andmean cost per stay were highest in large central metropolitan areas and generally decreased with rurality.Among stays for septicemia, heart failure, pneumonia, and diabetes mellitus with complication, mean length of stay and mean cost per stay generally decreased with rurality.For example, for septicemiathe mean length of stay and mean cost per staywere 7.5 days and $21,500 in large central metropolitan areas compared with 6.6 days and $16,600 in rural areas. Table presentsstatistics for the five most frequent principal diagnoses among nonmaternal, nonneonatal staysby hospital regionin 2018. Specifically, the rank of each principal diagnosis in the four regions is presented, along with the umber of stays, rate per 100,000 populationmean length of stayand mean cost per stay.Table 3. Regional variation in frequency and outcomes for the five most commonprincipaldiagnoses among nonmaternal, nonneonatal inpatient stays Rank within United States Principal diagnosishospital regionRankwithin regionNumber of staysRateper 100,000 populationMean length of stay, daysMean cost per stay, $ 1 Septicemia Northeast 1 364, 2 00 646. 5 7.7 20,000 Midwest 1 457, 8 00 67 1.9 6.6 1 7 , 0 00 South 1 867, 2 00 698. 1 7.3 16,200 West 1 529, 5 00 680. 3 6.8 23,400 2 Heart failure Northeast 3 211,100 374.8 5.9 14,100 Midwest 3 265,700 389.9 5.3 12, 3 00 South 2 465,100 374.4 5.4 11,100 West 3 194,000 249.3 5.0 16,000 3 Osteoarthritis Northeast 2 218,000 387.0 2.1 15,500 Midwest 2 292,600 429.4 2.0 15,700 South 3 3

7 91,600 315.2 2.2 14,900 West 2
91,600 315.2 2.2 14,900 West 2 225,900 290.2 1.9 18,600 4 Pneumonia (except that caused by tuberculosis) Northeast 4 130,000 230.8 4.9 11,100 Midwest 4 180,900 265.5 4.5 10, 1 00 South 4 310,800 250.2 4.8 9,400 West 6 119,100 153.0 4.5 13,200 5 Diabetes mellitus with complication Northeast 6 117,600 208.7 5.4 13,000 Midwest 8 141,700 208.0 4.5 10,900 South 5 294,300 236.9 4.9 10,200 West 5 125,000 160.6 4.5 14,100 Abbreviations: ICDCM, International Classification of Diseases, Tenth Revision, Clinical ModificationNotes:Diagnoses were identified using the Clinical Classifications Software Refined (CCSR) for ICDCM Diagnoses. Number of stays is rounded to the nearest hundred. Mean cost per stay is rounded to the nearest $100.Source: Agency for Healthcare Research and Quality (AHRQ), Healthcare Cost and Utilization Project (HCUP), National InpatientSample (NIS), 2018 ��9 &#x/MCI; 2 ;&#x/MCI; 2 ;■ Septicemia was the most commonprincipaldiagnosis overall in the United States as well as within each regionwith similar rateof stays across regions. The rate of septicemia stays was similar across regions, ranging from 646.5 per 100,000 population in the Northeast to 698.1 per 100,000 population in the South. However, the mean length of septicemia stays was higher in the Northeast (7.7 days) compared with the West and Midwest (6.8 and 6.6 days, respectively)he mean cost per septicemia stay was highein the West($23,400), followed by theNortheast $20,000), with the cost in both regions higher than the cost in the Midwest and South ($17,000 and $16,200, respectively).For three of the fivetop diagnosesthe rateof staywere lowest in the West compared with other regions.In 2018, the West had the lowest population rate of stays for heart failure, pneumonia, and diabetes mellitus with complication. For example, the rate of stays for heart failure was 249.3per 100,000 population in the West compared with 374390 per 100,00in other regions. In contrast, the West had the highest mean cost per stay for heart failure($16,000 in the West vs. $11,100$14,100 in other regions), osteoarthritis($18,600 vs. $14,900$15,700), and pneumonia($13,200 vs. $9,400$11,100). For diabetes mellitus with complication, the West and Northeast had higher mean costs than the Midwest and South ($14,100 and $13,000 vs. $10,900 and $10,200per stay, respectively). ��10 &#x/MCI; 0 ;&#x/MCI; 0 ;Most frequent principal diagnoses amongsexage group, 2018Table presentsfor each sexage groupthe fivemost frequent

8 principal diagnoses among nonmaternal, n
principal diagnoses among nonmaternal, nonneonatal inpatient stays in 2018.The number of stays and the rate per 100,000 population are presentedTable . Topfiveprincipal diagnoses among nonmaternal, nonneonatal inpatient stays by sexage group, 2018Rank Males Rank Females Principal diagnosisNumber of stays Rate per 100,000 population Principal diagnosisNumber of stays Rate per 100,000 population Ages 0 – 17 years 772,200 2,050.5 Ages 0 – 17 years 693,600 1,922.1 1 Acute bronchitis 58,300 154.7 1 Depressive disorders 63,800 176.7 2 Asthma 45,200 120.0 2 Acute bronchitis 40,800 113.1 3 Pneumonia 35,200 93.6 3 Pneumonia 30,600 84.8 4 Epilepsy; convulsions 34,000 90.2 4 Asthma 29,100 80.6 5 Depressive disorders 27,800 74.0 5 Epilepsy; convulsions 28,800 79.8 Ages 18 – 44 years 2,285,300 3,870.8 Ages 18 – 44 years 2,268,400 3,931.5 1 Schizophrenia spectrum, other psychotic disorders 148,300 251.2 Septicemia 2 Septicemia 142, 5 00 241. 3 2 Depressive disorders 128,400 222.5 Depressive disorders115,200 195.0 3 Diabetes mellitus with complication 87,300 4 Diabetes mellitus with complication 98,300 166.4 4 Bipolar and related disorders 81,900142.0 5 Alcohol - related disorders 90,500 153.2 5 Obesity 81,300 14 0 . 9 Ages 45 – 64 years 4,508,200 10,967.1 Ages 45 – 64 years 4,064,100 9,415.7 1 Septicemia 342, 4 00 83 2 . 9 1 Septicemia 310, 4 00 719. 0 2 Osteoarthritis 189,100 460.1 2 Osteoarthritis 233,900 542.0 Heart failure172,900 420.6 3 COPD and bronchiectasis 122,000282.7 4 Acute myocardial infarction 172,700 420.2 4 Spondylopathies/ spondyloarthropathy 112,200259.9 5 Diabetes mellitus with complication 158,400 385.4 Heart failure103,500239.7 Ages 65 – 74 years 2,873,400 20,074.1 Ages 65 – 74 years 2,857,100 17,546.0 1 Septicemia 258, 1 00 1,803. 1 1 Osteoarthritis 259,800 1,595.3 2 Osteoarthritis 172,500 1,205.0 2 Septicemia 234,000 1,43 6 . 8 3 Heart failure 140,400 980.9 3 Heart failure 113,600 697.7 4 Acute myocardial infarction 111,000 775.6 4 COPD and bronchiectasis 94,300579.1 5 Cardiac dysrhythmias 94,300 659.1 5 Cardiac dysrhythmias 76,900 472.3 Age 75+ years 3,233,700 37,421.6 Age 75+ years 4,273,700 34,090.0 1 Septicemia 348, 5 00 4,03 3 . 3 1 Septicemia 397, 5 00 3,171. 1 2 Heart failure 248,700 2,877.7 2 Heart failure 30

9 7,000 2,448.5 3 Pneumonia 128,00
7,000 2,448.5 3 Pneumonia 128,000 1,481.7 3 Urinary tract infections 173,000 1,379.8 4 Acute and unspecified renal failure 106,000 1,226.7 Osteoarthritis159,2001,270.0 5 Cardiac dysrhythmias 104,600 1,210.5 5 Pneumonia 159,000 1,268.3 Abbreviations: COPD, chronic obstructive pulmonary diseaseICDCM, International Classification of Diseases, Tenth Revision, Clinical ModificationNotes:Diagnoses were identified using the Clinical Classifications Software Refined (CCSR) for ICDCM Diagnoses. The pneumonia diagnosis group excludes pneumonia caused by tuberculosis. Number of stays is rounded to the nearest hundred.Source: Agency for Healthcare Research and Quality (AHRQ), Healthcare Cost and Utilization Project (HCUP), National Inpatient Sample (NIS), 2018 ��11 &#x/MCI; 2 ;&#x/MCI; 2 ;■ Septicemia was the first or second most common diagnoss among both males and females for each adult age group.Septicemia was a very common principal diagnosis for adult males and femalesregardless of ageHowever, the population rate of septicemia increased with age and was more than 10 times higher among those aged 75+ years than those aged 1844 years. The rate of septicemia was percent higher for females than males aged 1844 years, but the rate was higher for males than females in all older age groups: percent higher for ages 45years25 and 27 percent higher for ages 74 years and 75+ years, respectively. Septicemia was not among the most common diagnoses for children.In 2018, mental and/or substance use disorders were among the top five principal diagnoses for the youngest age groups, 017 and 1844 years.Although the ordervaried, the top five principal diagnoses were the same for both males and females aged 17 years and younger. Theseincluded three respiratory conditions (acute bronchitis, asthma, and pneumonia), epilepsy, and depressive disorders. Among this age grouptherate of stays fordepressive disorders was more than twice as high for females as for males.Depressive disorders were also among the most common diagnoses for individuals agedyearsSeveral other mental and/or substance use disordersalso ranked in the top five diagnoses for this age group: schizophrenia spectrumother psychotic disorders and alcoholrelated disorders for males bipolar and related disorders for females.For adults in the older age groups (4564, 6574, and 75+ years), cardiovascular and musculoskeletal diagnoses were among the topprincipal diagnoses by sexage group.Heart failure ranked in the top five diagnoses for both males and females in each of the older age groups: 4564, 6574, and 75+ years. The popula

10 tion rate of heart failure increased wit
tion rate of heart failure increased with age and was always higher for males than for females, but the difference between the sexes narrowed with increasing age, from 75 percent higher formales versusfemales aged 4564 years to 1percent higher formales versusfemales aged 75+ years.Osteoarthritis was anothercommon principal diagnosis among olderadults, occurring in the top five diagnoses for both males and females in each of the three older age groupswiththe exception of males aged 75+ yearsThe population rate of osteoarthritis was always higher for femalesthan for malespercent higher for females versus males aged years, 32 percent higher for females versus males aged years, and 1percent higher for females versus males aged 75+ years (rate not shown in table for males aged 75+ years). ��12 &#x/MCI; 0 ;&#x/MCI; 0 ;References1 Centers for Medicare & Medicare Services. The Hospital ValueBased Purchasing (VBP) Program. Updated February 18, 2021. www.cms.gov/Medicare/QualityInitiativesPatientAssessment Instruments/ValueBasedPrograms/HVBP/HospitaValueBasedPurchasing Accessed March 5, 202 About Statistical BriefsHealthcare Cost and Utilization Project (HCUPStatistical Briefs provide basic descriptive statistics on a variety of topics using HCUP administrative healthcare data.Topics include hospital inpatient, ambulatory surgery, and emergency department use and costs, quality of care, access to care, medical conditions, procedures, and patient populations, among other topics.The reports are intended to generate hypotheses that can be further explored in other research; the reports are not designed to answer indepth research questions using multivariate methods.Data SourceThe estimates in this Statistical Brief are based upon data from the HCUP2018 National Inpatient Sample (NIS). Supplemental sources included population denominator data for use with HCUP databasesderived from information available from Claritas, a vendor that produces population estimates and projections based on data from the U.S. Census Bureau.Definitions Diagnoses,ICD, Clinical Classifications Software Refined (CCSR) for ICDCM Diagnosesiagnosisrelated groups (DRGs)ajor diagnostic categories (MDCs)The principal diagnosisis that condition established after study to be chiefly responsible for the patient’s admission to the hospital. Secondary diagnosesare conditions that coexist at the time of admissionthat require or affect patient care treatment received or management,or that develop during the inpatient stay.Alllisted diagnosesinclude the principal diagnosis plus the secondary conditions. ICDCM is the International Classification o

11 f Diseases, Tenth Revision, Clinical Mod
f Diseases, Tenth Revision, Clinical Modification.There are over 70,000ICDCM diagnosis codes. The CCSR aggregates ICDCM diagnosis codes into a manageable number of clinically meaningful categories. b The CCSR is intended to be used analytically to examine patterns of healthcare in terms of cost, utilizationand outcomesrank utilization by diagnosesand riskadjust by clinical condition. The CCSR capitalizes on the specificity of the ICDCM coding scheme and allows ICDCM codes to be classified in more than one category. Approximately 10 percent of diagnosis codes are associated with more than one CCSR category because the diagnosis code documents either multiple conditions or a condition along with a common symptom or manifestation.For this Statistical Brief, the principal diagnosis code is assigned to a single default CCSR based on clinical coding guidelines, etiology and pathology of diseases, and standards set by other Federal agencies. The assignment of the default CCSR for the principal diagnosis is available starting with version v2020.2 of the software tool.ICDCM coding definitions for each CCSR category presented in this Statistical Brief can be found in the CCSR reference file, available at www.hcupus.ahrq.gov/toolssoftware/ccsr/ccs_refined.jsp#download . For this Statistical Brief, v20of the CCSR was used. DRGs comprise a patient classification system that categorizes patients into groups that are clinically coherent and homogeneous with respect to resource use. DRGs group patients according to diagnosis, type of treatment (procedure), age, and other relevant criteria. Each hospital stay has one assigned DRG. Claritas. Claritas Demographic Profile by ZIP Code. https://claritas360.claritas.com/mybestsegments/ . Accessed January 22, 2021. Agency for Healthcare Research and Quality. HCUP Clinical Classifications Software Refined (CCSR) for ICDCM Diagnoses. Healthcare Cost and Utilization Project (HCUP). Agency for Healthcare Research and Quality. Updated November 2020. https://hcupus.ahrq.gov/toolssoftware/ccsr/dxccsr.jsp AccessedJune22, 2021. ��13 &#x/MCI; 0 ;&#x/MCI; 0 ;MDCs assign ICDCM principal diagnosis codes to 1 of 25 general diagnosis categories. In this Statistical Brief, nonneonataland nonmaternal hospitalizations are identified using the MDCs that are not equal to 14 (Pregnancy, Childbirth and the Puerperium) or 15 (Newborns and Other Neonates with Conditions Originating in the Perinatal Period).Unit of analysisThe unit of analysis is the hospital discharge(i.e., the hospital stay), not a person or patient. This means that a person who

12 is admitted to the hospital multiple ti
is admitted to the hospital multiple times in year will be counted each time as a separate discharge from the hospital.Population ratesRates of stays per 100,000 population were calculated using2018hospital discharge totals in the numerator Claritasestimates of the corresponding U.S. population (e.g., the population for a specific sexage group) in the denominator. Individuahospitalized multiple times are counted more than once in the numerator. Population rate of stays = number of stays among indiiduals in groupnumber of residents in group x 100,000 Costs and chargesTotal hospital charges were converted to costs using HCUP CostCharge Ratios based on hospital accounting reports from the Centers for Medicare Medicaid Services (CMS).Costsreflect the actual expenses incurred in the production of hospital services, such as wages, supplies, and utility costschargesrepresent the amount a hospital billed for the case. For each hospital, a hospitalwide costcharge ratio is used. Hospital charges reflect the amount the hospital billed for the entire hospital stay and do not include professional (physician) fees. For the purposes of this Statistical Brief, missing charges were imputed as the mean charge for the DRGbefore converting charges to costs. Costs are reported to the nearest hundred.How HCUP estimates of costs differ from National Health Expenditure AccountsThere are a number of differences between the costs cited in this Statistical Brief and spending as measured in the National Health Expenditure Accounts (NHEA), which are produced annually by CMS.The largest source of difference comes from the HCUP coverage of inpatient treatment only in contrast to the NHEA inclusion of outpatient costs associated with emergency departments and other hospitalbased outpatient clinics and departments as well. The outpatient portion of hospitals’ activities has been growing steadily and may exceed half of all hospital revenue in recent years. On the basis of the American Hospital Association Annual Survey, 2018 outpatient gross revenues (or charges) were about 49 percent of total hospital gross revenues.Smaller sources of differences come from the inclusion in the NHEA of hospitals that are excluded from HCUP.These include Federal hospitals (Department of Defense, Veterans Administration, Indian Health Services, and Department of Justice [prison] hospitals) as well as psychiatric, substance abuse, and longterm care hospitals.A third source of difference lies in the HCUP reliance on billed charges from hospitals to payers, adjusted to provide estimates of costs using hospitalwide costcharge ratios, in contrast to the NHEA measurement

13 of spending or revenue.HCUP costs estim
of spending or revenue.HCUP costs estimate the amount of money required to produce hospital services, including expenses for wages, salaries, and benefits paid to staff as well as utilities, maintenance, and other similar expenses required to run a hospital.NHEA spending or revenue measures the amount of income received by the hospital for treatment and other services Claritas. Claritas Demographic Profile by ZIP Code. https://claritas360.claritas.com/mybestsegments/ . Accessed January 22, 2021. Agency for Healthcare Research and Quality. HCUP CostCharge Ratio (CCR) Files. Healthcare Cost and Utilization Project (HCUP). 20012017. Agency for Healthcare Research and Quality. Updated September 2020. www.hcup us.ahrq.gov/db/state/costtocharge.jsp . Accessed January 22, 2021. For additional information about the NHEA, see Centers for Medicare & Medicaid Services (CMS). National Health Expenditure Data. CMS website. Updated December 17, 2019. www.cms.gov/ResearchStatisticsDataSystems/StatisticsTrends Reports/NationalHealthExpendData/index.html?redirect=/NationalHealthExpendData/ . Accessed January 22, 2021. American Hospital Association. TrendWatch Chartbook, 2020. Table 4.2. Distribution of Inpatient vs. Outpatient Revenues, 19952018. www.aha.org/system/files/media/file/2020/10/TrendwatchChartbookAppendix.pdf . Accessed January 22, 2021. ��14 &#x/MCI; 0 ;&#x/MCI; 0 ;provided, including payments by insurers, patients, or government programs.The difference between revenues and costs includeprofit for forprofit hospitals or surpluses for nonprofit hospitals. Location of patientresidencePlace of residence is based on the urbanrural classification scheme for U.S. counties developed by the National Center for Health Statistics (NCHS)and based on the Office of Management and Budget (OMB) definition of a metropolitan service areaas including a city and a population of at least 50,000 residentsLarge Central Metropolitanounties in a metropolitan area with 1 million or more residentsthat satisfy at least one of the following criteria: 1) containing the entire population of the largest principal city of the metropolitan statistical area (MSA), 2) having their entire population contained within the largest principal city of the MSA, or 3) containing at least 250,000 residents of any principal city in the MSALarge Fringe MetropolitanCounties in ametropolitan area with 1 million or more residentsthat do not qualify as large central metropolitan countiesMediumand SmallMetropolitanCounties in metropolitanarea of 50,000999,999 residentsMicropolitanand oncoreCounties in a nonmetro

14 politan area of 10,00049,999residentsor
politan area of 10,00049,999residentsor onmetropolitan and nonmicropolitan areaExpected payerTo make coding uniform across all HCUP data sources, the primary expected payer for the hospital stay combines detailed categories into general groups: Medicareincludes feeforservice and managed care Medicare Medicaidincludes feeforservice and managed care Medicaid Private nsuranceincludes commercial nongovermental payers, regardless of the type of plan (e.g., private health maintenance organizations HMOspreferred provider organizations PPOsSelfpay/o chargeincludes selfpay, no charge, charity, and no expectedpaymentOtherpayersincludesother Federal and local government programs (e.g., TRICARE, CHAMPVA, Indian Health Service, Black Lung, Title V) andWorkersCompensationHospital stays that were expected to be billed to the State Children’s Health Insurance Program (SCHIP) are includd under Medicaid.For this Statistical Brief, when more than one payer is listed for a hospital discharge, the firstlisted payer is used. RegionRegion is one of the four regions defined by the U.S. Census Bureau: Northeast: Maine, New Hampshire, Vermont, Massachusetts, Rhode Island, Connecticut, New York, New Jersey, and PennsylvaniaMidwest: Ohio, Indiana, Illinois, Michigan, Wisconsin, Minnesota, Iowa, Missouri, North Dakota, South Dakota, Nebraska, and KansasSouth: Delaware, Maryland, Districtof Columbia, Virginia, West Virginia, North Carolina, South Carolina, Georgia, Florida, Kentucky, Tennessee, Alabama, Mississippi, Arkansas, Louisiana, Oklahoma, and TexasWest: Montana, Idaho, Wyoming, Colorado, New Mexico, Arizona, Utah, Nevada, Washington, Oregon, California, Alaska, and HawaiiAbout HCUPThe Healthcare Cost and Utilization Project (HCUP, pronounced "HCup") is a family of healthcare databases and related software tools and products developed through a FederalStateIndustry partnership and sponsored by the Agency for Healthcare Research and Quality (AHRQ). HCUP databases bring together the data collection efforts of State data organizations, hospital associations, and private data organizations(HCUP Partners)and the Federal government to create a national information ��15 &#x/MCI; 0 ;&#x/MCI; 0 ;resource of encountelevel healthcare data. HCUP includes the largest collection of longitudinal hospital care data in the United States, with allpayer, encounterlevel information beginning in 1988. These databases enable research on a broad range of health policy issues, including cost and quality of health services, medical practice patterns, access to healthcare programs, and outcomes of treatments at the national, State, and local

15 market levels.HCUP would not be possibl
market levels.HCUP would not be possible without the contributions of the following data collection Partners from across the United States: Alaska Department of Health and Social Services Alaska State Hospital and Nursing Home AssociationArizona Department of Health ServicesArkansasDepartment of HealthCalifornia Office of Statewide Health Planning and DevelopmentColorado Hospital AssociationConnecticut Hospital AssociationDelawareDivision of Public HealthDistrict of ColumbiaHospital AssociationFloridaAgency for Health Care AdministrationGeorgia Hospital AssociationHawaiiulima Data AllianceHawaii University of Hawai’i at HiloIllinoisDepartment of Public HealthIndiana Hospital AssociationIowaHospital AssociationKansasHospital AssociationKentucky Cabinet for Health and Family ServicesLouisiana Department of HealthMaineHealth Data OrganizationMaryland Health Services Cost Review CommissionMassachusetts Center for Health Information and AnalysisMichiganHealth & Hospital AssociationMinnesotaHospital AssociationMississippiState Department of HealthMissouri Hospital Industry Data InstituteMontana Hospital AssociationNebraskaHospital Association Nevada Department of Health and Human Services New HampshireDepartment of Health & Human ServicesNew JerseyDepartment of Health New Mexico Department of HealthNew YorkState Department of HealthNorth CarolinaDepartment of Health and Human ServicesNorth Dakota (data provided by the Minnesota Hospital Association)OhioHospital AssociationOklahomaState Department of HealthOregonAssociation of Hospitals andHealth SystemsOregonOffice of Health AnalyticsPennsylvaniaHealth Care Cost Containment CouncilRhode IslandDepartment of HealthSouth CarolinaRevenue and Fiscal Affairs OfficeSouth DakotaAssociation of Healthcare OrganizationsTennessee Hospital AssociationTexas Department of State Health ServicesUtah Department of HealthVermontAssociation of Hospitals and Health SystemsVirginia Health InformationWashingtonState Department of HealthWest VirginiaDepartment of Health and Human Resources, West Virginia Health Care AuthorityWisconsinDepartment of Health Services Wyoming Hospital Association About the NISThe HCUP National (NationwideInpatient Sample (NIS) is a nationwide database of hospital inpatient stays.The NIS is nationally representative of all community hospitals (i.e., shortterm, nonFederal, nonrehabilitation hospitals). The NIS includes allpayerIt is drawn from a sampling frame that contains hospitals comprising more than 95percent of all discharges in the United States. The vast size of the NIS allows the study of topics at the national and regional levels for specific subgroups

16 of patients.In addition, NIS data are s
of patients.In addition, NIS data are standardized across years to facilitate ease of use.ver time, the sampling frame forthe NIS has changedthusthe number oftates contributing to the NIS varies from year to year. The NIS is intended for national estimates only; no tatelevel estimates can be produced.The unweighted sample size for the 2018 NIS is 7,105,498(weighted, this represents 35,527,481inpatient stays). ��16 &#x/MCI; 0 ;&#x/MCI; 0 ;For More InformationFor other information onhospital inpatient stays, refer to the HCUP Statistical Briefs located at www.hcup us.ahrq.gov/reports/statbriefs/sb_hospoverview.jsp . For additional HCUP statistics, visitHCUP Fast Stats at www.hcupus.ahrq.gov/faststats/landing.jsp for easy access to the latest based statistics for healthcareinformation topics HCUPnet, HCUP’s interactive query system, atwww.hcupnet.ahrq.gov/ HCUP Summary Trend Tables at www.hcup us.ahrq.gov/reports/trendtables/summarytrendtables.jsp for monthly information on hospital utilization For more information about HCUP, visit www.hcupus.ahrq.gov/ . For a detailed description of HCUPandmore information on the design of theNational Inpatient Sample(NIS), please refer to the following database documentationAgency for Healthcare Research and Quality. Overview of the National (Nationwide) Inpatient Sample (NIS). Healthcare Cost and Utilization Project (HCUP). Rockville, MD: Agency for Healthcare Research and Quality. Updated December www.hcupus.ahrq.gov/nisoverview.jsp Accessed January 22, 2021. Suggested CitationMcDermott KW (IBM Watson Health), Roemer M (AHRQ). Most Frequent Principal Diagnoses for Inpatient Stays in U.S. Hospitals, 2018HCUP Statistical Brief #277uly 2021. Agency for Healthcare Research and Quality, Rockville, MD. https://www.hcupus.ahrq.gov/reports/statbriefs/sb277Top ReasonsHospitalStays2018.pdf . AcknowledgmentsThe authors would like to acknowledge the contributions ofNils Nordstrand of IBM Watson HealthAHRQ welcomes questions and comments from readers of this publication who are interested in obtaining more information about access, cost, use, financing, and quality of healthcare in the United States. We also invite you to tell us how you are using thisStatistical Brief and other HCUP data and tools, and to share suggestions on how HCUP products might be enhanced to further meet your needs. Please email us at hcup@ahrq.gov or send a letter to the address below: Joel W. Cohen, Ph, DirectorCenter for Financing, Access and Cost Trends Agency for Healthcare Research and Quality 5600 Fishers LaneRockville, MD 2085This Statistical Brief was posted online on July 13,