/
Comparative Effectiveness of Hospital Outcomes in Medicare Inpatient Elective Laparoscopic Comparative Effectiveness of Hospital Outcomes in Medicare Inpatient Elective Laparoscopic

Comparative Effectiveness of Hospital Outcomes in Medicare Inpatient Elective Laparoscopic - PowerPoint Presentation

scarlett
scarlett . @scarlett
Follow
342 views
Uploaded On 2022-06-08

Comparative Effectiveness of Hospital Outcomes in Medicare Inpatient Elective Laparoscopic - PPT Presentation

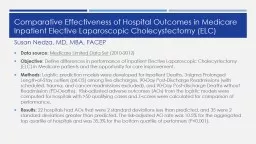
Data source Medicare Limited Data Set 20102012 Objective Define differences in performance of inpatient Elective Laparoscopic Cholecystectomy ELC in Medicare patients and the opportunity for care improvement ID: 915373

hospital inpatient medicare outcomes inpatient hospital outcomes medicare cholecystectomy deaths elective laparoscopic disorders elc comparative post adjusted discharge risk

Share:

Link:

Embed:

Download Presentation from below link

Download Presentation The PPT/PDF document "Comparative Effectiveness of Hospital Ou..." is the property of its rightful owner. Permission is granted to download and print the materials on this web site for personal, non-commercial use only, and to display it on your personal computer provided you do not modify the materials and that you retain all copyright notices contained in the materials. By downloading content from our website, you accept the terms of this agreement.


Presentation Transcript

Slide1

Comparative Effectiveness of Hospital Outcomes in Medicare Inpatient Elective Laparoscopic Cholecystectomy (ELC)

Data source: Medicare Limited Data Set (2010-2012)Objective: Define differences in performance of inpatient Elective Laparoscopic Cholecystectomy (ELC) in Medicare patients and the opportunity for care improvement.Methods: Logistic prediction models were developed for Inpatient Deaths, 3-sigma Prolonged Length-of-Stay outliers (prLOS) among live discharges, 90-Day Post-Discharge Readmissions (with scheduled, trauma, and cancer readmissions excluded), and 90-Day Post-discharge Deaths without Readmission (PD-Deaths). Risk-adjusted adverse outcomes (AOs) from the logistic models were computed for hospitals with >50 qualifying cases and Z-scores were calculated for comparison of performance. Results: 22 hospitals had AOs that were 2 standard deviations less than predicted, and 35 were 2 standard deviations greater than predicted. The risk-adjusted AO rate was 10.5% for the aggregated top quartile of hospitals and was 35.3% for the bottom quartile of performers (P<0.001).

Susan Nedza,

MD, MBA, FACEP

Slide2

Comparative Effectiveness of Hospital Outcomes in Medicare Inpatient Elective Laparoscopic Cholecystectomy (ELC)

Appendix I. ResultsResults for 635 Hospitals; 51,311 Patients *

Inpatient Deaths

281 (0.55%)

RApoLOS

Outliers

3,879 (7.6%)

Post-discharge Deaths without Readmission

694 (1.4%)

90-Day Post-Discharge Readmissions

7,372 (13.8%)

Post-discharge Deaths with Readmission

513 (1.0%)

Overall Adverse Outcomes

10,803 (21.1%

)

Overall 90-Day Death Rate

2,403 (2.9%)

Slide3

Comparative Effectiveness of Hospital Outcomes in Medicare Inpatient Elective Laparoscopic Cholecystectomy (ELC)

Appendix. MS-DRGs of 90-Day ReadmissionsMS-DRGsDescription of Grouping% of Readmissions

391-395

Gastrointestinal

and Digestive Disease Diagnoses and Disorders

10.3%

291-293

Heart Failure and Shock

5.4%

003-004; 166-168;186-192;

196-208

Non-infection Pulmonary Diagnosis

5.3%

870-872

Septicemia or Severe Sepsis

4.9%

177-179; 193-195

Pneumonia or Respiratory

Infection

4.3%

853-858; 862-864

Postoperative Infections

4.1%

438-440

Disorders

of the Pancreas; not Malignancy

3.6%

242-244;

308-310

Cardiac Arrhythmias and Conduction Disorders

3.3%

444-446

Disorders of the Biliary Tract

3.1%

689-690

Kidney and Urinary Tract Infections

2.9%

640-641

Disorders of Nutrition, Metabolism, and Fluids

2.8%

371-373

Major GI Disorders and Peritonitis

2.7%

377-379

GI Hemorrhage

2.6%

682-684

Renal Failure

2.6%

231-236; 246-251; 280-285

Myocardial Infarction,

Coronary Artery Intervention

2.4%

034-039; 061-069

Cerebrovascular Accident and Ischemia

2.4%

311-313

Cardiovascular Symptoms

2.0%

919-921

Complications of Treatment

1.3%

388-390

GI Obstruction

1.3%

176-177

Pulmonary

Embolism

1.2%

Slide4

Comparative Effectiveness of Hospital Outcomes in Medicare Inpatient Elective Laparoscopic Cholecystectomy (ELC)

Appendix III. Hospital Risk-Adjusted Adverse OutcomesHospital Risk-Adjusted AO by Quartile

Hospital Risk-Adjusted AO by

Decile

Slide5

Comparative Effectiveness of Hospital Outcomes in Medicare Inpatient Elective Laparoscopic Cholecystectomy (ELC)

Appendix IV. Z-scores for 635 HospitalsZ-scoresHospital Case Volume vs. Z-score