/
2Q 2021Mutual Funds  US Fixed Income  Taxable Bond 2Q 2021Mutual Funds  US Fixed Income  Taxable Bond

2Q 2021Mutual Funds US Fixed Income Taxable Bond - PDF document

susan2
susan2 . @susan2
Follow
343 views
Uploaded On 2021-08-25

2Q 2021Mutual Funds US Fixed Income Taxable Bond - PPT Presentation

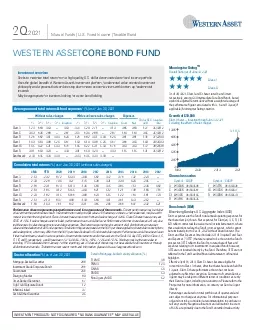
WESTERN ASSET CORE BOND FUNDInvestment overviewSeeks to maximize total return from a highquality US dollar denominated core xedincome portfolioUses the global breadth of Western Assets investment pl ID: 871093

fund class rating performance class fund performance rating year investment expenses funds shares 2021 bond total share sales jun

Share:

Link:

Embed:

Download Presentation from below link

Download Pdf The PPT/PDF document "2Q 2021Mutual Funds US Fixed Income Ta..." is the property of its rightful owner. Permission is granted to download and print the materials on this web site for personal, non-commercial use only, and to display it on your personal computer provided you do not modify the materials and that you retain all copyright notices contained in the materials. By downloading content from our website, you accept the terms of this agreement.


Presentation Transcript

1 2Q 2021Mutual Funds | U.S. Fixed Income
2Q 2021Mutual Funds | U.S. Fixed Income | Taxable Bond WESTERN ASSET CORE BOND FUND Investment overviewSeeks to maximize total return from a high-quality, U.S. dollar denominated core ®xed-income portfolioUses the global breadth of Western Asset's investment platform, fundamental value-oriented investment philosophy and a process that combines top down macro economic views with bottom up fundamental researchMay be appropriate for investors looking for a core bond holding Average annual total returns & fund expenses^ (%) as of Jun. 30¸ 2021 Without sales charges With maximum sales charges Expenses 1-Yr 3-Yr 5-Yr 10-Yr Inception 1-Yr 3-Yr 5-Yr 10-Yr Inception Gross Net 30-day SEC yield Inception date Class A 1.23 5.80 3.60 ± 3.60 -3.07 4.29 2.71 ± 3.10 0.84 0.83 1.27 04/30/12 Class C 0.60 5.06 2.88 ± 2.87 -0.37 5.06 2.88 ± 2.87 1.53 1.53 0.64 04/30/12 Class FI 1.25 5.82 3.61 3.93 5.26 1.25 5.82 3.61 3.93 5.26 0.81 0.81 1.35 07/22/99 Class I 1.60 6.19 3.98 4.26 6.57 1.60 6.19 3.98 4.26 6.57 0.55 0.46 1.69 09/04/90 Class IS 1.64 6.22 4.01 4.30 5.75 1.64 6.22 4.01 4.30 5.75 0.43 0.43 1.72 08/29/08 Class R 0.91 5.49 3.29 ± 3.30 0.91 5.49 3.29 ± 3.30 1.14 1.14 1.01 04/30/12 Benchmark -0.33 5.34 3.03 3.39 ± -0.33 5.34 3.03 3.39 ± Cumulative total returns (%) as of Jun. 30¸ 2021 (without sales charges) 3 Mo YTD 2020 2019 2018 2017 2016 2015 2014 2013 2012 Class A 2.10 -2.02 8.72 10.03 -0.99 4.82 3.72 0.75 7.02 -2.23 ± Class C 2.00 -2.28 7.96 9.27 -1.76 4.08 3.01 0.09 6.26 -2.94 ± Class FI 2.18 -2.01 8.73 10.13 -1.06 4.83 3.74 0.84 7.10 -2.06 6.82 Class I 2.19 -1.84 9.12 10.44 -0.63 5.21 4.12 1.21 7.38 -1.86 7.15 Class IS 2.20 -1.82 9.14 10.55 -0.68 5.23 4.14 1.22 7.53 -1.81 7.23 Class R 2.10 -2.10 8.37 9.68 -1.39 4.56 3.41 0.51 6.70 -2.42 ± Benchmark 1.83 -1.60 7.51 8.72 0.01 3.54 2.65 0.55 5.97 -2.02 4.21Performance shown represents past performance and is no guarantee of future results. Current performance may be higher or lower than the performance shown. Investment return and principal value will ¯uctuate, so shares, when redeemed, may be worth more or less than the original cost. Class A shares have a maximum front-end sales charge of 4.25%. Class C shares have a one-year CDSC of 1.0%. If sales charges were included, performance shown would be lower. Performance for other share classes will vary due to differences in sales charge structure and class expenses. Total returns assume the reinvestment of all distributions at net asset value and the deduction of all Fund expenses. Total return ®gures are based on the NAV per share applied to shareholder subscriptions and redemptions, which may differ from the NAV per share disclosed in Fund shareholder reports. Performance would have been lower if fees had not been waived in various periods. Absent reimbursements and/or fee waivers, the Fund's 30- day SEC yield for Class A, C, FI, I, IS and R, respectively, would have been 1.27%, 0.64%, 1.35%, 1.61%, 1.72% and 1.01%. Numbers may be the same due to rounding. YTD is calculated from January 1 of the reporting year. All classes of shares may not be available to all investors or through all distribution channels. To obtain the most recent month-end information, please visit www.leggmasonfunds.com. Sector allocation (%) as of Jun. 30¸ 2021 Mortgage-Backed Securities 28.8 Investment Grade Corporate Bonds 28.5 Government 26.5 Emerging Market 8.9 Asset-Backed Securities 5.7 High Yield Corporate Bonds 1.2 In¯ation-Linked 0.7 Cash & Other Securities -0.4Detail of mortgage-backed security allocation (%) FHLMC 3.8 FNMA 12.3 GNMA 4.6 CMBS 4.0 Non-Agency MBS 4.2 Morningstar RatingTMOverall Rating as of June 30, 2021Class IClass CAs of 06/30/21, Class I and C shares rated 5 and 3 stars, respectively, among 403 Intermediate Core Bond funds, based upon risk-adjusted returns derived from a weighted average of the performance ®gures associated with 3-, 5- and 10-year (if applicable) Morningstar Ratings metrics.²Growth of $10,000 Class I shares ± Inception through Jun. 30¸ 2021Excluding the effects of sales charges Share class codes Symbol CUSIP A WABAX 957663495 C WABCX 957663487 C1 LWACX 957663164 FI WAPIX 957663404 Symbol CUSIP I WATFX 957663305 IS WACSX 957663677 R WABRX 957663479Benchmark (BM)Bloomberg Barclays U.S. Aggregate Index (USD)^Gross expenses are the Fund's total annual operating expenses for the share class(es) shown. Net expenses for Class(es) A, C, FI, I, IS & R re¯ect contractual fee waivers and/or reimbursements, where these reductions reduce the Fund's gross expenses, which cannot be terminated prior to Dec 31, 2022 without Board consent. The Gross and Net Expenses listed include 0.01 of Acquired Fund Fees and Expenses (ªAFFEº) that are required to be shown in the Fund's prospectus. AFFE re¯ects the Fund's pro rata share of fees and expenses relating to its investments in acquired funds; however, AFFE are not incurred directly by the Fund. Therefore, AFFE are not re¯ected in the Fund's audited ®nancial statements or ®nancial highlights.Effective April 15, 2019, Class C shares became eligible for conversion to Class A shares, after the shares have been held for 10 years. Class C share performance shown has not been adjusted to re¯ect the conversion. Customers of certain Service Agents may be subject to different terms or conditions as set by their Service Agent, including non-conversion. Please refer to the Prospectus for more information, or contact your Service Agent directly.Percentages are based on total portfolio as of quarter-end and are subject to change at any time. For informational purposes only and not to be considered a recommendation to purchase or sell any security. Negative allocations and allocations in excess of 100% are primarily due to the Fund's unsettled trade activity. B efore investing , carefully consider a Fund’s investment objectives, risks, charges and expenses. You can nd this and other information in each prospectus, or summary prospectus , if available, which is available at www.leggmasonfunds.com. Please read it carefully. 2Q21 | Mutual Funds | U.S. Fixed Income | Taxable BondWESTERN ASSET CORE BOND FUND Credit quality allocation (%) as of Jun. 30¸ 2021 AAA 60.8 AA 7.4 A 13.6 BBB 14.5 Below BBB 1.3 Not Rated 2.4 Risk statistics as of Jun. 30¸ 2021Measures based on a trailing 10-year period. Class I shares Beta 1.02 R-squared 0.84 Sharpe ratio 1.09 Standard deviation(%) 3.34 Emerging Markets Debt (EMD) sectors (%)as of Jun. 30¸ 2021 Sovereign Debt External Currency 6.5 Corporates External Currency 2.4Where can I ®nd more information?You'll ®nd the most current performance data, commentary, prospectus and more information on each of our managers and products at www.leggmasonfunds.com.²The Morningstar Rating for funds, or ªstar ratingº, is as of June 30, 2021 and is calculated for managed products (including mutual funds, variable annuity and variable life subaccounts, exchange-traded funds, closed-end funds, and separate accounts) with at least a three-year history, and subject to change monthly. Current monthly ratings can be found at leggmason.com. Exchange-traded funds and open-ended mutual funds are considered a single population for comparative purposes. It is calculated based on a Morningstar Risk-Adjusted Retur

2 n measure that accounts for variation in
n measure that accounts for variation in a managed product's monthly excess performance, placing more emphasis on downward variations and rewarding consistent performance. The top 10% of products in each product category receive 5 stars, the next 22.5% receive 4 stars, the next 35% receive 3 stars, the next 22.5% receive 2 stars, and the bottom 10% receive 1 star. The Overall Morningstar Rating for a managed product is derived from a weighted average of the performance ®gures associated with its three-, ®ve-, and 10-year (if applicable) Morningstar Rating metrics. The weights are: 100% three-year rating for 36-59 months of total return, 60% ®ve-year rating/40% three-year rating for 60-119 months of total returns, and 50% 10-year rating/30% ®ve-year rating/20% three-year rating for 120 or more months of total return. While the 10-year overall star rating formula seems to give the most weight to the 10-year period, the most recent three-year period actually has the greatest impact because it is included in all three rating periods. Ratings do not take into account the effects of sales charges and loads. Class I and C shares of the Fund were rated against 403, 348, and 264 Intermediate Core Bond funds over the 3-, 5- and 10-year periods, respectively. With respect to these funds, Class I and C shares of the Fund received Morningstar Ratings of 4, 5, and 5; 2, 3, and n/a stars for the 3-, 5- and 10-year periods, respectively. Ratings shown are for the highest and lowest rated share classes only, when available. Morningstar Rating is for the speci®ed share class(es) only; other classes may have different performance characteristics. A 4- or 5-star rating does not necessarily imply that a fund achieved positive results for the period.Credit quality is a measure of a bond issuer's ability to repay interest and principal in a timely manner. The credit ratings shown are based on each portfolio security's rating as provided by Standard and Poor's, Moody's Investors Service and/or Fitch Ratings, Ltd. and typically range from AAA (highest) to D (lowest), or an equivalent and/or similar rating. For this purpose, if two or more of the agencies have assigned differing ratings to a security, the highest rating is used. Securities that are unrated by all three agencies are re¯ected as such. The credit quality of the investments in the Fund's portfolio does not apply to the stability or safety of the Fund. These ratings are updated monthly and may change over time. Please note, the Fund itself has not been rated by an independent rating agency.Beta measures the sensitivity of an investment to the movement of its benchmark. A beta higher than 1.0 indicates the investment has been more volatile than the benchmark and a beta of less than 1.0 indicates that the investment has been less volatile than the benchmark. R-squared measures the strength of the linear relationship between the Fund and its benchmark. R Squared at 1 implies perfect linear relationship and zero implies no relationship exists. Sharpe ratio refers to a risk-adjusted measure calculated using standard deviation and excess returns to determine reward per unit of risk. The higher the ratio, the greater the risk-adjusted performance. Standard deviation indicates the percentage by which a fund's performance has varied from its average performance in any given month during the period indicated. The higher the standard deviation, the greater the range of performance, indicating greater volatility. Turnover is a measure of the Fund's trading activity which represents the portion of the Fund's holdings that has changed over a year. There is no assurance that the Fund will maintain its current level of turnover.Effective Duration is a duration calculation for bonds with embedded options. Effective duration takes into account that expected cash ¯ows will ¯uctuate as interest rates change. Duration measures the sensitivity of price (the value of principal) of a ®xed-income investment to a change in interest rates. The higher the duration number, the more sensitive a ®xed-income investment will be to interest rate changes.The 30-day SEC yield, calculated pursuant to the standard SEC formula, is based on a Fund's investments over an annualized trailing 30-day period and not on the distributions paid by the Fund, which may differ.The Bloomberg Barclays U.S. Aggregate Bond Index is an unmanaged index that measures the performance of the investment-grade universe of bonds issued in the United States. The index includes institutionally traded U.S. Treasury, government sponsored, mortgage and corporate securities. Investors cannot invest directly in an index and unmanaged index returns do not re¯ect any fees, expenses or sales charges.2021 Franklin Distributors, LLC. Member FINRA/SIPC. Western Asset Management Company, LLC, and Franklin Distributors, LLC, are Franklin Templeton af®liated companies. 998952 WAS0002 07/21 90047 FF Fund facts as of Jun. 30¸ 2021 Dividend frequency¸ if any Daily, paid monthly Morningstar category Intermediate Core Bond Lipper category Core Bond Funds Turnover (®scal yr) 111% Statistics as of Jun. 30¸ 2021 Net assets $20.7B 30-day SEC yield ± Class I 1.69% Effective duration 7.1 yrs Weighted average life 12.6 yrs Portfolio managementWestern Asset Management is one of the world's leading ®xed-income managers. With a focus on long-term fundamental value investing that employs a top-down and bottom-up approach, the ®rm has nine of®ces around the globe and deep experience across the range of ®xed-income sectors. Founded in 1971, Western Asset has been recognized for an approach emphasizing team management and intensive proprietary research, supported by robust risk management.What should I know before investing?Fixed-income securities involve interest rate, credit, in¯ation, and reinvestment risks; and possible loss of principal. As interest rates rise, the value of ®xed-income securities falls. Derivatives, such as options and futures, can be illiquid, may disproportionately increase losses, and have a potentially large impact on Fund performance. International investments are subject to special risks, including currency ¯uctuations and social, economic and political uncertainties, which could increase volatility. These risks are magni®ed in emerging markets. Asset-backed, mortgage-backed or mortgage-related securities are subject to prepayment and extension risks. High yield bonds are subject to greater price volatility, illiquidity, and possibility of default. Active and frequent trading may increase a shareholder's tax liability and transaction costs, which could detract from fund performance. Any information, statement or opinion set forth herein is general in nature, is not directed to or based on the ®nancial situation or needs of any particular investor, and does not constitute, and should not be construed as, investment advice, forecast of future events, a guarantee of future results, or a recommendation with respect to any particular security or investment strategy or type of retirement account. Investors seeking ®nancial advice regarding the appropriateness of investing in any securities or investment strategies should consult their ®nancial professional. A general rise in interest rates may lead to increased portfolio volatility