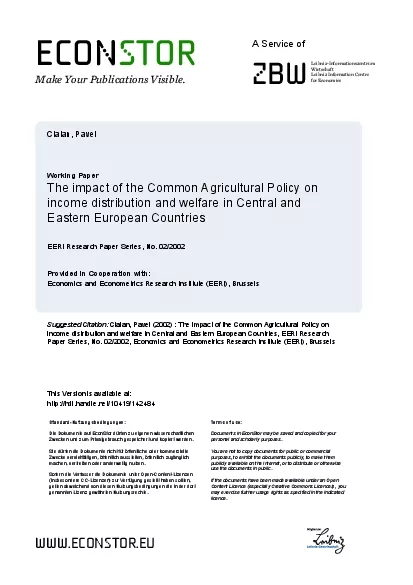
/
distribution and welfare in Central and Eastern European Countries Pav distribution and welfare in Central and Eastern European Countries Pav

distribution and welfare in Central and Eastern European Countries Pav - PDF document

susan2
susan2 . @susan2
Follow
342 views
Uploaded On 2021-08-09

distribution and welfare in Central and Eastern European Countries Pav - PPT Presentation

In this paper we develop a partial equilibrium model for agricultural sector to assess the impact of CEE integration with the EU on welfare and income distribution of agricultural factors The modellin ID: 860755

income agricultural land farmers agricultural income farmers land labour 100 price capital welfare farm czech direct total elasticity payments

Share:

Link:

Embed:

Download Presentation from below link

Download Pdf The PPT/PDF document "distribution and welfare in Central and ..." is the property of its rightful owner. Permission is granted to download and print the materials on this web site for personal, non-commercial use only, and to display it on your personal computer provided you do not modify the materials and that you retain all copyright notices contained in the materials. By downloading content from our website, you accept the terms of this agreement.


Presentation Transcript

1 distribution and welfare in Central and
distribution and welfare in Central and Eastern European Countries Pavel Ciaian EERI Economics and Econometrics Research Institute In this paper we develop a partial equilibrium model for agricultural sector to assess the impact of CEE integration with the EU on welfare and income distribution of agricultural factors. The modelling framework is based on the concept of market imperfections and transaction costs. We perform several policy simulations with different levels of direct payments as given in the most recent European Commission proposal. We find that even the most sceptical European Commission proposal of awarding the CEE farmers only 25% of the direct payments will increase welfare and income of farmers. However, the distribution of CAP rents are affected by the institutional structure. We find an adverse impact on allocation of incomes and welfare that are generated by the integration in Slovakia and in the Czech Republic. The major part of it - between 65% to 93% - is transferred to owners of production factors, such as hired labour, landowners and variable capital suppliers, but not as desired to support farmer incomes. In Poland the gains resulting from the integration are allocated more favourably to farmers. Factor owners retain only around 24% to 61%, depending on the level of direct payments. Key words: Partial equilibrium, model CAP, EU enlargement. 1.IEU integration of Central and Eastern European countries (CEECs) will significantly change, among others, their current agricultural policies. First, the level of support to agriculture will increase for the majority of CEECs, and secondly the composition of the policy instruments will be affected. One of the most hotly debated issues on enlargement is whether the CEECs should get access to ful

2 l CAP support, in particular the direct
l CAP support, in particular the direct payments. Yet, no matter what decision is taken, agricultural policy changes with accession are likely to change the income distribution and welfare in CEECs. There is a growing literature on the impact of EU enlargement of CEECs in agriculture. Recent studies asses the impact on EU budgetary expenditures, on CEECs' on commodity markets, trade and WTO and the macroeconomy (Munch (2000), Hertel et al. (1997)), Banse (2000)). However, the impact of accession on factor markets and on income distribution is less explored. This is surprising given the prominence of these arguments in the debate and whether or not CEEC farmers should get access to full CAP subsidies, including direct payments. The impact of the enlargement on the agricultural factors' incomes was in majority studies deduced based on the output developments. However, the distribution of income to the factors employed in agriculture, or the distribution of the farmers' income the other factors' income, is more complex and requires to incorporate a more detailed factor markets structure into the model. For instance, in an agricultural sector where the outsiders own the most of the agricultural land and also the majority of labour is hired, the increase of output does not necessary lead to a same increase of the farmers' income. Consequently, the share of farmers' income in the total agricultural income may be adversely affected. The land rents relative to the prices of the other factors may increase and the factors supplied by the farmers are usually less responsive to a price change compared to factors supplied by the outsiders; thus providing a change in farmers' income that differs from that of the output change. Further, the issue of imperfect factor markets,

3 extensively emphasised in the general l
extensively emphasised in the general literature and in the policy debate, is addressed by none of the above papers. Credit is usually not easily accessible to farmers - they are rationed - and concerning the agricultural land market is working imperfectly in CEECs, due to institutional constraints. This paper presents the first attempt (a) to asses income distribution effects within the CEECs economies of CAP accession, and (b) to analyse how factor market imperfection affect the outcome. For this we use an empirical model to evaluate the effect of introducing the Common Agricultural Policy (CAP) on the income distribution and welfare of the owners of agricultural production factors (land, labour and capital) in Poland, the Czech Republic and Slovakia after joining the EU. As a first approach, the model is partial equilibrium, single product and static. The model explicitly models transaction costs and credit rationing to integrate imperfections in land and credit markets. The three countries were chosen because they are expected to be among the first group that will join the EU and because they have very different farm structures, which allows to incorporate the impact of this variation in the analysis (see tables 1-3). Poland is representative for the countries where the farm sector is dominated by individual family farmers, such as Slovenia, Latvia, Lithuania and Romania. Slovakia represents the other extreme, where the farm sector is dominated by large corporate farms i.e. partially transformed collective and state farms. The Czech Republic is somewhere in between with a dualistic farm structure, where individual farms as well as large corporate farms are operating The paper is organised as follows. The next section gives a short description of the situat

4 ion of the agricultural sector in Poland
ion of the agricultural sector in Poland, the Czech Republic and Slovakia. The model section summarises. 2.AGRICULTURE IN OLAND THE ZECH EPUBLIC AND LOVAKIA The agricultural sector, as can be seen from table 4, is more important in the overall economy of Poland, the Czech Republic and Slovakia than it is in the EU. The share of agricultural production, the share of agricultural employment and the share of food consumption on the total economy are at higher levels for all three CEECs when compared to EU-15 average. The most substantial difference is in agricultural employment in Poland, where a significant portion of the Polish population derives its income from the agricultural sector. Its share of the total employment is about four times higher than the EU average, while for the Czech Republic and Slovakia, these values are higher just by a factor of less then two. The two other indicators - share of total agricultural production of the GDP and share of food consumption on total expenditure - do not differ by a such high margin, as in the case of Polish agricultural labour, but they are still higher by a factor ranging from 1.5 to 2.3 compared to EU average. In the development of agricultural production during the transition, two periods can Communism, around 1989-1994, when agricultural production had declined dramatically, reaching in 1993 only around 60% to 80% of the corresponding figure in 1989 (figure 1). This was mainly caused by deep structural changes that took place at that time, especially Macours and Swinnen (2000) found that almost half of the output decline can be attributed to price liberalisation and to subsidy cuts. Other important factors found to be relevant in explaining these output developments were transition uncertainty, drought, each

5 explaining around 10%, and privatisatio
explaining around 10%, and privatisation. The second period is after 1994, when production stabilisation to new relative prices and economic environment seems to have taken place. This stabilisation is relevant for selection of the base year for the model calibration. Otherwise, if too many disequilibria existed in those economies, then calibrated parameters may be misleading. Regarding the farm structure, all three countries differ substantially, both among themselves and with respect to EU-15 average as well. The Polish farm sector is fragmented into a large number of small family farms totalling around 2 million and averaging 7 hectares per farm (table 1). On the other hand, agriculture in Slovakia is dominated by large farms, predominately former co-operatives or joint stock and limited liability companies that have been created from the former state farms or have been transformed from the former co-operatives. Their average size is 1 225 ha for joint stock and limited liability and 1 537 ha for co-operatives (table 3). The farm structure in the Czech Republic is somewhere in between these two countries with a higher share of individual family farms then in Slovakia. Their share in the total agricultural area (TAA) is around 24%, while in Slovakia it is just around 9%, (tables 2 and 3). For comparison purposes, the average farm size in the EU is around 18.4 hectares, and the total number of farms is close to 7 million (European Commission). 3.THEORETICAL RAMEWORKTo analyse the impact of the implementation the CAP on welfare and incomes in Poland, the Czech Republic and Slovakia, we use a static and partial equilibrium model of the agricultural sector. Its results represent the long-run outcomes based on a comparison between an initial condition (i.e. wit

6 h current CEECs' policies) and a counter
h current CEECs' policies) and a counterfactual equilibrium computed with the changed policies, that is, with the integration of CEECs in the EU and consequent adoption of the CAP. The model is calibrated on the benchmark year 1999. Consequently some parameters are adjusted to fit the model with benchmark data. Elasticities are taken from the economic The model considers following market participants: one domestic consumer, foreign consumers, one farm, resource suppliers (agricultural factor input owners) and government, all assumed to behave competitively, exempt for the market imperfections in land and credit market, and government, which exogenously imposes its policies. There is assumed one product in the market, which is the monetary value of farm production (crop and livestock production). Credit rationing is assumed in the credit market and the concept of transaction costs is used to address the issue of land market imperfection. To a large extent, the structure of the model resembles the model of Hertel (1989), exempt for the market imperfections. He has developed a long-run partial equilibrium model with approximated functional relationships and linear in elasticities and percentage changes in quantities and prices. The structure of his model consists of an aggregate product demand, farm sector represented by a constant return to scale production function, and factor supply equations. The model was used to bring a general evaluation of the impact of different agricultural policy instruments on agricultural markets with special attention on the structure of the production technology and factor mobility. Also, he has applied the model for the US agriculture. The disadvantage of this approach is that the assumption of one product in the sector appears to

7 be restrictive by not being able to capt
be restrictive by not being able to capture the differential response of the different product categories to policy changes. Additionally, partial equilibrium model can not capture the changes of non-agricultural measures introduced in the other areas of the economy after The literature that has addressed the enlargement issue had used partial-equilibrium models (European Commission (2002), Kancs and Weber (2001), Munch (2000), and Anderson and Tyers (1993)), general equilibrium models (Hertel et.al. (1997), Banse (2000) and Liapis and Tsigas (1998), or a combination of partial and general-equilibrium models (Banse et.al. (2000)). the CEECs integration, which might affect the agricultural sector as well. Nevertheless, we think that the model is a good approximation to explain the development of incomes and welfare of the agricultural factors after the accession, which is the main intention of this paper. The truth is that some of the output categories may react in a very different manner when the agricultural policies are changed, but overall, the impact on the aggregated agricultural product should be the same for both considerations, for the single product model 3.1.DEMANDFollowing Armington (1969) we assume that the domestic consumer differentiates the good by its production location (domestic foreign). Consequently, the product purchased on the international market () is an imperfect substitute for the same product purchased from the domestic producer (). This consumer behaviour leads to the phenomenon where a country both imports and exports the same commodity. In addition, the advantage of this specification is that it does not lead to too excessive specialisation when assessing the change of trade policies. Demand is then determined in two steps. Firs

8 t, the equilibriumdemand of composite i
t, the equilibriumdemand of composite is determined assuming constant elasticity as follows: (1) is theprice index of the composite good and equals 1111))1(())1((dIIdddtPtP ; is a constant; , are share parameters; is an consumer tax refers to aggregate income; , are own-price and income equilibrium demand differs from the in the sense that the former allows for equilibrium adjustment in processing industry and final demand market as output price, changes; the latter one indicates how industry, , responds to alternative output prices given all prices in up-stream industries are held fixed. The consequence of this consideration is a price elasticity difference between these two specifications. It is lower for the equilibrium demand than for ordinary demand. This difference arisesbecause effects of price are alsoshifted to all up-stream industries,thus mitigating theeffect on . What concerns welfare measurement of a market intervention, the change of consumer surplus calculated from the equilibriumdemand, isin factthe change of surplus of all up-stream industries altogether (this holds under somerestrictions regarding final consumer, otherwise this surplus change is an approximation). elasticities of demand,respectively; is the elasticity of substitution between is the domestic price; and finally, is the import price, distorted proportionally In the second stage the consumer selects the optimal composition of and minimising expenditure on subject to the constraint explicit demand equations for may be derived as follows: dddddtPQX ; (2) dIIItPQX . (3) Foreign demand is distinguished for three regions, the EU, ; (4) are constants; is the own-price elasticity of foreign demand; price paid by foreign dem

9 ander and is equal to , if positive, the
ander and is equal to , if positive, then represents the unit subsidy to exporter (otherwise tax). The price, that the exporter (farmer) gets is higher than the price at what he is selling, is consumer tax (subsidy if negative); and , are import tariffs of the EU and CEEC, respectively. These tariffs will become zero under the EU integration scenario. 3.2.PRODUCTION The agricultural farm sector is represented by a single production unit (one farm) assumed to behave competitively. This farm produces agricultural product by using constant return to scale technology (CES): (5) with the constant elasticity of factor substitution given by )1(1ss is constant, , are distribution parameters (1 is output of the farm and supplied to the output market (domestic or international); and production factors, agricultural land (A), labour (L), variable capital (V) and investment capital (K), respectively, used to produce Concerning the credit market, several studies indicate that farmers in transition countries are credit constrained. Consequently, the model assumes credit rationing, in the sense of Stiglitz and Weiss (1981). We assume that supply, due to imperfect information the loan market, offer to farmers a fixed amount of credit, denoted by K , at a fixed price Given input prices, credit constraints and government policies, the farm operates so as to minimise costs of producing at a given output level. The first-order conditions of the farm problem yield factor demands which are as follows: HCQsrAsdadads211)1(; (6) CQsvVsdvdvds211)1(; KKd , refer to the prices per unit of agricultural land ( variable capital ( positive then it is input tax (otherwise it is input All rents that the farm obtains are distributed to input factors, such that the profi

10 ts of the farm are zero: refers to d
ts of the farm are zero: refers to direct output subsidy that the farm gets; is the price at which the producer sells the product to consumer; are subsidies given to the farm is the total benefit that the farmer is able to subtract from landowners rent as a result of imperfect agricultural land markets (explained in the next section (3.3)). The foreign supply of the agricultural product is considered to be perfectly elastic; available to the domestic consumer at an exogenously determined world price, 3.3.PRODUCTION FACTOR SUPPLY The agricultural production factors are aggregated in four main categories: agricultural land, labour, variable capital and investment capital. Each of them, except investment capital, is distinguished according to whether it is owned (or supplied) by the farm or not. Factor supply functions for land, labour and variable capital, similar to the equilibrium demand function, are assumed to have a constant elasticity form. The functions are separately given for factors supplied by the farmer and factors supplied by the outside suppliers who are not involved in farming. Superscript notations are, respectively, ; farmers own land supply non-farm(outside)land supply (9)(; non-farm (outside)labour supply (10) non-farm (outside)variable capital supply , are constants;, are quantities of factors, respectively, agricultural land, labour, variable capital and investment capital, supplied to the farm; , are prices received by the owners (suppliers) of factors agricultural land, labour variable capital and investment capital, respectively; , are own-price elasticities of supply for land, labour variable capital and investment capital, respectively; is labour supply elasticity with respect to opportunity wage, (for is the wage that

11 can be earned in other sectors of the ec
can be earned in other sectors of the economy (opportunity wage); and if positive then it is The modelling of the land market requires a more detailed explanation. The concept of transaction costs, equation 9, is used in order to incorporate land market imperfections into the model, denoted . These costs are faced by the landowners who are not farming their land themselves but instead rent it out to farms. They usually have less information on how the farm is run, about farm profitability, about the opportunities, they are bound by the rental contract and they usually have to face withdrawal costs and bargaining costs when they are interested to take out their land from the co-operative. Additional costs arise when the seem to be high, since the observed demand for land is low, especially in Slovakia and the Czech Republic where even a reference land price is not available to market participants. Fragmentation of land is an other impediment, which restricts the agricultural land marketIn Poland, where small family farmers use the majority of the land, this fact causes difficulties in negotiating the leasing or selling contracts. An owner, who intends to sell or rent his land out, consisting of more plots, incurs higher transaction costs compared to a situation when the plots are consolidated into one parcel. The reason is that the dispersion of the plots may not fit the existing land structure of a potential buyer/user, consequently, this prolongs the searching period and requires for the negotiations to take place with more interested parties. Also, the buyers/users usually prefer larger plots. On the other hand, in Slovakia and the Czech Republic where the majority of land is under the usage of co-operatives and commercial farms, the fragmentation of land ma

12 kes an owner more reluctant
kes an owner more reluctant In this paper we will refer to them as "landowners" As of 1 January 1998, there were 3 962 000 ownership papers, and the land is divided into 12 900 000 parcels in the Czech Republic, thus giving an average parcel of around 0.4 hectares. Concerning Polandaccording to a to withdraw his land out of the co-operative or the commercial farm. This is because the gains from doing this are low - especially because it is difficult to find someone who will rent it in, the rent is low and practically it is impossible to sell it, and thus small plots give practically zero returns - compared to costs which are relatively high - namely withdrawal costs, bargaining costs and search costs That is, as given in the equation 9, the price effectively received by the landowners is lower than the market price, , by the unobserved amount and equals to )costs, as already explained, arise because landowners may be less informed about changing contractual partner will incur costs related to changing a not terminated contract, search costs, withdrawal costs and bargaining costs. Someone, however, has to get the above costs or the lost revenues of the landowners that arises due to the imperfections in land market. The ones who are the beneficiaries of them are the farms and this revenue are assumed to affect their behaviour in a manner similar (equation 7). This shift of revenue from owner to farm occurs because the farm pays a lower price to the landowner than the equilibrium price by the amount of transaction . The landowner accepts this lower price because otherwise, in equilibrium, the increase in price that he would be able to negotiate when changing the contract or tenant would just compensate incurred

13 transaction costs. Consequently, the far
transaction costs. Consequently, the farm gains the price *) multiplied by the amount of land demanded () minus the costs incurred , which are assumed to be a fixed proportion of the total landowners' lost revenue, Hence, the portion of transaction costs incurred to landowners that remain with the farm is denoted by and total farm revenue equal to There are no reliable estimates of the size of the landowner's transaction costs, and of the farm benefits resulting from imperfect land market, . Therefore, we make some assumptions and the values for these parameters will be chosen the ones, which seem to be the most reasonable for each of the three considered countries. European Commission study, some 43% of farms are split into four or more plots, and on 45% of farms the furthest plot was more than 2 km away (European Commission, 1998, p. 51). For a discussion about agricultural land market in Poland and the Czech Republic, see Ciaian (2001). The costs that farm faces are related to search costs that may still arise when a farm leaves the sector or rents out some of his land. In addition farm (co-operatives) may incur bargaining costs that arise when the landowner is trying to withdraw his land from the co-operative. Equation 8 - the farm own land supply - includes also transaction costs in this case they reflect their effect on the rental income tax that farmer pays. The land rent that farmer earns from his own land supply is not fully observed in practice for different reasons such as not reporting own consumption. Thus the reference rent for income tax calculations is taken the one that farmer pays to landowners or the ma

14 rket rent lowered by the amount of trans
rket rent lowered by the amount of transaction costs, Concerning the credit market, credit rationing is assumed in the model. Several factors led us to consider this assumption. In general, the financial markets in transition countries are underdeveloped, which makes it difficult for the interested parties to obtain necessary credit to run a healthy business. This is particularly as a result of the financial under hard budget constrain), of the poor contract enforcement, of the lack of a skilled banking staff, of the poor developed accountancy and booking system and of the poor informational system in these countries (see Koester (2001) and Swinnen and Gow (1999)). Additionally, the specificity of the agricultural sector in general, such as the existence of many uncertainties faced by agricultural business (eg. weather conditions) and the sector's low profitability, as well as unfavourable input and output price developments in these countries, lead to a greater unwillingness of the financial sector to finance investment project to farmers compared to other sectors of the economy. The fragmented farm sector in small family farms, as it is in Poland, also contributes to lack of interest in the financial sector to provide credits to farmers in need. This is because usually small borrowers are more risky and also screening problem arises. In Slovakia and the Czech Republic this seems to be less problematic because most farms, co-operatives and commercial farms are large. However, due to the fact that the land market is not working properly, the farms cannot use land as collateral, which is important to decrease lenders' risk, and thus having an easier access to The simplest way to model credit constraint is by fixing capital supply. The lenders offer farmers a fix

15 ed amount of credit, denoted by K , at a
ed amount of credit, denoted by K , at a fixed price, k. Thus K is the maximum amount of credit available to agricultural sector, which binds the producer to expand investment capital stock. However, in the case of oversupply of credit, that is when the credit supply is not binding, the supply is assumed to have usual upward sloping shape represented in figure 2 by the curve 13 (12) A final remark regarding the agricultural input factors is related to their mobility to 9, 10, 11, 12 - reflects their imperfect mobility. For the agricultural land this rather straitforward: its supply is restricted and it cannot be used in other sectors of the economy therefore the land supply is highly inelastic at the aggregate level. Concerning the capital, its specificity makes it imperfect mobile between the other sectors. For the agricultural labour, low education level, agricultural specific skills, farmers' sunk investments and underdeveloped rural infrastructure in CEECs makes it less mobile (see Swinnen et al. economic condition in the country, hence the model considers a relatively high labour supply response to a change in agricultural wages but still being imperfectly mobile. 3.4.EQUILIBRIUM ONDITIONS(1) Price equilibrium (13) ; ; ; ; (2) Product market clearing (14) ; is total demand for domestically produced good. (15) (3) Factor market clearing (16) 3.5.AGRICULTURAL OLICIES PPLIED IN THE Besides agricultural policies, the model also includes general policies (VAT, income tax etc.) that are imposed on all economic agents in the considered countries. Thus the model ones. The simulated scenario or counterfactual equilibrium is calculated with changed agricultural policies only, as

16 they were in the EU in 1999. These inclu
they were in the EU in 1999. These include all agriculturalmeasures of the EU: market price support, direct payments, export subsidies, tariffs and other measures. The import tariffs and export subsidies were derived from the OECD data from the percentage market price support (%MPS) component of the producer support estimate. . (17) Thus the extent to which domestic price exceeds world price ( WdPP) is given by . This price ratio is exactly analogous to a nominal import tariff or export The acreage payments given under the CAP to farmers was modelled as a land subsidy given to farmers (). Its value was calculated as the average payment per hectare for 1999. Concerning headege payments, it was assumed that farmers will use this money to finance their investments. Usually the farmers own the livestock based on which the headege payments are granted and not the landowners that rent the land to the farmers; thus this money are expected to stay with the farmers. Consequently, based on this consideration, these payments will be used by the farmers to substitute the credit, which is not available due to the imperfect credit market, and they directly increase the stock of investment capital, which also includes livestock. 4.SELECTED IMULATION ESULTSA recent European Commission proposal set the strategy that will deal with the enlargement issue in agricultural area. A system of gradual increase of direct payments for CEECs was proposed starting immediately after the integration at a rate equivalent to 25% of the EU level and with a gradual increase afterwards such that, in 2013 the full level of direct payments is reached. In order to get an inside picture on how these different levels of direct payments affect incomes and welfare in integrated CEECs, simu

17 lations with five levels of direct payme
lations with five levels of direct payments were performed. These levels are as follows: 0%, 25%, 35%, 60% and ) and transaction costs incurred to farmers (1- ) specific values were chosen, as shown in table 5 that seemed to be the most reasonable for each of the three considered countries. The results of the above simulations provide an important argument in support of the proposal of the European Commission not giving full level of the direct payments to CEECs farmers. The actual purpose of the direct payments was to compensate farmers for the income deterioration after the decrease in market price support of agricultural products, which was the result of the CAP reform. Table 6 shows the change in incomes of the agricultural production factors with respect to base year income, with five levels of direct payments applied after the integration in Poland, the Czech Republic and Slovakia. Total agricultural incomes in all three countries increase substantially after the integration, even when the farmers get zero percent of the direct payments, thus giving no reason to compensate farmers' incomes in CEECs. Poland experiences the highest growth, while Slovleast growth in both income categories when comparison is made between countries. Differences in initial protection level applied in those countries and differences in composition of the initial agricultural support are main factors that explain these figures. Poland and the Czech Republic apply mostly market price support, which is highly market distortive, and their initial support level is lower than the one in Slovakia. On the other hand, market price support in Slovakia is less important in the overall agricultural support, while a substantial share have direct payments.

18 Total agricultural income
Total agricultural income is sum of the all production factors' incomes earned in the agricultural sector. It includes (1) farmers' income, (2) hired labour income, (3) landowners' rental income and (4) income of the outside suppliers of the variable capital (or outsiders' variable capital income). The farmers' income is further split in (1) labour income, (2) rental income, (3) variable capital income and As far as specific income categories are concerned the rental income experiences the highest change, when compared with the other income categories, by a factor between 0.1 and 8.7 (table 6). The explanation is rather straightforward. The area payments given to farmers under the CAP are directly transmitted into rental price change, since land supply is highly inelastic. Consequently, the changes in the level of direct payments granted to CEECs' farmers will be reflected in the change of land rent and thus in the change of the total rental income. When looking at the change of labour and variable capital income, a common feature arises in all three countries: the change is always lower for the income of farm-supplied labour and variable capital than for the income of labour and capital that is supplied by other suppliers. This is as a result of the assumption of smaller farmers' factor supply response to price change compared to the response of outsiders who react faster to price changes, reflected in lower own price elasticity for former input factors compared to latter input The budgetary consequences of these simulations are shown in table 7. Most striking is the case of no direct payments, which leads to a decrease in government expenditure for Slovakia because of complete reduction of direct payment; this is fairly important in the base

19 Table 8 shows the estimated income distr
Table 8 shows the estimated income distribution of factors employed in agriculture for Poland, the Czech Republic and Slovakia, respectively. Those values represent the share of specific factor income category earned in agricultural sector on the total income generated by this sector, with policies included. As a result of higher involvement of individual family farms in Poland than in Slovakia and in the Czech Republic and as a result of the differences in institutional structures of those countries, the income generated by the agricultural sector is distributed more favorably to farmers in Poland. Agricultural income in Poland is evenly allocated between farmers and other agricultural production factors (hired labour, landowners and outside variable capital suppliers) - 50%-50% - meanwhile in the Czech Republic and especially in Slovakia, only less than a quarter of income generated by the agricultural sector remains in the sector, 23.4% and 19.2%, respectively, for the base year. The largest share of the total agricultural income goes to variable capital suppliers' in all three countries - between 78% and 85% - for the base year 1999, whereas the smallest share goes to landowners - between 2.2% and 5.6%. Following from land ownership structure and agricultural labour composition, the share of labour income and the share of rental income is higher than the share of labour income and the share of landowners' rental income, After the integration farmers' income increases less for the majority of the simulations compared to increase in the total agricultural income (table 6). These developments lead to a deterioration in the share of farmers' income in the total agricultural income as shown in table 8 (A) Poland, (B) Czech Republic, (C) Slovakia. Due to insti

20 tutional differences, such as land marke
tutional differences, such as land market imperfections and ownership structures, only Poland, experiences a higher increase in farmers' income than the total agricultural income increases, in the case of full levels of direct payments, and thus producing a slight improvement in farmers' income share on the total agricultural income. The share improves from around 50% in 1999 to around 51% after the integration. Direct payments have a significant impact on land rent, as shown in table 9, which may the result of the modelling approach. The above mentioned European Commission proposal gives the option for CEECs to implement a simplified and de-coupled system of granting direct payments to farmers. An average area payment would be calculated for each country that would be applied to the whole agricultural area. This system is relatively highly transparent, and the information on the level of area payment applied in each country would be easily accessible to all landowners, farmers as well as landowners, eg. trough news media. Consequently, knowing the level of direct payment, landowners may be willing to rent their land only if they receive a portion of these payments. Following this reasoning, the treatment of direct payments as a direct farm land subsidy in the model seems appropriate. The simulated results show that the rents in comparison to base year 1999 have increased by a factor between -0.9 and 2 for the scenario zero percent of direct payment and by a factor between 2 and 8 for the scenario of full level of direct payments. However, the presence of , in the land market produces a situation in which landowners' get a lower price than the market price is. This is shown in table 9. This arises because the increase withdrawing his land from the co-operative

21 and again searching for a more efficient
and again searching for a more efficient user - will just compensate the transaction costs incurred. Consequently, it gives no incentive to landowners to take such actions, rather they continue to rent the land to the same users. The most affected is Slovakia where, for the low levels of direct payments granted to Slovak farmers, the landowner rent is lower than the one obtained in the base year 1999. Welfare effects of these simulations resemble the above income developments to a large extent. Table 10 shows the welfare before and after the integration for all three countries and for all five levels of direct payments. Both, the total welfare and the farmers' welfare increase even when farmers are granted zero percent of direct payments. Total welfare increases by 59% for Poland, by 45% for the Czech Republic and by 31% for Slovakia. For farmers' welfare, these changes are 53%, 28% and 11%, respectively. With the full level of direct payments, the welfare increases between 60% and 110%, the highest change being observed in Poland and the smallest in Slovakia. In fact, total gains in welfare that resulted from the integration are mostly channelled to non farm suppliers of production factors in Slovakia and in the Czech Republic, such as hired labour, landowners and outside suppliers of variable capital. Their gains are between 65% and 90% of the total integration welfare gains, depending on the level of direct payments. Contrary to Slovakia and the Czech Republic, in Poland the non-farm suppliers of production factors get only about 24% to 40% of the total welfare gains resulted from the integration. 5.CONCLUSIONS A partial equilibrium model for agricultural sector was developed to assess the impact of integrating Poland, the Czech Republic and Slovakia into t

22 he EU on welfare and income distribution
he EU on welfare and income distribution of agricultural factors in these three countries. The model uses the concept of transaction costs to approach the problem of imperfect land markets and concerning credit market, credit rationing is assumed. The modelling results represent the long run equilibrium situation of the agricultural sector that arises after the adoption of the Common Agricultural Policy (CAP) by these three countries. The model was calibrated for the base year 1999, which is also used for comparison purposes. Several simulations were performed in the paper with different levels of direct payments as given in the most recent European Commission Poland, with its large number of small family farmers, with high labour intensive agriculture and with relatively better performing agricultural land market, gains the most in terms of total value of subsidies and in terms of increase of agricultural income and welfare after the integration. Depending on the level of direct payment granted to CEECs' farmers, the CAP expenditure on Poland are between 2 and 5.2 billion Euro, total agricultural income billion Euro after the integration into the EU. When looking at specific factor categories, landowners experience the largest gains in welfare and rental income due to large increase of acreage payments. However, the share of overall farmers' income on the total agricultural income, which comprises all income sources that are earned by input factors supplied by the farm, is practically unaffected after the full adoption of the CAP, and it is negatively affected if Polish farmers would get only a small share of the direct payments applied in the EU. which has an agricultural sector dominated by large farms that mostly hire labour and rent land from landowners,

23 a rigid agricultural land market, and a
a rigid agricultural land market, and a higher initial protection level, gains the least in terms of increase in income, in subsidies and in welfare. Depending on the level of direct payment granted to CEECs' farmers, the CAP expenditure on Slovakia are between 0.12 and 0.55 billion Euro, total agricultural income increases by around 0.52 to 0.7 billion Euro and finally welfare increases by around 0.13 to 0.25 billion Euro after the integration into the EU. The rigid land market causes a substantial shift of rental income from landowners to farmers - mostly to co-operatives and commercial farms. For the low level of direct payment granted to CEECs' farmers the rent would not reach even the base year period level. The farmers' rental income increases the most among all income categories. However, its share in the total agricultural income remains at a very low level after the integration. This development can be attributed mostly to the presence of a large number of co-operatives and commercial farms, which distort agricultural land market. Contrary to farmers' rental income, the share of total farmers' income is adversely affected by the integration. It continues to decline from a already low value, less than half-quarter, Czech Republic is somewhere in between these two countries, in terms of gains due to integration, resembling most closely the Slovak case as a result of their similarity in institutional structure. This is obvious since both countries split from the same country, Czechoslovakia, in 1993. The most notable difference is in a higher presence of private family farms in the Czech Republic, which contributes to income distribution more favourable to farmers, but still being far different from the polish income distribution that represents the oth

24 er extreme. Depending on the level of di
er extreme. Depending on the level of direct payment granted to CEECs' farmers, the CAP expenditure on the Czech Republic are between 0.34 and 1.07 billion Euro, total agricultural income increases by around 1.2 to 1.4 billion Euro and finally welfare Even the most sceptical European Commission proposal to give CEEC's farmers only 25% of the direct payments will bring an increase in welfare and incomes to agricultural factors in all three countries. Thus, the fears that farmers would be worst off after the integration compared to the situation before the integration can be ruled out. However, another issue arises, namely that of the distribution of extra income and welfare generated by the integration of CEECs in the EU and consequent adoption of the CAP. Institutional structure that is in Slovakia but also in the Czech republic has an adverse impact on allocation of incomes and welfare that are generated by the integration. The major part of it - between 65% to 93% - is transferred to outside input factor suppliers, such as hired labour, landowners and outside variable capital suppliers and not as desired to support farmers' incomes. In Poland the gains resulting from the integration are allocated more favourably to farmers; outsiders retain only around 24% to 61%, depending on the level of direct payments. PPENDIX Regarding the choice of elasticities, the literature was consulted in search of plausible values for these parameters. There are few papers providing estimates for CEECs, especially at the aggregate level. Therefore, the model uses proxies for these parameters based on the estimates found in the literature for other countries. A survey of own-price demand elasticities, , and income elasticities, equation (1)) is given in table 19. The own price-

25 demand elasticity varies from a very low
demand elasticity varies from a very low value of -0.03 to a value of 1.49. The explanation for this relatively high variation is ambiguous. First of all, the estimated demand elasticity depends on functional form specification. On the other hand, it is generally accepted that the own price elasticity of food as a whole should decline in absolute value as income increases. This argument is supported by Finke et al.'s (1984) estimations of own-price elasticities for 30 countries. However, Pollak and Wales (1978) report the converse. These values increase (rather then decrease) with income. This paper follows the generally accepted argument, in choosing the own price elasticity of demand for CEECs. The specific value for each CEEC is taken the Finke's (1984) estimated elasticity of a country with similar income as considered CEEC. Thus, in general, a CEEC with a higher income has own-price elasticity lower than a CEEC with a lower income. Table 12 (first row) shows selected elasticities. Concerning the choice of income elasticities, similar arguments were considered as in this reasoning (Crombrugghe (1997), Flood el al. (1984)). For example, De Crombrugghe (1997) estimated the income elasticity for the Netherlands increased over time, from 0.34 in 1980 to 0.47 in 1988. This implies an increase of elasticity with income. However, the same paper also reports a decrease in the income elasticity over time for the United States (US), from 0.610 in 1941 to 0.551 in 1950 and 0.386 in 1972. Moving further to the own-price elasticity of foreign demand (equations 2), a short examination of the literature is summarised in table 13; table 12 (row three) shows the elasticies used for the modelling. change in the elasticity when trade protection of the country that buys th

26 e exported product increases. Therefore,
e exported product increases. Therefore, crucial for choosing a specific value for CEECs was the trade protection of major CEECs' trading partners. In 1999, around 62% of CEECs' exports had flown to EU and CEECs. Thus, upon integration the trade barriers will be lifted, making the demand more Finally, concerning the Armington assumption of product differentiation, the literature in most cases is supportive for this assumption. Most notably, Trefler (1995) finds that modelling an Armington home bias is statistically and economically significant in explaining trade flows between countries. This differential perception of actually physically identical goods may arise because of differences in convenience of purchase, availability in time, after-sales service bundled with the good, or even consumers' perceptions of inherent unobservable quality. The paper of Blonigen (1999) brings some evidence, among others, that trade barriers may increase home bias, thus lowering the Armington elasticity, theoretical study of Turrini (2001) argues that home bias arises due to higher legal cost when business is done abroad because of the differences in legal systems of trading countries, thus making it cheaper to buy from domestic producers. Further, he suggests that legal system harmonisation may increase cross-border trade. Upon EU integration of CEECs, their economies will form a common market with th will enter in force. Since in 1999 64% of imports to CEEC come from the EU and CEECs, the model considers a relatively high elasticity of substitution between home product and imported product. A short survey of the literature on Armington elasticity of substitution, is given in table 14, and table 12 (row 4) gives values applied in the The elasticity of substitution between inpu

27 ts, , is critical in assessing the impa
ts, , is critical in assessing the impact of EU integration on factors' income. A value of 1 leads to a Cobb-Douglas production function with the . The other interesting situation is when the elasticity is zero; in this case the . However, this does not imply that elasticity of substitution of zero is wrong, the question is rather what the true value of this parameter is. The argument is based on Engel's Law, stating that if income elasticity declines with income, then the income For the short-run modelling the elasticity may be considered close to zero because the factor composition, especially the stock or replacement of investment capital, is not expected modelling, however, all factors may change thus important is to know true value. Table 15 shows that the use of machinery and fertilisers in majority CEECs is much lower than in the EU (reverse is valid for labour). Therefore, if considering that CEECs and EU have similar technology, then adjustments in factor proportions need to take place when the relative prices will change due to the adoption of CAP. Consequently, this reasoning implies a relatively A survey of the literature on the estimated elasticity of substitution, using a classification of factors' aggregation similar to the one used in this paper, is provided in table 16. The median of the estimates ranges from 0.2 to 1.1. Table 12 (row 5) shows the values used in the model A.3. Production Factors'ElasticitiesThe following facts were assumed or taken in consideration when choosing the elasticities and other parameters for factor supply functions. Farm labour is more attached to agricultural sector than hired labour i

28 s. The paper of Dries and Swinnen (2000)
s. The paper of Dries and Swinnen (2000) shows a strong correlation between the regional outflow of labour from agriculture and the importance of state farms in Poland. The higher the presence of the state farms in a region was the higher outflow of labour from the agriculture was in that region. This implies a higher incentive of labour to stay in agriculture for the regions where the individual family farming is more important. Agricultural labour is less educated relative to labour employed in other sectors of the economy (table 17). Hence, agricultural labour's alternative job opportunities are restricted to sectors that require less education and less skills, considered in this model to be manufacturing or industrial sector. Consequently as proxy for the opportunity wage of agricultural labour is used average wage earned in the effect component of own-price elasticity decreases, thus leading to a smaller Technically, and for agronomic reasons, it is more costly for farmer to increase As a consequence of the above conclusions, the farm-owned factor supply elasticities are assumed to be lower than elasticities of purchased factor supply. A shows the elasticities used in the model. PPENDIX B:DThis appendix provides a short description of the parameters and the variables used in the Variable or Parameter name Proxy used Data Sources Aggregate income, GDP for 1999, in current prices -OECD: Main Economic Indicators: Non Member countries 2001; published by Statistics Directorate & CCNM, -OECD: Gross Domestic Product (GDP), from internet page of OECD -Documentation Tariffs and export subsidy,Calculated from PSE -OECD, Agricultural P

29 olicies in OECD countries -OECD, Agricul
olicies in OECD countries -OECD, Agricultural Policies in transition countries Monetary values of total exports -European Commission Consumer tax, Value added tax -Doing Business in Poland - OECD: The tax system in the Czech Republic, Economic Department working paper No. 245, 2000 -Low No 289/1995: Low on value added tax, Slovakia -European Commission: Economic accounts for agriculture kvla Calculated by using the F.O.Cs, factor's costs share and base year factor demands -European Commission: Economic accounts for agriculture -FAO internet data base -OECD: Quarterly labour force 2000 - Statistical yearbook of the republic of Poland, 2000 Quantity of agricultural land, Utilised agricultural area -FAO internet data base Quantity of own agric. land, -Expert opinion Quantities of agricultural labour, Total population economic -FAO internet data base -OECD: Quarterly labour force 2000 - Statistical yearbook of the republic of Poland, 2000 Quantity of own labour, - Statistical yearbook of the republic of Poland, 2000 - Zelena zprava, Czech ministry of agriculture - Zelena sprava, Slovak ministry of agriculture Opportunity wage, Average wage in industrial - Statistical yearbook of the Republic of Poland - Statistical yearbook of the Czech Republic - Statistical yearbook of Slovak Republic Quantity of variable capital, Total fertilisers - consumption -FAO internet data base Quantity of investment capital, Monetary value of investment -European Commission: Economic accounts for agriculture Land tax (subsidy if negative), Land tax and for integration scenario area payments as well - Doing Business in Poland - OECD: The tax system in the Czech Republic, Economic Department working paper No. 245, 2000 -Low No 317/1992: Low on property tax - Slovakia

30 -European Commission: DG agriculture
-European Commission: DG agriculture Variable capital tax (subsidy if Variable input subsidies -OECD, Agricultural Policies in OECD countries, 2000 -OECD, Agricultural Policies in transition countries, 2000 -Zelena zprava, Czech ministry of agriculture -Zelena sprava, Slovak ministry of agriculture -European Commission: DG agriculture Variable capital tax (subsidy if integration scenario headege -OECD, Agricultural Policies in OECD countries, 2000 -OECD, Agricultural Policies in transition countries, 2000 -Zelena zprava, Czech ministry of agriculture -Zelena sprava, Slovak ministry of agriculture -European Commission: DG agriculture Output subsidy, Subsidies based on output -OECD, Agricultural Policies in OECD countries, 2000 -OECD, Agricultural Policies in transition countries, 2000 -Zelena zprava, Czech ministry of agriculture -Zelena sprava, Slovak ministry of agriculture -European Commission: DG agriculture Subsidies that are not based on production level or the factor -OECD, Agricultural Policies in OECD countries, 2000 -OECD, Agricultural Policies in transition countries, 2000 -Zelena zprava, Czech ministry of agriculture -Zelena sprava, Slovak ministry of agriculture -European Commission: DG agriculture Input suppliers tax (subsidy if Personal income tax +social - Doing Business in Poland OECD: The tax system in the Czech Republic, -Economic Department working paper No. 245, 2000 -Low No 366/1999: Low on income tax - Slovakia EFERENCESAnderson, K. and Tyers, R. (1993), Implications of EU expansion for Europwelfare. CEPR Discussion Paper No. 829, Jun 1993. Centre for EconomiArmington, P. (1969), A theory of demand for products distinguished by place of production, IMF Staff PapersBaffes, J and Vasavada, U. (1989), On the choice of functiona

31 l forms in agricultural production analy
l forms in agricultural production analysis, Balcombe, K. and Prakash, A. (2000), Estimating the long-run supply and demand foour in the UK, European Review of Agricultural Economics, 27 (2) pp. 153-166 Banse, M. (2000) Macroeconomic implications of EU accession. In: S. Tangerman and M. Banse (eds.). ‘Central and Eastern European agriculture in an Expanding European Union’. CAB International. Banse, M., Munch, W. and Tangermann, S. (2000), Eastern enlargement of the European Union: A general and partial equilibrium analysis. Paper presented at XXI. International Conference of Agricultural Economists(IAAE) Berlin 2000. Binswanger, H.P. (1974), A cost function approach to the measurement of Elasticities of factor demand and elasticities of substitution, American Journal of Agricultural economicsBlonigen, B.A. and Wilson, W.W. (1999) Explaining Armington: what determines substitutability between home and foreign goods?, Canadian Journal of Economics (32) No. 1, 1-21 Bredahl, M.E., Meyers, WH and Collins, K (1979), The elasticity of foreign demand for US agricultural products: The importance of the price transmission elasticity, American Journal of Agricultural Economics,, (61) No. 1 58-63Ciaian, P. (2001), The institutional economics of land market in two former communist countries: the Czech Land Reform, FAO Rome, 2001/2 pp.74-85 Csaki, C. and Lerman, Z. (1997), Land reform and farm restructuring in East Central Europe and CIS in the 1990s: Expectations and achievements after the first five years, European Review of Agricultural Economics 24: (3-4) 428-452 Daviddi, R. and Ilzkovitz, F. (1997), The Eastern enlargement of the European Union: major challenges for macro-economic policies and Institutions of Central and East European countries, European Economic Revie

32 w41(3-5), April, 671-680. Davis, C.G. a
w41(3-5), April, 671-680. Davis, C.G. and Kruse, N.C. (1993), Consistent Estimation of Armington demand Models, 75 719-723 De Crombrugghe, D., Palm, F. C. and Urbain, JP. (1997), Statistical demand functions for food in the USA and the Netherlands, Journal of Applied EconometricsDries, L. and Swinnen, J.F.M. (2000), A regional perspective on labour adjustments in Polish agriculture: Causes and implications, working paper, European Commission, DG Economic and Financial Affairs.European Commission (1997b). Background report: The enlargement of the European Union, B/3/97European Commission. 1998. Agricultural Situation and Prospects in the Central and Eastern European Countries Poland, Working Document European Commission (DG VI), June 1998.European Commission (2002), Analysis of the Impact on Agricultural Markets and Incomes of EU Enlargement to the CEECs, Directorate General for Agriculture Finke. R, Lu. WH, and Theil. H, (1984), A cross-country tabulation of own price elasticities of demand, 14: (2-3) 137-142 1984Flood, L.R., Finke, R. and Theil, H., (1984) An evaluation of alternative demand systems by means of implied income elasticities, , (15) 21-27 Hartell, J. and Swinnen J.F.M. (2000) European integration and the political economy of Central and Eastern European agricultural price and trade policy. In: S. Tangerman and M. Banse (eds.). ‘Central and Eastern Union’. CAB International. Hertel, T.W., (1989), Negotiating reductions in agricultural support: Implications of technology and factor mobility, American Journal of Agricultural Economics 71: (3) 559-573 AUG 1989 Hertel, T.W., Brockmeier, M. and Swaminathan, P.V. (1997) Sectoral and economy-wide analysis of integrating Central and Eastern European countries into the EU: Implications of alternativ

33 e strategies, European Review of 24: (3
e strategies, European Review of 24: (3-4) 359-386 Jacoby, H.G. (1993), Shadow wages and Peasant family labour supply: An econometric application to the Peruvian Sierra, Review of Economic Studies, 60, pp. 903-921 Johnson, P.R., (1977), The elasticity of foreign demand for U.S. Agricultural Products, American Journal of , (59) No. 4 Kako, T. (1978), Decomposition analysis of derived demand for factor inputs: The case of rice production in Japan, American Journal of Agricultural Economics, 60 (4), 628-635 Kancs D., Weber, G (2001). Modelling Agricultural Policies in the CEE Accession Countries, EERI Research Paper 2001/02, Economics and Econometrics Research Institute. Koester, U. (2001), Agricultural finance and institutional reforms in transition economies: The 1990s and challenges ahead (focus on see region), Published in: Agricultural Finance and Credit Infrastructure in Transition Economies, Focus on South Eastern Europe, Proceedings of OECD Expert Meeting, Portoroz, Slovenia, May 2001. Liapis, P. and Tsigas, M. E. (1998), CEEC accession to the EU: A general equilibrium Analysis. In: Burfisher, M. and Jones, E. (eds.), Regional trade agreements and US agriculture. Agricultural economics report No. 771. ERS. Washington D.C. Lluch, C. and Powell, A.A. (1975), International comparisons of expenditure patterns, , 5 275-303 Lopez, R. (1984), Estimating labour supply and production decisions of self-employed farm producers,, European Economic Review, 24, pp 61-82 Macours K and Swinnen J.F.M. (2000), Causes of output decline in economic transition: The case of Central and Eastern European agriculture, Journal of Comparative Economics, 28: (1) 172-206 MAR 2000 Munch, W. (2000) Effects of CEEC-EU accession on agricultural markets in the CEEC and on government expe

34 nditure In: S. Tangerman and M. Banse (e
nditure In: S. Tangerman and M. Banse (eds.). ‘Central and Eastern European agriculture in an Expanding European Union’. CAB International. OECD (2000), Agricultural Policies in Emerging and Transition Economies. 2000 Piesse, J. and Thirtle, C. (2000), A Stochastic Frontier Approach to Firm Level Efficiency, Technological Change, and Productivity during the Early Transition in HungaryJournal of Comparative Economics, 28(3), September 2000, pages 473-501.Pollak, R. A. and Wales, T. J. (1978) Estimation of complete demand Systems from Household Budget data: The linear and Quadratic Expenditure systems, The American Economic Review, (68) No 3, 348-359 Ronald-Holst, D.W., Reinert, K.A. and Shiells, C.R. (1992) North American trade liberalisation and the role of nontariff barriers. In Economy-wide modelling of the Economic implications os a FTA with with Mexico and a NAFTA with Canada and Mexico (Washington, DC: U.S. International Trade Commission) Senhadji, A.S. and Montenegro, C.E. (1999), Time series Analysis of Demand Equations: A cross-country IMF Staff PapersSerova, E. (2000), Agriculture in transition, The common objectives and diversity of trajectories, Proceedings of the Mini-symposium on ‘Institution sequencing and timing in transition economies’. XXI. International Conference of Agricultural Economists (IAAE) Berlin 2000 pp. 103-116 Stern, R.M., Francis, Jonathan, F. and Schumacher, B. (1976), Price elasticites in international trade: An annotated bibliography, Macmillan press LTD Stiglitz, J.E. and Weiss, A.M. (1981), Credit rationing in markets with imperfect information, Economic Review, 71 pp 393-440 Swinnen, J.F.M. (1996), Endogenous price and trade policy developments in Central European agriculture, Review of Agricultural Economics; 23(2), pages

35 133-160. Swinnen, J.F.M. (1999), The Po
133-160. Swinnen, J.F.M. (1999), The Political Economy of Land Reform Choices in Central and Eastern Europe, Swinnen, J.F.M and Gow, H.R. (1999), Agricultural credit problems and policies during the transition to a market economy in Central and Eastern Europe, Food Policy 24 (1999) 21-47 Swinnen, J.F.M., Buckwell, A. and Mathijs E. (Editors) (1997). Agricultural privatisation, land reform and farm restructuring in Central and Eastern Europe; Publisher : Ashgate AldershotSwinnen, J.F.M., Dries, L. and K. Macours (2000), "Transition and Agricultural Labour", PRG working paper N° 16, Department of Agricultural and Environmental Economics, KULeuven Tangermann, S. and Josling, T.E. (1994). Pre-accession agricultural policies for Central Europe and the European Union. Study commissioned by DGI of the European Commission. Thijssen, G (1988), Estimating a labour supply function of farm households, European Review of agricultural , 15 pp 67-78 Tiffin. A and Tiffin. R, (1999), Estimates of food demand elasticities for Great Britain: 1972-1994 Journal of , 50: (1) 140-147 Jan 1999 Timmer, C. P. (1981), Is there 'curvature' in the Slutsky matrix?, Review of Economics and Statistics402 Trefler, D. (1995), The case of missing trade and other mysteries, , 85 1029-46. Turrini, A. and Van Ypersele, T. (2001), Traders, Courts, and the Home Bias Puzzle, Paper presented atTweeten, L. (1967), The demand for United States Farm Output, Food Res. Inst. Stud. 7 343-369 Van Driel, H., Nadall, V. and Zeelenberg, K. (1997), The demand for food in the united states and the Netherlands: a systems approach with the CBS model, Journal of Applied Econometrics, (12) 509-532 ABLES Evaluation of the structure of agricultural enterprises in Poland farms Farms share of TAA (in %) 76% 20% 4% Av

36 erage area (hectares) 6.3 2 924 311 Numb
erage area (hectares) 6.3 2 924 311 Number of farms 2 138 000 1 112 2 240 share of TAA (in %) 78% 18% 4% Average area (hectares) 6.3 1 786 310 Number of farms 2 144 000 1 752 2 186 share of TAA (in %) 82% 7% 3% Average area (hectares) 7 636 203 Number of farms 2 041 380 1 953 2 467 share of TAA (in %) 84% - - Average area (hectares) - - - Number of farms - - - Source: OECD, 1995b, PSI, 2000, PMAD, 2001. Note: TAA-Total agricultural area . Evaluation of the structure of agricultural enterprises in the Czech Republic 1989 share of TAA (in %) Average (hectares) share of TAA (in %) Average (hectares) share of TAA (in %) Average (hectares) share of TAA (in %) Average (hectares) Individual farms 0.4 3.3 23.2 23.5 61.4 2 561 61.1 2 191 47.7 1 430 32.2 1 394 Commercial farms 0.1 266 25.7 827 43.3 618 State farms 25.3 6 261 25.7 3 558 2.7 498 Other enterprises 12.9 9.8 0.7 267 1.0 Source: OECD (1995) and Zelena zprava (2000)-Czech ministry of agriculture Note: TAA-Total agricultural area This includes joint stock and limited liability companies . Evaluation of the structure of agricultural enterprises in Slovakia share of TAA (in %) Average area (hectares) share of TAA (in %) Average area (hectares) share of TAA (in %) Average area (hectares) Individual farms 7.88 11.4 9.02 10.4 53.8 1 583 50.24 1 537 Commercial farms 24.98 1 154 26.82 1 125 State farms 0.58 3 546 0.25 3 071 Other enterprises 12.76 13.67 Source: OECD (1995) and Zelena sprava (2000)- Slovak ministry of agriculture Note: TAA-Total agricultural area This includes joint stock and limited liability companies Table4. Basic data - key general and agricultural statistics for Poland

37 , the Czech Republic, GDP/ InhabitanSha
, the Czech Republic, GDP/ InhabitanShare of agric. in the GDP (GVA/GDP) Share of agric. employment in total employment Share of food consumption total consumer expenditure (%) Unemployment (1 000 ha) 7 806 3.3 18.1 36.9 15.3 18 413 Czech Republic 12 498 3.4 5.2 26.8 8.7 4 282 Slovakia 10 279 4.1 7.4 31.8 16.2 2 444 EU-15 20 610 1.8 4.5 15-18.9 9.2 135 825 Source: European CommissionGDP price deflatorThe value of the transactions costs incurred to landowners (tc) and incurred to the farmers (1- ) applied for the simulations that analyse the impact of the different level of direct payment on the agricultural income and welfare in Poland, the Czech Republic and Czech Republic Slovakia Farm transaction costs 1 Landowner transaction costs -tc Agricultural factors' (base year = 100) for simulation with different to CEECs farmers in: Integration, The share of direct payments given to CEECs farmers Index (base year = 100) Base year 1999 Farmers' income 100 Labour income 100 170 169 168 167 165 Rental income 100 232 301 329 398 509 Variable capital income 100 141 140 140 139 137 Investment capital income 100 100 109 112 121 135 Hired labour income 100 Landowners' rental income 100 Outsiders' variable capital income 100 Total agricultural income 100 B) The Czech Republic Integration, The share of direct payments given to CEECs farmers Index (base year = 100) Base year 1999 Farmers' income 100 Labour income 100 147 148 148 149 150 Rental income 100 282 356 539 833 Variable capital income 100 137 137 138 138 139 Investment capital income 100 100 115 121 137 171 Hired labour income 100 Landowners' rental income 100 Outsiders' variable capital inc

38 ome 100 Total agricultural income 100
ome 100 Total agricultural income 100 A) Slovakia Integration, The share of direct payments given to CEECs farmers Index (base year = 100) Base year 1999 Farmers' income 100 Labour income 100 146 147 148 149 151 Rental income 100 264 345 548 873 Variable capital income 100 129 130 130 131 132 Investment capital income 100 100 111 116 127 145 Hired labour income 100 Landowners' rental income 100 Outsiders' variable capital income 100 Total agricultural income 100 Total government's agricultural expenditure (in bn. Euro) Poland Czech Base year 1999 0.528 The share of direct payments given to farmers in CEECs 100% Agricultural factors' for simulation with different to CEECs farmers in: Integration, The share of direct payments given to CEECs farmers Income distribution (%) Base year 1999 Farmers' income 49.6 Labour income 8.1 8.6 8.3 8.3 8.0 7.7 Rental income 4.8 6.9 8.8 9.5 11.3 14.0 Variable capital income 28.6 25.2 24.6 24.3 23.7 22.8 Investment capital income 8.1 5.1 5.4 5.6 5.9 6.4 Hired labour income 0.5 Landowners rental income 0.8 Outsiders' variable capital income 49.2 Total agricultural income 100 B) The Czech Republic Integration, The share of direct payments given to CEECs farmers Income distribution (%) Base year 1999 Farmers' income 23.4 Labour income 1.1 1.1 1.1 1.1 1.1 1.0 Rental income 0.2 0.1 0.4 0.5 0.8 1.1 Variable capital income 18.4 16.2 16.0 15.9 15.7 15.3 Investment capital income 3.6 2.4 2.7 2.8 3.1 3.7 Hired labour income 7.7 Landowners' rental income 2.1 Outsiders' variable capital income 66.9 Total agricultural income 100 C) Slovakia Integratio

39 n, The share of direct payments given to
n, The share of direct payments given to CEECs farmers Income distribution (%) Base year 1999 Farmers' income 19.2 Labour income 0.7 0.7 0.7 0.7 0.7 0.7 Rental income 0.2 0.1 0.4 0.5 0.8 1.2 Variable capital income 9.1 8.3 8.1 8.1 7.9 7.7 Investment capital income 9.2 6.4 7.0 7.2 7.7 8.5 Hired labour income 7.1 Landowners' rental income 2.0 Outsiders' variable capital income 71.8 Total agricultural income 100 Average land rent per hectare (in Euro) Poland Czech Republic Slovakia Land rent that farmer gets Land rent paid to landowner Land rent that farmer gets Land rent paid to landowner Land rent that farmer gets Land rent paid to landowner Base year 1999 25.6 25% 35% 60% the share of direct payments given to farmers in CEECs 100% Agricultural factors' for simulation with different levels of direct given to CEECs farmers in: Integration, The share of direct payments given to CEECs farmers Index (base year = 100) Base year 1999 Farmers' welfare 100 Labour welfare 100 170 169 168 167 165 Rental welfare 100 232 301 329 398 509 Variable capital welfare 100 141 140 140 139 137 Investment capital welfare 100 100 112 117 129 149 Hired labour welfare 100 Landowners' rental welfare 100 Outsiders' variable capital welfare Total welfare 100 B) The Czech Republic Integration, The share of direct payments given to CEECs farmers Index (base year = 100) Base year 1999 Farmers' welfare 100 Labour welfare 100 147 148 148 149 150 Rental welfare 100 282 356 539 833 Variable capital welfare 100 137 137 138 138 139 Investment capital welfare 100 100 121 130 151 199 Hired labour welf

40 are 100 Landowners' rental welfare 100
are 100 Landowners' rental welfare 100 Outsiders' variable capital welfare Total welfare 100 C) Slovakia Integration, The share of direct payments given to CEECs farmers Index (base year = 100) Base year 1999 Farmers' welfare 100 Labour welfare 100 146 147 148 149 151 Rental welfare 100 264 345 548 873 Variable capital welfare 100 129 130 130 131 132 Investment capital welfare 100 100 116 122 138 163 Hired labour welfare 100 Landowners' rental welfare 100 Outsiders' variable capital welfare Total welfare 100 Literature survey: theown-price demand elasticity and the income elasticitye et. al (1997), Pollak and Own-price - -0.2, -0.45 - -0.42 to - 0.35, 0.65, 0.386 to 0.610 0.316 to 1.143 Number of countriesJapan and Sweden19 U.K. Parameters applied in the model Czech Republic Poland Slovakia Own-price demand elasticity, -0.18 -0.24 -0.3 Income elasticity, 0.42 0.46 0.48 Own-price elasticity of foreign demand, -3.2 -3.2 -3.2 Armington elasticity of substitution (domestic versus foreign product), 3.5 3.5 3.5 Elasticity of factor substitution, 0.80.80.8 Price elasticity of own labour supply, 0.8 0.8 0.8 Price elasticity of purchased labour supply, 1.3 1.3 1.3 Opportunity wage elasticity of own labour supply, -3 -3 -3 Opportunity wage elasticity of purchased labour supply, -3.7 -3.7 -3.7 Price elasticity of own variable capital supply, (10) 1.5 1.5 1.5 Price elasticity of purchased variable capital supply, (11) 3 3 3 Literature survey: the own-price elasticity of foreign demand (exports) (1967) Johnson (1977) Senhadji and Montenegro (1999) (1976) Price elasticity of -0.0 to -0.96 U.S. U.S. 53 countries 18 countries Literature survey: the Armington elasticity of substitution,

41 3.41 -0.96 to 3.52 0.02 to 1.22 Japan
3.41 -0.96 to 3.52 0.02 to 1.22 Japan U.S. U.S. industries/commodities industries 22 industries Estonia Czech HungaryLatviaLithuaniaPoland Slovenia SlovakiaEU Tot population Ec. 0.06 0.06 0.04 0.06 0.07 0.21 0.09 0.11 0.06 0.02 0.06 0.06 0.02 0.05 0.08 0.16 0.04 0.12 35 20 15 22 29 71 210 10 49 Source: FAO internet data-base; and OECD Quarterly labour force, 2000 .Piesse and Thirtle (2000)Baffes and Vasavada Elasticity of factor 0.011 to 0.098 -0.316 to 1.091-1.622 to 2.987 Hungary U.S. Japan U.S. Agricultural labour market indicators for Poland the Czech Republic and Slovakia Poland Czech Total employment in agriculture (1000) of which 3 944.6 247 Own Labour (%) 94.4% Hired labour (%) 5.6% Agricultural average monthly wage (in Euro) 368 Wage parity (agricultural wage/industrial wage) Elementary education 54.0% Vocational education 57.2% Complete secondary education University education 1.9% in rural areas 18.7% in non-farm areas 6.7% Gross agricultural value added agricultural worker (in Euro) 1 796 Source: Statistical Yearbooks of Poland, the Czech Republic and Slovakia; FAO, OECD, Zelena Sprava, WUZE, European Commission Lopez Price elasticity of own labour supply, 0.17 to 0.22 Price elasticity of purchased labour 0.02 to 0.82 labour supply, -0.107 Opportunity wage elasticity of p United Kingdom Peru 39 Investment capital supply Figure1Source: OECD (2000), 507510019891990199119921993199419951996199719981999 Slovak Republic Poland Czech Republic Index of agricultural production growth (1989 = 100) EERI Economics and Econometrics Research Institute EERI Research Paper Series No 2/2002 Copyright © 2002 by Pavel Ciaian The impact of the Common Agricultural Policy on Economics and Econometrics Research Insti