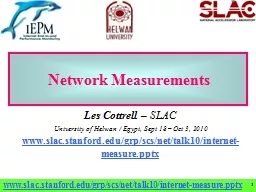
Les Cottrell SLAC University of Helwan Egypt Sept 18 Oct 3 2010 wwwslacstanfordedugrpscsnettalk10internetmeasurepptx 2 Overview Why is measurement important LAN vs ID: 560336
Download Presentation The PPT/PDF document "1 1 Network Measurements" is the property of its rightful owner. Permission is granted to download and print the materials on this web site for personal, non-commercial use only, and to display it on your personal computer provided you do not modify the materials and that you retain all copyright notices contained in the materials. By downloading content from our website, you accept the terms of this agreement.
Slide1
1
1
Network Measurements
Les Cottrell
– SLACUniversity of Helwan / Egypt, Sept 18 – Oct 3, 2010www.slac.stanford.edu/grp/scs/net/talk10/internet-measure.pptxSlide2
2
Overview
Why is measurement important?
LAN vs WAN PassiveSNMP, Netflow
Effects of measurement intervalActiveTools variousPing, tracerouteAvailable bandwidth, achievable bandwidth
PingERSlide3
3
Why is measurement important?
End users & network managers need to be able to identify & track problemsChoosing an ISP, setting a realistic service level agreement, and verifying it is being met
Choosing routes when more than one is availableSetting expectations:Deciding which links need upgradingDeciding where to place collaboration components such as a regional computing center, software development How well will an application work (e.g. VoIP)Slide4
4
LAN
vs WANMeasuring the LAN
Network admin has control so:Can read MIBs from devicesCan within limits passively sniff traffic Know the routes between devices
Manually for small networksAutomated for large networksMeasuring the WANNo admin control, unless you are an ISPCant read information out of routersMay not be able to sniff/trace traffic due to privacy/security concernsDon’t know route details between points, may change, not under your control, may be able to deduce some of it
So typically have to make do with what can be measured from end to end with very limited information from intermediates equipment hops.Slide5
5
Passive vs. Active Monitoring
Active injects traffic on demand, may be regular
Passive watches things as they happenNetwork device records informationPackets, bytes, errors … kept in MIBs retrieved by SNMP
Devices (e.g. probe) capture/watch packets as they passRouter, switch, sniffer, host in promiscuous (tcpdump)Complementary to one another:Passive: does not inject extra traffic, measures real traffic
Polling to gather data generates traffic, also gathers large amounts of dataActive:
provides explicit control on the generation of packets for measurement scenariostesting what you want, when you need it.
Injects extra artificial traffic
Can do both, e.g. start active measurement and look at passivelySlide6
6
Passive tools
SNMP
Hardware probes: e.g. Sniffer, can be stand-alone or remotely access from a central management station Software probes: snoop, WireShark, tcpdump, require promiscous access to NIC card, i.e. root/sudo accessFlow measurement: SFlow, OCxMon/CoralReef, Cisco/NetflowSlide7
7
SNMP (
Simple Network Management Protocol)
Example of a passive application, usually built on UDPDefacto standard for network managementCreated by IETF to address short term needs of TCP/IPConsists of:Management Information Bases (MIBs)
Store information about managed object (host, router, switch etc.) – system &status info, performance & configuration dataRemote Network Monitoring (RMON) is a management tool for passively watching line trafficSNMP communication protocol to read out data and set parametersPolling protocol, manager asks questions & agent respondsSlide8
8
SNMP Model
NMS contains manager software to send & receive SNMP messages to Agents
Agent is a software component residing on a managed node, responds to SNMP queries, performs updates & reports problems
MIB resides on nodes and at NMS and is a logical description of all network management data.
TCP/IP net
Agent
MIB
Agent
MIB
Agent
MIB
Agent
MIB
Agent
MIB
Agent
MIB
Network Management Station(NMS)Slide9
9
SNMP Examples
Using MRTG to display Router bits/s MIB variable
CERN
trans-AtlantictrafficSlide10
10
Averaging intervals
Typical measurements of utilization are made for 5 minute intervals or longer in order not to create much impact.
Interactive human interactions require second or sub-second responseSo it is interesting to see the difference between measurement made with different time frames.Slide11
11
Averages vs maxima
Maximum of all 5 sec samples can be factor of 2 or more greater than the average over 5 minutesSlide12
12
Utilization with different averaging times
Same data, measured Mbits/s every 5 secs
Average over different time intervalsDoes not get a lot smootherMay indicate multi-fractal behavior
5 secs
5 mins
1 hourSlide13
13
Example
: Passive site border monitoring
Use Cisco Netflow in Catalyst 6509 on SLAC borderGather about 200MBytes/day of flow dataThe raw data records include source and destination addresses and ports, the protocol, packet, octet and flow counts, and start and end times of the flowsMuch less detailed than saving headers of all packets, but good compromise
Top talkers history and daily (from & to), tlds, vlans, protocol and application utilizationUse for network & securitySlide14
14
E.g.
SLAC Traffic by collaboration site
BNL(LHC ATLAS)
IN2P3CNAF
MPI
Last 2 weeks in May 2009
1.0
0.0
1.0
Gbits/s
OUT
INSlide15
15
E.g. Top talkers by protocol
Hostname
MBytes/day (log scale)
100
1
10000
Volume dominated by single
Application - bbftpSlide16
16
Flow sizes
Heavy tailed, in ~ out, UDP flows shorter than TCP, packet~bytes
75% TCP-in < 5kBytes, 75% TCP-out < 1.5kBytes (<10pkts)UDP 80% < 600Bytes (75% < 3 pkts), ~10 * more TCP than UDPTop UDP = AFS (>55%), Real(~25%), SNMP(~1.4%)Just 2 parameters power law slope & intercept characterize traffic flows
SNMP
Real
A/V
AFS
file
serverSlide17
17
Flow lengths
60% of TCP flows less than 1 secondWould expect TCP streams longer lived
But 60% of UDP flows over 10 seconds, maybe due to heavy use of AFSSlide18
18
Some Active Measurement Tools
Ping connectivity, RTT, loss, jitter,
reachabilityflavors of ping, fpingbut blocking & rate limiting
Alternative tcp ping, but can look like DoS attackTracerouteHow it works, what it providesReverse traceroute
serversTraceroute archives
Combining ping & traceroute, traceping
,
pingroute
,
mtr
Pathchar
,
pchar
,
pipechar
,
bprobe
etc.
Iperf
,
netperf
,
ttcp
, FTP …Slide19
Ping from your own host to the world
www-iepm.slac.stanford.edu/tools/pingworld
Linux:Windows: Unless paranoid push Run on certificate warning
19Slide20
20
Traceroute technical details
Rough traceroute
algorithm ttl=1; #To 1st router port=33434; #Starting UDP port
while we haven’t got UDP port unreachable & ttl<max { send UDP packet to host:port with ttl get response
if time exceeded note roundtrip time else if UDP port unreachable
quit print output
ttl
++; port++
}
Can appear as a port scan
SLAC about about one complaint every 2 weeks for its
traceroute
server, then added warning, no complaints now.Slide21
21
Reverse traceroute servers
Reverse
traceroute server runs as CGI script in web serverAllow measurement of route from other end. Important for asymmetric routes. See e.g.www.slac.stanford.edu/comp/net/wan-mon/traceroute-srv.html
Also cities.lk.net/trlist.html#Lists Visual Traceroute server: visualroute.visualware.com/Map at www.caida.org/research/routing/reversetrace/
, however many hosts do not workSlide22
How is my host doing?
www.speedtest.net
,alsowww.bandwidth-test.netFor problem diagnosis also:netspeed.stanford.edu
Special TCP kernel on server, Java on clientUp & down link speeds + IDs: Duplex mismatch, excessive loss from faulty cables, checks for middle boxes, FWs; needs Java on clientAlso hints on setting TCP buffer sizes
22
SWMC
WifiSlide23
23
Path characterization
Pathchar
sends multiple packets of varying sizes to each router along routemeasures minimum response timeplot min RTT vs packet size to get bandwidthcalculate differences to get individual hop characteristics
measures for each hop: BW, queuing, delay/hopcan take a long timePipechar (many derivatives)Also sends back-to-back packets and measures separation on returnMuch fasterFinds bottleneck
Bottleneck
Min spacing
At bottleneck
Spacing preserved
On higher speed linksSlide24
24
Network throughput
Iperf (& thrulay, netperf, ttcp…)Client generates & sends UDP or TCP packets
Server receives receives packetsCan select port, maximum window size, port , duration, Mbytes to send etc.Client/server communicate packets seen etc.Reports on throughputRequires sever to be installed at remote site, i.e. friendly administrators or logon account and passwordSlide25
25
Iperf example
25cottrell@flora06:~>iperf -p 5008 -w 512K -P 3 -c sunstats.cern.ch
------------------------------------------------------------Client connecting to sunstats.cern.ch, TCP port 5008TCP window size: 512 KByte------------------------------------------------------------
[ 6] local 134.79.16.101 port 57582 connected with 192.65.185.20 port 5008[ 5] local 134.79.16.101 port 57581 connected with 192.65.185.20 port 5008[ 4] local 134.79.16.101 port 57580 connected with 192.65.185.20 port 5008[ ID] Interval Transfer Bandwidth[ 4] 0.0-10.3 sec 19.6 MBytes 15.3 Mbits/sec[ 5] 0.0-10.3 sec 19.6 MBytes 15.3 Mbits/sec[ 6] 0.0-10.3 sec 19.7 MBytes 15.3 Mbits/sec
Total throughput =3*15.3Mbits/s = 45.9Mbits/s
TCP port 5006
Max window size
3 parallel streams
Remote hostSlide26
26
PingER
Monitors >40 in 23
countriesPI 1 @ ICTP, 3 in Africa, Algeria, Burkina Faso, South Africa, (Zambia), Beacons ~ 90Remote sites (~740)
50 African Countries~ 99% of world’s population, >160 countries Measurements go back to Jan-95Reports on RTT, loss, reachability, jitter, reorders, duplicates …Uses ubiquitous “ping”Slide27
27
27
27
PingER
Methodology very Simple
Internet
10 ping request packets each 30 mins
Remote
Host
(typically
a server)
Monitoring
host
>
ping remhost
Ping response packets
Measure Round Trip Time & Loss
Data Repository @ SLAC
Once a Day
Uses ubiquitous pingSlide28
Measures and Derivations
RTT, minimum RTT, distance dependent,
Min RTT (no queuing), can detect satellites jitter (ipdv), usually caused by edges
Important for real-time predictabilityLoss – big impact, mainly edgesUnreachability (all 10 pings do NOT respond), Host moved, name changed, unstable power , unreliable networkTCP thruput
(kbps) ~ 1460*8(bits)/(RTT(ms)*sqrt(loss))MOS = function(loss, RTT, jitter) Important for VoIPSee:www-wanmon.slac.stanford.edu/
cgi-wrap/pingtable.pl
28Slide29
www-wanmon.slac.stanford.edu/
cgi-wrap/pingtable.pl
Choose metric, interval, size of ping, source destinationSource & destination can be aggregates (e.g. country/region)
Table colored to indicate qualityCan be sorted“.” Means no dataCan get to:
Display “smokeping” graphs with details for last 6 monthsPingER map, performance maps, matrix of monitor to monitored sites, motion bubble chart29Slide30
Example PingER Output ICTP>Kenya
Uses Smokeping
Blue median RTT, background color = lossSmokiness = jitter30
Median RTT drops 780ms to 225ms, i.e. cut by 2/3rds (3.5 times improvement)Slide31
Map of PingER sites
http://www.slac.stanford.edu/comp/net/wan-mon/viper/pinger-coverage-gmap.html
Choose type of host interested inZoom inClick on interesting hostGet name, lat/long etc.
31Slide32
Maps of performance
http://www-iepm.slac.stanford.edu/pinger/intensity-maps/pinger-metrics-intensity-map.html
Choose metricScroll down to various regions
32Slide33
Motion Bubble charts
http://www-iepm.slac.stanford.edu/pinger/pinger-metrics-motion-chart.html
Choose metric for x & y axis and size of bubbleRTT, min-RTT, jitter, throughput, loss, unreachabilityInternet penetration, internet users
Population, CPI, HDI, DOILog/Lin axesPlayback to 1998ID countries and trace their performance with timeRegions identified by colorsBar and line charts too, try min-RTT
33Slide34
34
More Information
Tutorial on monitoring (getting a bit dusty)
www.slac.stanford.edu/comp/net/wan-mon/tutorial.htmlRFC 2151 on Internet toolswww.freesoft.org/CIE/RFC/Orig/rfc2151.txt
Network monitoring toolswww.slac.stanford.edu/xorg/nmtf/nmtf-tools.htmlPinghttp://www.ping127001.com/pingpage.htmIEPM/PingER home site
www-iepm.slac.stanford.edu/pingerIEEE Communications, May 2000, Vol 38, No 5, pp 130-136Slide35
More Slides
35Slide36
How to Diagnose with Ping
to localhost (127.0.0.1),
ping to gateway (use route or
traceroute (tracert on Windows) to find gateway), ping to well known host & to relevant remote host
Use IP address to avoid nameserver problemsLook for connectivity, loss, RTT, jitter, dupsMay need to run for a long time to see some pathologies (e.g. bursty loss due to DSL loss of sync)Try flood pings if suspect rate limitedUse telnet- see if blocked; synack if ICMP blockedwww-iepm.slac.stanford.edu/tools/synack/
36Slide37
Main Ping Unreachable Messages
ICMPCode
Value
Message SubtypeDescription0/1Network/host Unreachable
The datagram could not be delivered to the network specified in the network ID portion of the IP address/specific host. Usually means a problem with routing but could also be caused by a bad address.7Destination Host UnknownThe host specified is not known. This is usually generated by a router local to the destination host and usually means a bad address.
9/10Communication with Destination Network/Host
is Administratively ProhibitedThe source device is not allowed to send to the network where the destination device is located/is allowed to send to the network where the destination device is located, but not that particular device.
13
Communication Administratively Prohibited
The datagram could not be forwarded due to filtering that blocks the message based on its contents.
37
Not ICMP but DNS not resolving name gives
Unknown Host Slide38
IP Addresses pingable June 2003
38
Grey= not allocated
Black= not pingableCompanies own class ASlide39
Growth 2003-2006
39
June 2003
Nov 2006
More areas allocated,
Existing areas more colorfulSlide40
40
Lot of heavy FTP activity
The difference depends on trafficOnly 20% difference in max & averageSlide41
41
Flow lengths
Distribution of netflow lengths for SLAC border
Log-log plots, linear trendline = power lawNetflow ties off flows after 30 minutesTCP, UDP & ICMP “flows” are ~log-log linear for longer (hundreds to 1500 seconds) flows (heavy-tails)There are some peaks in TCP distributions, timeouts?
Web server CGI script timeouts (300s), TCP connection establishment (default 75s), TIME_WAIT (default 240s), tcp_fin_wait (default 675s)
TCP
UDP
ICMPSlide42
42
Ping
ICMP client/server application built on IPClient send ICMP echo request, server sends reply
Server usually in kernel, so reliable & fastUser can specify number of data bytes. Client puts timestamp in data bytes. Compares timestamp with time when echo comes back to get RTTMany flavors (e.g. fping) and optionspacket length, number of tries, timeout, separation …
Ping localhost (127.0.0.1) first, then gateway IP address etc.
Type=8
Code
Checksum
0
8
16
31
Identifier
Sequence number
Optional data
24