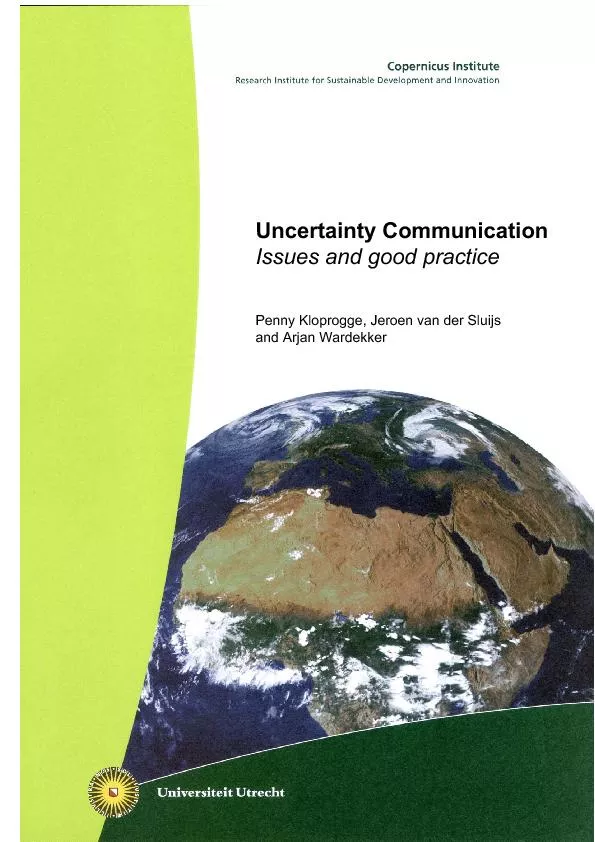
/
Copernicus Institute for Sustainable Development and Innovation Assess Copernicus Institute for Sustainable Development and Innovation Assess

Copernicus Institute for Sustainable Development and Innovation Assess - PDF document

tatiana-dople
tatiana-dople . @tatiana-dople
Follow
413 views
Uploaded On 2016-08-17

Copernicus Institute for Sustainable Development and Innovation Assess - PPT Presentation

Introduction Part I Background information on communicating uncertainty 1 Reporting uncertainty in a gradual and custommade form 6 2 The reader ID: 450657

Introduction

Share:

Link:

Embed:

Download Presentation from below link

Download Pdf The PPT/PDF document "Copernicus Institute for Sustainable Dev..." is the property of its rightful owner. Permission is granted to download and print the materials on this web site for personal, non-commercial use only, and to display it on your personal computer provided you do not modify the materials and that you retain all copyright notices contained in the materials. By downloading content from our website, you accept the terms of this agreement.


Presentation Transcript

Copernicus Institute for Sustainable Development and Innovation Assessment and Communication (www.mnp.nl/guidance) The separate publications of the Guidance can be downloaded from: - Mini-checklist & Quickscan Questionnaire: http://www.rivm.nl/bibliotheek/digitaaldepot/Guidance_MC_QS-Q.pdf - Quickscan Hints & Actions List: http://www.rivm.nl/bibliotheek/digitaaldepot/Guidance_QS-HA.pdf- Detailed Guidance: - Tool Catalogue for Uncertainty Assessment: - Alternative download link for all documents: Introduction Part I. Background information on communicating uncertainty 1. Reporting uncertainty in a gradual and custom-made form 6 2. The readers perspective 7 2.1 Access to report/document 8 2.2 Chapters/sections/sentences paid attention to 8 2.3 Processing of uncertainty information 10 2.4 Interpretation of uncertainty information 11 2.5 Use of uncertainty information 13 uncertainty information 14 3. Criteria for uncertainty communication 15communication accordingly 1 Context of Communication of Uncertainty 17 2. The target audiences 18 2.1 Who are the Target Audiences? 18 2.2 Information Needs of the Target Audiences 18 2.2.1 The client/customer 18 2.2.2 Other target audiences 19 2.3 Anticipating impacts on target audiences 20 3. Restructuring the (Uncertainty) Information 22 3.1 Uncertainty Information Collected 22 3.2 Identifying Policy-Relevant Aspects of Uncertainty 23 3.3 The Main Messages/statements in view of the uncertainties 24 4 Developing a strategy for Progressive Disclosure of Information 25 4.1 Filling in the PDI table 25 4.2 Internal coordination using the PDI table 28 1. Reporting uncertainty information … What and how 31 1.1 Context of and insight in the assessment 31 into account. 33 1.3 Reporting orts and types of uncertainties 34 1.4 How uncertainty was dealt with in the analysis 38 In 2003 the Netherlands Environmental Assessment Agency (MNP) published the RIVM/MNP Guidance for Uncertainty Assessment and Communication. The inty in environmental assessments. Dealing with uncertainty is essential because assessment results regarding complex environmental issues are of limited value if the uncertainties have not been taken into account adequately. A careful analysis of uncertainties in an environmental assessment is required, but even more important is the effective communication of these uncertainties in the presentation of assessment results. The Guidance yields rich information may vary across audiences and uses of assessment results. Therefore, the Guidance. In practice, users of the Guidance felt a need for more practical assistance uncertainty communication in more detail, and contains more detailed guidance on the communication of uncertainty. In order to make this a stand alone document several questions that are mentioned in the detailed Guidance have been repeated here. This document thus has some overlap with the detailed Guidance. This report offers background information on uncertainty communication, and contains suggestions and guidance on how to communicate uncertainties in environmental assessment reports to several target audiences in an adequate, clear, and systematic way. It is not claimed that this is the only way or the best way to communicate uncertainty information, but the guidance in this report draws upon insights from the literature, insights from an international expert workshop on uncertainty communication (Wardekker and Van der Sluijs, 2005), and several uncertainty communication experiments in the Utrecht Policy Laboratory (Kloprogge communicating uncertainty information. It offers guidelines for (fine)tuning the readers of a report tend to handle uncertainty information, and ends with a list of criteria that uncertainty communication needs to meet to increase its effectiveness. Part II helps writers to analyze the context in which communication takes place, and helps to map the audiences, and their information needs. It further helps to reflect upon anticipated uses and possible impacts of the uncertainty information on the policy debates. Finally, in part II assistance is offered in customising the (uncertainty) information of an assessment for communication and reporting purposes. Part III contains practical information on how to communicate uncertainties. It addresses aspects of uncertainty that might be important in a specific situation, do's and don'ts, pitfalls to be avoided, and hints on how to communicate this uncertainty information. The report focuses mainly on uncertainty communication in written material (especially reports), since the major part of the RIVM/MNP communication takes place by means of reports. For scientific audiences there are reasonably well-established protocols for communicating uncertainty. Therefore, this report mainly Part I Background information on communicating uncertainty 5 and exposed became the dynamite that destroyed the credibility and acceptance of risk assessment studies. On the other extreme, technical details on uncertainty information o'clock news, but may be highly interesting for colleague researchers. Because of the differences in purpose and audiences of different PDI layers, the role of reporting uncertainty is different for inner and outer PDI layers. In outer PDI layers the main purpose of the reported uncertainties is to put the assessment results and policy advice in context. In inner PDI layers providing a scientific account of the approach and results of the environmental assessment is the main purpose of reporting uncertainty. When making use of the concept of PDI in uncertainty communication, the PDI layer. Some general guidelines are shown in Table 1. Outer PDI layers Inner PDI layers Uncertainties can be integrated in the message (implicit in the word "may" or "might") Uncertainties mentioned separately Uncertainties as essential contextual information on the assessment results the study and on the assessment political and societal context from a scientific point of view Emphasis on policy relevance of all parts of the assessment Emphasis on implications of Emphasis on nature, extent and Implications of uncertainties for the assessment results and the Implications of uncertainties for Scientific information translated Scientific information with a high technical sophistication Use of jargon to be avoided Use of jargon allowed more detailed information than the previous PDI layer) Table 1: General guidelines on the contents, style and degree of detail of reported uncertainty information at different PDI layers As mentioned in the introduction in this report we mainly focus on communicating information in a specific report or document is handled by these audiences. primary layer is not fixed, but context dependent. The other chapters … where mostly the majority of the uncertainty information is reported … can be considered as the background layer. Reading studies (studies in which readers are observed while reading and commenting on a report) among a number of policy makers, members of parliament and NGO representatives showed that these readers spend significantly more time on parts of the primary layer than on parts of the secondary layer. Besides this, information in the primary layer is often the basis for the readers decisions on which parts of the text they will read: this selection is often based on the contents, index, summary and introduction of the report. Besides using these specific sections section and paragraph titles to see whether the information in those chapters and sections is relevant to them (Vaessen en Elling, 2000). Professional readers try to spend as little time as possible in retrieving information that is relevant to them by making strict selections. with a negative attitude read significantly fewer parts of the text than the ones with a If the reader pays attention to a chapter or section, in most cases not all sentences are more sentences of the primary layer, than of the background layer. Both in a relative and absolute sense the readers spend more time on the primary layer. Especially sentences in the summary and conclusions are relatively well read.With regard to uncertainty information, Vaessen (2003; p. 124) concludes: By far not all information in a report is read, and also important information on uncertainties that is needed to assess the strength of the conclusions is often not read. In short: time spent on reading the report is often limited because of competition from other reports/documents on the topic, and because of competition from other topics -most reading time is spent on the primary layer (summary, introduction, conclusions and recommendations, and chapters containing essential answers with regard to the reports topics) the contents, index, summary and introduction are often used to select the chapters and sections that the reader will read selecting the sections that the reader will read is also done by browsing chapter, section and paragraph titles readers with a negative attitude towards the conclusion of the report read fewer parts of the text than readers with a positive attitude compared to the background layer, more sentences of the primary layer are read the information eventually read is quite limited; also important uncertainty information needed to understand the strength and scope of the conclusions is often not read 9 In short: People tend to look for information that is in line with their existing world views Readers with a negative attitude towards the conclusions of the report may spend little time reading it since it does not support their they specifically look for uncertainty information that support their views. In discourses on highly controversial risks with high decision stakes this can take the form of stretched peer review of unwelcome results. readers with a positive attitude towards the conclusions of the report may be less open to uncertainty information, since this information is not in line with their views. They may process it in a fast and frugal way or skip it. When uncertainty information is read, the ideal situation would be that every reader would interpret the uncertainty information in the same way as the writer has intended. However, interpreting uncertainties is … even for policy makers …difficult. The readers level of knowledge may be insufficient to interpret the information correctly: for instance, the reader may not be familiar with Probability Density Functions (PDFs) or probabilities and therefore cannot interpret the uncertainty information presented by a PDF or a Cumulative Density Function (CDF) correctly. The level of understanding may also be a bottleneck: an example is a reader who does interpretations may be biased, and interpretation differences between individuals may Especially uncertainty information concerning probabilities is prone to biases, as the concepts themselves are not easy to understand fully (Van de Vusse (ed), 1993, Slovic, 1987, Cosmides and Tooby, 1996, Brase et al. 1998, Rode et al., 1999, artefactual situation, ordinary intuition is not a reliable guide to an estimated answer. The human mind also has problems with correctly combining probabilities. For example, suppose that 2% of a population has a given disease and a test to this disease performs such that anyone with the disease will test positive (there are no "false negatives"), while 90% of those without the disease will test negative. If people are asked to estimate the chance that a person with a positive test result actually has the disease, estimated chances seriously overestimate the probability that follows from mathematical logic (16.9 % in this example). This is because people put too much weight on the higher percentage, the reliability of the test, and not enough to the small prevalence of the disease baseline probability and the false positives (Department of This tendency to forget the baseline probability also results in a problem when risks are framed in different ways. The perceived message of communication on a risk depends critically on whether risks are given in absolute terms (chance was 2% and is Another effect that may play a role in the interpretation of probabilities is that people in their brain do not separate the probability and magnitude components of a risk and thus tend to take the magnitude of effects into account when translating probability language into numbers and vice versa. If experts artificially separate probability and magnitude, and in their communication use probability language that reflects the probability component of the risk only, this mechanism causes the reader to perceive the chance for low magnitude events to be higher and the chance of high magnitude events to be lower than what the expert intended to communicate. (Patt and Schrag, interpretation of weather forecast information by users (farmers). Besides these technical interpretation issues, interpretation can also be influenced by how the information is formulated (framing). For example, introducing environmental policy measures in order to improve the situation sounds more positive than in order to avoid deterioration. Uncertainties can be presented as an omission, as a marginal note or as essential policy relevant information. In short: when uncertainty information is processed, interpretation differences between individual readers, misunderstandings and biases may occur (such as availability heuristic, confirmation bias, overconfidence effect/bias) -relative changes in risks can sound alarming, but can be seriously misleading if the baseline risk is not clear -risk experts artificially separate the probability and magnitude components of a risk, but non-scientific audiences don't, leading to an under-appreciation of low probability high impact events framing influences the interpretation of uncertainties When uncertainty information has been read and processed, the question remains whether and how this information is used (for example, in the policy process, public debate or to form a personal opinion), and whether it is used correctly. Uncertainty information that was processed may simply be forgotten after reading it. Also, a reader may not have the opportunity to use uncertainty information. For example, in a debate, time may be too limited to thoroughly discuss a topic, and uncertainties may not be addressed. Uncertainty information that has been processed may be dismissed Also, strategic use can be made of uncertainty information, for example by picking a part of an uncertainty range that leads to conclusions supportive of the readers political viewpoints. Of course, biases in the interpretation of the uncertainty information of the reader will also exist during the use of the information by that Policy makers in general seem to consider uncertainty information as a useful input in the policy process. It can be used for prioritisation and determining the efficiency and effectiveness of policy measures. In the political process, uncertainty information may From the previous sections the following general good-practice criteria for adequate uncertainty communication can be deduced that ideally should be met: 1. uncertainty communication deals with information on uncertainty that is 2. the audiences should have access to the uncertainty information, and know where to find (more detailed) uncertainty information 3. The uncertainty information offered should be consistent (across different reports, different issues, different authors, et cetera). 4. essential uncertainty information should be located in sections of the report 5. the information on uncertainty is clear to the readers 6. the information on uncertainty is not too difficult to process by the readers itself 7. uncertainty communication meets the information needs of the target the overall message (that is: knowledge claims and uncertainty information) is useful to the audiences for making policy decisions and/or for use in assessments for policy advice)9. the overall message (that is: knowledge claims and uncertainty information) is credible to the readers (well underpinned and unbiased) This part of the report helps to explore the context and audiences of communication of uncertainty information (sections 1 and 2). Next, section 3 assists in restructuring the main findings of the environmental assessment and the uncertainty information for the purpose of communicating this information in the varying PDI layers. What information to communicate in what PDI layer is explored in section 4.as a preparation for part III (Practical suggestions on reporting uncertainty information) by enabling writers to make a well argued choice regarding which issues To get a clear picture of the context of communication of uncertainty as a starting point for a communication strategy, the following diagnostic questions can help: 1. What is the role of the analysis/assessment that is being reported? Check all that To foster recognition of new problems To provide background information on earlier communications by the MNP To report new scientific insights/methods Tt forms part of a much broader assessment 2. What contextual factors add to the need for communicating uncertainty? Check all that apply: To conform to good scientific practice (for scientific purposes) Practice of the institution that carries out the environmental assessment 3. What PDI layers can be distinguished? Check all that apply: Summary Conclusions and recommendations Summaries of the chapters The robustness of the conclusions with respect to uncertainty should be Uncertainty in the major outcomes should be indicated The major causes of the uncertainty should be determined The implications of uncertainty for the policy issue at hand should be 2. What form of uncertainty information is requested by the client in this uncertainty assessment? Qualitative information Quantitative information 3. Explain why this is the (minimal) requirement with respect to uncertainty management. 4. Describe any further requirements by the client about the form in which uncertainty 2.2.2 Other target audiences 1. If members of the target audiences have been involved during the assessment process, what conclusions can you draw from the interaction with them with respect to their information needs on uncertainty? 2. Which questions, problems and tasks can be identified among target audiences? What are the problem frames of the stakeholders (see section 1.1 of the detailed of the detailed Guidance)? Based on this, what uncertainties are likely to be of importance to them or interesting to them? 3. Do specific stakeholders want the primary audiences information? (for example, do policy advisors want policy makers to receive specific information?) 4. What is the position of the problem at hand in the policy cycle? Based on this, what are likely information needs of policy makers regarding uncertainty? (see I; 2.5) 5. Are there any particular information needs regarding uncertainty to be expected by policy makers at different organisational levels (local/regional/national)? 6. Are there, do there seem to be or do you expect to occur, any misunderstandings among the audiences regarding the topic at hand? In their pointers to good practice for communicating about risks to public health the UK Department of Health identified a number of risk characteristics that make risks generally more worrying for audiences (Department of Health R isks are g enerall more worr y in (and less acceptable) i f perceived: involuntary (e.g. exposure to pollution) rather than voluntary (e.g. dangerous sports or smoking) (some benefit while others suffer the consequences) by taking personal precautions 4. to arise from an 5. to result from hidden and irreversible damage, e.g. through onset of illness many years after exposure 7. to pose some particular danger to small children or pregnant women or more generally to future generations 8. to threaten a form of death (or illness/injury) arousing particular dread 9. to damage poorly understood by science contradictory statements from responsible sources (or, even worse, from the same source). In their pointers to good practice for communicating about risks to public health the UK Department of Health identified a number of characteristics of risks to public health that make it more likely to become a major story in media coverage (Department of Health UK, 1997). A possible risk to public health is more likel y to become a ma j or stor y i f the f ollowin are prominent or can readil y secrets and attempted "cover-ups" "Human interest" victims) Signal value: the story as a portent of further ills ("What next?") ("It could be you!")visual impact For environmental topics we can add the following media triggers: - Environmental problems where is at stake (as opposed to damage to nature or animals) - If animal suffering is involved: a high pet factor of the animals p ics in which substantial p olitical tensions p la a role21 Consider implications for different settings of the burden of proofConsider implications for policy, politics and society 5. Indicate which important uncertainties could possibly be reduced in the future and 6. Indicate which important uncertainties are not expected to be reduced in the future, and discuss the implications of this for the issue at hand.3.2 Identifying Policy-Relevant Aspects of Uncertainty When uncertainties in an environmental assessment are being communicated for scientific reasons, the main goals are to make the assessment transparent and communicated in an assessment meant for policy advice, uncertainties are particularly important if they have a great impact on the policy advice given in the assessment or if they lead to inconclusive policy advice. Uncertainties in the assessment that are subject to debate among stakeholders can also be policy relevant.1. In situations like the ones listed below, uncertainties in the assessment are likely to be more policy relevant. Check all that apply. The outcomes are very uncertain and have a great impact on the policy advice The outcomes are situated near a policy target The outcomes are situated near a threshold set by policy The outcomes are situated near a standard/norm set by policy A wrong estimate in one direction will have entirely different consequences for policy advice than a wrong estimate in another direction. Possibility of morally unacceptable damage or catastrophic events. There are value-laden choices/assumptions that are in conflict with the views 2. What aspects are relevant in view of the position of the issue in the policy cycle? Recognition of a problem and agenda setting: fundamental matters such as the boundaries of a problem, level of scientific knowledge available, research methodology, environmental quality, causes, effects, etc. Policy formulation: impacts, emission data, scenarios, expected policy effects and policy costs (environmental, economic, social), etc. The burden of proof here is the obligation to prove allegations in a procedure of risk regulation. This can differ from case to case and amongst countries. One setting can be that the one who undertakes an activity that is suspected to pose risks has to prove that the risk is within acceptable limits, another setting can be that those who may suffer the risk have to prove that the activity poses unacceptable risks to them. 5. What are implications of the uncertainties for the policy process/decision/social 6. What are implications of the uncertainties for different risk management strategies? 7. Verify how robust the main messages are in view of the choices made, the assumptions used, the strength of the knowledge base and the uncertainties in data, In order to report uncertainties in an adequate manner several issues have to be taken into account. It is not simply a matter of presenting a range instead of a single number. In order for the audiences to make sense of the uncertainties, it helps if they have some knowledge on the context of the assessment and the assessment itself (that is, how it was conducted). It is not merely a matter of reporting the uncertainties themselves, but they also need to be properly reflected in the formulation of the main messages that are conveyed. Moreover it can be of importance to inform the audiences on the implications of the uncertainties and what can be done about it. It will often be relevant to inform them with insights in how the uncertainties were dealt with in the assessment and additionally offering them educational information on audiences, etcetera) to what degree these aspects need to be addressed in the reporting phase. In order to provide audiences with uncertainty information in a gradual and tiered fashion, customised to their information needs, we use the strategy of Progressive Disclosure of Information (PDI; see section 1 of part I of this report). In this section a table is constructed indicating which uncertainties need attention in what In Table 2 a template for a PDI table is given that assists in the making of a plan regarding what uncertainty information to communicate in what PDI layer. When environmental assessment results concerning a topic are reported, this Table can be information, customised to their needs. How to fill in the Table will be discussed - Fill in the Table cells using key words (not the literal text to be used in the written material). - When determining what aspects of uncertainty should be given attention in a Main messages What are the main messages to be communicated section 3.3). Main messages in outer PDI layers generally are statements of a more political/societal nature ( for example, particulate matter is a policy problem that requires action), whereas the main messages in inner PDI layers tend to (also) convey scientific information (for example, ambient particulate matter concentrations amount to....). What are the main statistical uncertainties, scenario uncertainties and ignorance to be communicated in a specific PDI layer? (see part II, sections 3.1 and 3.3). For outer What are the main weaknesses in the knowledge base (including methods used) to be communicated in a specific PDI layer? (see part II, sections 3.1 and 3.3). For outer What are the main value laden choices in the assessment that need to be communicated in a specific PDI layer? (see part II, sections 3.1 and 3.3). For outer What are implications of the uncertainties that need to be communicated in a specific PDI layer? (see part II, sections 3.1 and 3.3). For outer PDI layers: pay extra attention to policy relevant aspects (see part II, section 3.2). This includes implications of uncertainty types and sources of uncertainty (could the findings be radically different if these excluded uncertainties would be systematically assessed)? (Ir)reducibility uncertainties What are aspects of (ir)reducibility of uncertainties to be communicated in a specific PDI layer? For outer PDI layers: pay extra attention to policy relevant aspects (see What aspects of how uncertainty was dealt with in the environmental assessment have to be communicated in a specific PDI layer? (see part II, section 3.1) What types and sources of uncertainty were included in / excluded from the analysis? What educational information on uncertainty is to be communicated in a specific PDI PDI layer Intended audiences Space Context of and insight in the assessment scenario ignorance weaknesses in knowledge base value Implications of the uncertainties (Ir)reducibility of was dealt with Table 2. Template for a table to assist in developing a plan for progressive disclosure of uncertainty information. don'ts regarding communicating uncertainty. Section 1 presents practical guidance on to report uncertainty information. Practical guidance on different (numeric, linguistic, graphic) is presented in section 2. This part of the report contains some examples, which are placed in boxesWherever insights from part I and part II of this report are relevant, this will be indicated. This will have the form of (question is optional). For example, II; 3.2;1 means: see part II, section 3.2, question number 1. If new insights emerge from working with part III, writers may want to review the PDI table The hints, pitfall warnings, dos and don'ts in this part of the report are intended to help avoid incorrect interpretations of uncertainties in a specific assessment, and to help make the uncertainty information useful and meaningful for the audiences. If … besides this … attention is paid to the locations in a report where this information is offered, the presentation of the uncertainty will be better customised to the processes by which readers deal with (uncertainty) information (see part I, section 2). As presented in part II, section 4 the following aspects related to uncertainty may be communicated to the audiences: - Context of and insight in the assessment - Main message in which uncertainties are reflected or taken into account.- Reporting sorts and types of uncertainties and how these propagate to the outcomes of interest - How uncertainty was dealt with in the analysis - Implications of uncertainties - What can be done about uncertainties - Educational information on uncertainty Below, what and how to communicate will be discussed per item. 1.1 Context of and insight in the assessment policy questions and policy developments. Indicate the (potential) position of this assessment in the policy/societal debate, and in what way it can contribute to this debate. Part of the examples are based on our findings of a communication experiment in the Utrecht Policy Laboratory (Kloprogge and Van der Sluijs, 2006b). In this session uncertainty information from the Dutch Environmental Balance 2005 was tested on a number of 9 lay persons. It should be noted that due to the limited numbers of participants, the conclusions of this study are preliminary. The examples mentioned here are only intended as illustrations of the main text. 1.2 Main message in which uncertainties are reflected or Check whether the main messages you want to convey match the interest and needs of the receiver(s) and what they intend to do with the information (II; 2.2 Check whether the proposed message can be seen as inconsistent with previous messages. If inconsistency has a reason (for instance, new insights), provide the Formulate the message in such a way that there is no confusion when it is compared to old messages. Writing assessment reports is mostly a joint effort involving several people (analysts, team coordinators, supervisors, and communication specialists, and sometimes employees from other institutes.) If there is dissent on the main messages, be aware of processes in which text sections are kept vague or ambiguous on purpose, in order to accommodate all views of those involved. Also be aware of skipping or ignoring issues that involve conflict or moving them to less important sections of the report (for instance, footnotes and appendices).If debates in politics and society show persistent misunderstandings regarding specific topics, pay additional attention to messages regarding these topics. (II; Pay extra attention to formulating messages that involve issues related to fright factors or media triggers (II; 2.3; 2). Make sure that the message is underpinned by arguments. State the essential conclusions in a clear and concise form. For this purpose use can be made of the LOOK/SINCE/THUS rule of thumb in order to express in a few short sentences the essence of the message. E.g., LOOK: RIVM has concluded that the costs of medication and medical appliances in the Netherlands will increase with 7 to 11%. SINCE population growth and ageing will lead to a higher demand. Also the potential for custom-made goods will grow and these are often more expensive. THUS additional policy measures are required or politicians should accept total budget for medical care is spent on these items. Be honest and open about what you do not know. Do not make statements that Aim for policy-relevant conclusions that are robust with respect to the underlying The formulation should make the reader clear whether he is dealing with a well-founded or a speculative conclusion or something in between. (III; 2.1) by important stakeholders, one is tempted to present the results as more certain science. If quantitative statements are made: how many significant digits can be used? (III; 2.2) Information on the following aspects of uncertainty may be presented in reportsmagnitude of uncertainties statistical uncertainties level of empirical information ability to build a model structure based on state of the art knowledge theoretical knowledge that is lacking empirical data that are lacking degree to which evidence proves something conflicting scientific evidence scientific controversies societal controversies different interpretations of data, theories, lines of evidence confidence in data, theories, lines of evidence acceptance of data, theories, lines of evidence by experts choices with respect to problem framing controversies with respect to problem framing choices with respect to methods limitations of methods choices with respect to indicators aspects that were not considered in the study / system boundaries important assumptions practical limitations (e.g., time constraints) legal, moral, societal, institutional, proprietary and situational Make sure that the precision level of the uncertainty information is adapted to the existing scientific understanding. In the following scheme (table 3, Risbey and full probability density function, he moves down one or more level, until he reaches the level that corresponds with the scientific understanding. One can also start at the bottom level of the table. This list is not intended to be complete, and lists a sample of partly overlapping issues. report is primarily written for policy related audiences the information has to be tuned to their information needs and should discuss the policy relevance of uncertainties identified. Some uncertainties will be more important for these audiences than others. A seeming imbalance in the presentation of uncertainties may be the result. In a detailed background report for scientific audiences on the deposition of the X and Y, for both substances the main uncertainties are reported systematically throughout the calculation steps that lead to the conclusions on the deposition (emission, dispersion, atmospheric chemical processes and atmospheric transport). Let us say that the deposition of substance X is near the threshold set by policy and the deposition of Y exceeds the threshold for Y by far. In a report for policy makers the uncertainties in the calculation of the deposition of substance X will be more important than those of substance Y: in the case of Y it is clear to the policy makers that they will have to take policy measures to decrease its deposition. In case of X they have to take the uncertainties account in their decision on whether to take policy measures or not. The detail and style of the reported uncertainties depend on the PDI layer. implicit integration of knowledge claims and uncertainty information is acceptable non-technical information uncertainties translated to the political and societal contextseparate and explicit treatment of uncertainties technical information When reading uncertainty information in a section, readers should be informed on where they can learn more about these uncertainties:Refer to other sections in the report or to other MNP/RIVM reports.State the sources that were used to base the uncertainty information on Point readers to other reports, websites or MNP/RIVM employees that may be of interest to them in view of the uncertainties discussed.Make sure that the uncertainty information in the summary, main conclusions, main text, background documents, figures, tables and graphs, etcetera is consistent. That is, that the content of the uncertainties in these sections are not in contradiction to each other (they may be formulated differently, but they should tell the same story).Strive for a consistent way of communicating uncertainties regarding different topics within one report and for a consistent treatment across reports and PDI layers. The latter is especially important for integral studies, where conceptual harmonisation and consistency is desirable to avoid misunderstandings. The Dutch manure policy has had a great impact on the agricultural sector in the Netherlands. Farmers had to make a considerable effort to comply to the rules and regulations and a part of the businesses experienced financial problems and had to shut down. However, despite all efforts, after studying this topic, the RIVM had to conclude that the policy goals were still not going to be met and that more had to be done. This is a message that will meet with a lot of resistance from the agricultural sector, and will lead to heavy criticism on the studies. The RIVM commissioned an independent review of their study by a number of renowned scientists from several Dutch universities and institutes. In the RIVM report evaluating the Dutch manure policy (Mineralen beter geregeld. Evaluatie van de werking van de Meststoffenwet 1998 … 2003) the findings of this scientific committee was included in an appendix. The committee addressed the following questions: - Are the research methods used accepted and state of the art? - Are the data used the best available data? - Are there any caveats in the studies that can still be addressed? - Are there any caveats in the studies that can only be addressed through further long term research? - Are the conclusions scientifically sound, and are the conclusions sufficiently backed by the facts presented and the analysis of these facts? - Have the analyses been correctly and fully conducted in relation to the conclusions? - Has sufficient attention been paid to uncertainties? Also included in the report was a reaction of the RIVM on the findings of the committee. Uncertainties in assessments (including choices made and assumptions used) have implications for the meaning and scope of applicability of the assessment results and the representativeness of the results and conclusions. In reports mainly intended for scientific audiences (inner PDI layers), this is usually extensively need to be at the centre of attention. A translation has to be made of the value and representativeness of the results to the policy context. (I; 1) Make clear what the uncertainties imply for the main policy relevant conclusions. How robust are the conclusions in view of the choices made, the assumptions used, and the uncertainties in data, models, and other knowledge used? (II; 3.3) Often, uncertainty analysis is partial and includes for instance parameter uncertainty and no model structure uncertainty. Use the Uncertainty Matrix (see Appendix I of the Quickscan Hints & Actions List) to identify and make explicit types and sources of uncertainty that were not systematically addressed. Reflect on how results might be different if those types and sources of uncertainty that were not systematically addressed in the analysis so far, would have been analysed systematically. about the uncertainties in the assessment. Indicate which uncertainties are inevitable). (II; 3.1; 5 and II; 3.1; 6) Indicate which uncertainty aspects deserve additional attention in the future in view of obtaining insights for the policy problem at hand. This will facilitate the assignment of priorities for future research. - Indicate whether something can be done about the bottlenecks in the knowledge base. In some cases little can be done about ignorance or a lack of knowledge (think of, for example, the unpredictability of the daily weather more than two weeks ahead), in some other cases it is a matter of collecting more data and information or conducting further research. In the latter case, typically a trade-off will be involved between the costs and efforts of this task and the benefits which are expected to result from it. For audiences that are not used to dealing with scientific uncertainties, educational information may be useful. This information could, for instance, be included in an appendix of a report. It should be noted, however, that not many people will read information in appendices. Especially if the appendices are not directly related to the topic of interest. Explain that there are different aspects to and dimensions of uncertainties (location of uncertainty, level of uncertainty, etcetera; see Appendix A of the detailed Guidance or Appendix I of the Quickscan Hints & Actions List). Explain that a high-quality assessment does not imply low uncertainty, and, vice versa, that high uncertainty does not imply that the assessment is of poor quality. Explain that science has its limitations when dealing with complex (societal) problems where there are many system uncertainties, and where facts and values are intertwined. Explain that some uncertainties are irreducible. Explain that further investigating complex problems may bring forward more new uncertainties than that it succeeds Explain that insights from assessments are not static. Especially where recognised ignorance prevails, insights may change over time as new information becomes available. This is especially the case in fields of knowledge that are rapidly Pay attention to an explanation of specific types of uncertainties related to a topic. (For instance, on the topic of emissions, explain that a distinction can be made between monitoring uncertainty (diagnosis) and uncertainty regarding future emissions (prognosis)) Explain that a statement on the probability of an event (for example, meeting a policy goal) does not provide any information on what the quality and subsequently the reliability of this estimate is. An extreme case of different interpretations by different people is the word possible. In a study in which people were asked to indicate the probability that is expressed by this word the answers may range from circa 0 to circa 1 (figure 3). Probability that subjects associated with the qualitative description 0.00.20.40.60.81.0 Almost certainProbableLikelyGood chancePossibleTossupUnlikelyImprobableDoubtfulAlmost impossible range of individual upper bound estimates range of individual lower bound estimates range from upper to lower median estimateQualitative description of uncertainty usedFigure 3: Words have different meanings for different people. Figure from Granger Morgan (2003), adapted from Wallsten et al., 1986. There is a risk that normative opinions of the writers enter verbal statements. The numeric information 200 animals/year killed by traffic may be reported verbally as A large number of animals is killed per year by traffic. However, different readers may hold varying opinions on whether a number of 200 is large or actually small. The writer can accentuate his opinion even more by formulating the verbal statement as: A great number of animals is killed by traffic Constructing verbal expressions Pitfall: if several people or institutes are involved in writing a report, all of them have to agree on the final text. If there are disagreements on topics, this may (consciously or unconsciously) lead to the use of vague formulations in which several points of view are accommodated at the same time, without making the disagreement explicit Avoid using ambiguous language. events. Linguistic scales can also be used for making statements on, for example, the evidence or to describe the level of understanding. Examples from the literature are LevelLegal standard 11virtually certain 10beyond a reasonable doubt 9clear and convincing evidence 8clearshowing7substantial and credible evidence 6preponderance of the evidence 5clearindication4probablecause/reasonable belief 3reasonableindication2reasonable, articulable grounds for suspicion 1no reasonable grounds for suspicion/inchoate 0Insufficient even to support a hunch or conjecture Table 5: A scale for scientific certainty based on legally defined standards of Figure 4: a scale for assessing the Žqualitatively defined levels of understandingŽ (IPCC, 2005) A disadvantage of a fixed scale is that it doesnt match peoples intuitive use of probability language. People translate such language taking the event magnitude (severity of effects) into account, which may result in an overestimation of the probability of low magnitude events and an underestimation of the probability of high magnitude events, when a fixed scale is used for communication. Problems appear to be most pronounced when dealing with predictions of one-time events, where probability estimates result from a lack of complete confidence in the predictive models. In general, the context of an issue influences the interpretation and choice of uncertainty terms.(Patt and Schrag, 2003; Patt and Dessai, 2005) Another issue of the use of scales is that they privilege attention to quantifiable and probabilistic uncertainty. It is much harder to address deep uncertainty (e.g., problem framing uncertainty, methodological unreliability or recognised were information is given where the vocabulary is not specifically meant for. Use In the Dutch Environmental Balance 2005 probability in indicated by names such as Virtually certain, Likely, Unlikely. In th ammonia emissions a recent study with new insights is mentioned. If this study turns out to be representative, it becomes lesslikely that the (...) target in 2010 will be met. By using the term likely readers may associate and confuse this information with the probability intervals. An alternative would be for instance: chances that the target will be met will become lower. Numbers are more specific than words. Provided that the readers understand the way in which the numeric information is presented (for example, if they know what a confidence interval is, and know how differences between individuals will be smaller than when the information was If information is only presented in numbers, some of the readers will translate this information into verbal expressions (either for themselves or when communicating the information to other people). If this translation is done incorrectly, this will lead to miscommunication. Numbers are prone to the pitfalls of suggesting unwarranted precision if used without mastering basic "craft skills with numbers" (Funtowicz and Ravetz, When presenting numbers in inner PDI layers: indicate why the presented numer is of importance (state the significance of the number, compare it to other numbers, if applicable). Avoid pseudo precision and pseudo imprecision. Pseudo-imprecision occurs when results have been expressed so vaguely that they are effectively immune from refutation and criticism. Pseudo precision is false precision that occurs when the precision associated with the representation of a number or finding grossly exceeds the precision that is warranted by closer inspection of the underlying The following joke illustrates an incorrect use of precision level (Funtowicz and Ravetz, 1990): A museum visitor asks a museum attendant how old the dinosaur bone is which is on display. It is fifty million and twelve years old., replies the museum employee. Really?, is the surprised reaction of the visitor. How can you be this precise? Well, says the employee, When I started working here this fossil was 50,000,000 years old. And I have been working here for twelve years now. 46 Significant Digits in Addition and Subtraction When quantities are being added or subtracted, the number of decimal places (not significant digits) in the answer should be the same as the least number of decimal places in any of the numbers being added or subtracted. Example: 5.67 J (two decimal places) 1.1 J (one decimal place) 0.9378 J (four decimal place) 7.7 J (one decimal place) Keep One Extra Digit in Intermediate Answers When doing multi-step calculations, keep at least one more significant digit in intermediate results than needed in your final answer. For instance, if a final answer requires two significant digits, then carry at least three significant digits in calculations. If you round-off all your intermediate answers to only two digits, you are discarding the information contained in the third digit, and as a result the second digit in your final answer might be incorrect. (This phenomenon is known as "round-off error.") The Two Greatest Sins Regarding Significant Digits 1. Writing more digits in an answer (intermediate or final) than justified by the number of digits in the data. 2. Rounding-off, say, to two digits in an intermediate answer, and then writing three digits in the final answer. Source: http://www.physics.uoguelph.ca/tutorials/sig_fig/SIG_dig.htm - When presenting ranges, clearly specify what they refer to (for instance, min/max, 95% confidence interval, plus or minus two standard deviations, what-if results, - Indicate what aspects of uncertainty are taken into account in a reported uncertainty range. If, for example, there is an uncertainty of 2% regarding greenhouse gas emissions in a specific year in the future, indicate whether into account, and whether parameter uncertainty and/or model structural uncertainty and/or model completeness uncertainty were included in the calculation of the range. If some were left out, be explicit about that and explain Constructing graphical expressions Figure 5: a few examples of graphical presentations of uncertainty (Ibrekk and Morgan, 1987 cited in: Morgan and Henrion, 1990) 1. Traditional point estimate with an error barŽ that spans a 952. Bar chart (discretised version of the density function) 3. Pie chart (discretised version of the density function) 4. Conventional probability density function (PDF) 5. Probability density function of half its regular height together with its mirror image 6. Horizontal bars of constant width that have been shaded to d7. Horizontal bars of constant width that have been shaded to disp8. Tukey box modified to indicate the mean with a solid point Conventional cumulative distribution function (CDF), the integral of the PDF. Figure 5 lists a number of ways to graphically represent probability information. What method of graphical presentation (for example, Probability Density Function (PDF), Cumulative Density Function (CDF), Tukey Box Plot, or pie chart) is most The figure presented below indicates the effect of policy measures on emissions in the past and indicates what effects are to be expected in the future. Figure 5: The effects of Dutch policy and the purchase of emission reduction abroad on reaching the Kyoto-obligation. (source: Erratum Environmental Balance 2005: Greenhouse gas emissions, 2005) Because the figure already contains a lot of information (or even too much information), it was decided in the writing phase of the report to omit the uncertainty bands. However, when lay readers were asked in a test-situation how they would characterise the uncertainty regarding the emissions in the year 2010 (based on this figure only) only 2 of the 9 readers indicated correctly that this could not be based on the information of the graph. The answers given by the other readers showed a large spectrum of opinions: 1 person answered the uncertainty was small, 2 that is was not small/not large, 2 that it was large, and 2 that is was very large. (The answers they could choose from were: very small; small; not small/not large; large; very large; cannot be determined based on this information; I do not know).Be aware of the fact that some elements in figures may be suggestive, such as magnitudes of surfaces, colors, scales etc.Besides the construction that uncertainty information is added to figures These kind of representations are not necessarily complex, but the readers do need extra information on what is being displayed in figures like these. It requires them to think on a different, more abstract level. Examples of such representations are 2.4 Combinations for expressing uncertainty information Uncertainties can be reported in verbal, numeric and graphical form simultaneously: but also includes numbers, and the section contains a figure in which the uncertainties are graphically displayed. This may have the following advantages: The repetition may result in a better understanding of the uncertainty, Since a description of the uncertainties occurs at several locations in a specific section of the report, chances are higher that the reader will notice this information Users may have preferences for a specific form of presentation: he may browse through the report and mainly pay attention to the figures or, for instance, scan the text for numbers. If the uncertainty information is reported in all three forms, readers who mainly pay attention to one of these forms will not miss uncertainty information that is only reported in the presentation forms he does not pay attention to. Presenting the uncertainty information in several presentation forms will require more consistency in the messages displayed. IPCC, 2005. Guidance Notes for Lead Authors of the IPCC Fourth Assessment Report on Addressing Uncertainties. Janssen, P.H.M., A.C. Petersen, J.P. van der Sluijs, J.S. Risbey, J.R. Ravetz , 2003: RIVM/MNP Guidance for Uncertainty Assessment and Communication: Quickscan Janssen, P.H.M., Petersen, A.C., Van der Sluijs, J.P., Risbey, J., Ravetz, J.R. (2005), A guidance for assessing and communicating uncertainties. Water science and Kahneman, D., Slovic, P., & Tversky, A. (Eds.) 1982. Judgment under Uncertainty: ´Onzekerheidsinformatie in de Milieubalans 2005´, Department of Science, Technology and Society, Copernicus Institute, Utrecht University, Utrecht, The Netherlands. (NWS-E-2006-56) onzekerheidscommunicatie rond fijn stof en gezondheid, Department of Science, Technology and Society, Copernicus Institute, Utrecht University, Utrecht, The Krämer, W., & Gigerenzer, G. 2005. How to confuse with statistics: The use and misuse of conditional probabilities. Statistical Science Maxim, L. and J.P. van der Sluijs (2007), Uncertainty: cause or effect of stakeholders debates? Analysis of a case study: the risk for honey bees of the insecticide Gaucho®, Science of the Total EnvironmentMichaels D. 2005: Doubt is their product. Scientific American, 292 (6), 96…101. Morgan, M. G., and M. Henrion. 1990: Uncertainty -- a guide to dealing with uncertainty in quantitative risk and policy analysis. Cambridge: Cambridge University Morgan, M. G. Characterizing and Dealing With Uncertainty: Insights from the Integrated Assessment of Climate Change. Integrated Assessment 13, 2003, 4 (1), 46…Moss, R.H. and Schneider, S.H., 2000: Uncertainties in the IPCC TAR: Recommendations to lead authors for more consistent assessment and reporting. In: Guidance Papers on the Cross Cutting Issues of the Third Assessment Report of the IPCC [eds. R. Pachauri, T. Taniguchi and K. Tanaka], World Meteorological Saltelli A, Chan K, Scott M. Sensitivity Analysis. John Wiley & Sons Publishers; Slovic, P.; Fischhoff, B.; Lichtenstein, S., 1981: Perceived Risk: Psychological Factors and Social Implications, in: Proceedings of the Royal society of London. Ser. A, mathematical and physical sciences, Volume: 376, Issue: 1764 (April 30, 1981), Slovic, P.; Fischhoff, B.; Lichtenstein, S., 1984: Behavioral Decision Theory Perspectives on Risk and Safety; Acta psychologica, Volume: 56, Issue: 1-3 (August Vaessen, A., forthcoming, Omgaan met onzekerheden in adviesrapporten; een analyse van het verwerkingsgedrag van beleidsmakers. Dissertation Technical University Vaessen, A., M.G.M. Elling, 2000: Selectief leesgedrag van beleidsmakers bij het lezen van adviesrapporten. In: Over de grenzen van de taalbheersing. Onderzoek naar Uitgevers, Den Haag, p. 453-466. ISBN: 90 12 08994 8. Van Asselt, M. B. A., Langendonck, R., van Asten, F., van der Giessen, A., Janssen, P., Heuberger, P., and Geuskens, I., 2001: Uncertainty & RIVM's Environmental Outlooks. Documenting a learning process, ICIS/RIVM, Maastricht/Bilthoven, The Van der Sluijs, J.P. (2005), Uncertainty as a monster in the science policy interface: Van der Sluijs, J.P. (2007), Uncertainty and Precaution in Environmental Management: Insights from the UPEM conference, Van der Sluijs, J.P., J.S. Risbey, P. Kloprogge, J.R. Ravetz, S.O. Funtowicz, S.Corral Quintana,  Guimarães Pereira, B. De Marchi, A.C. Petersen, P.H.M. Janssen, R. Hoppe, and S.W.F. Huijs, 2003: RIVM/MNP Guidance for Uncertainty Assessment and Communication: Detailed Guidance Utrecht University & RIVM. Van der Sluijs, J.P, P.H.M. Janssen, A.C. Petersen, P. Kloprogge, J.S. Risbey, W. Tuinstra, M.B.A. van Asselt, J.R. Ravetz, 2004. RIVM/MNP Guidance for Uncertainty Assessment and Communication: Tool Catalogue for Uncertainty Assessment Utrecht University & RIVM. Many people contributed … directly or indirectly … to the development of this report, him, Peter Janssen and Johan Melse (MNP) proved very valuable for shaping the We very much appreciate the input of the participants of and contributors to the international expert workshop on uncertainty communicationof this project), which provided us with a long list of interesting issues to tackle. We would further like to thank all the participants of the communication experiments. Their input led to valuable insights in the process of uncertainty communication. We thank Eltjo Buringh and Mark van Oorschot (MNP) who delivered substantial input for the contents and set up of the communication experiments in the Utrecht Policy We thank all the reviewers of an earlier version of this report for their comments and suggestions, especially Peter Janssen, Anton van der Giessen, Mark van Oorschot, Jerry Ravetz, Charles Weiss, Jean-Marc Douguet and Annemarie Vaessen. Finally we would like to mention here that the sections regarding communication in the detailed Guidance, and the use of the concept of PDI for communication of uncertainty information were mainly based on the ideas of Ângela Guimarães Pereira, Serafin Corral Quintana and Silvio Funtowicz. Their ideas have been built further These were: Matthieu Craye (European Commission Joint Research Centre), Bruna De Marchi (Institute of International Sociology of Gorizia, Italy), Suraje Dessai (Tyndall Centre for Climate Anglia, UK), Annick de Vries (University of Twente, The Netherlands), Silvio Funtowicz (European Commission Joint Research Centre), Willem Halffman (University of Twente, The Netherlands), Matt Hare (Seecon Deutschland, Germany), Peter Janssen (MNP, The Netherlands), Penny Kloprogge (Utrecht University, The Netherlands), Martin Krayer von Krauss (Technical University of Denmark, Denmark), Johan Melse (MNP, The Netherlands), Anthony Patt (Boston University, USA), Ângela Guimarães Pereira (European Commission Joint Research Centre), Arthur Petersen (MNP, The Netherlands), Jeroen van der Sluijs (Utrecht University, The Netherlands), Hans Visser (MNP, The Netherlands), Arjan Wardekker (Utrecht University, The University, USA), Robert Willows (UK Environment Agency, UK) UncertaintyCommunicationIssuesandgoodpracticePennyKloprogge,JeroenvanderSluijsandArjanWardekker