PPT-Exhibit 1:Summary Table Summary
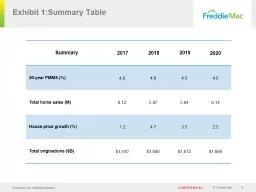
2017 2018 2019 2020 30year PMMS 40 46 45 48 Total home sales M 612 597 594 614 House price growth 72 47 35 25 Total originations B 1810 1646
Download Presentation
"Exhibit 1:Summary Table Summary" is the property of its rightful owner. Permission is granted to download and print materials on this website for personal, non-commercial use only, provided you retain all copyright notices. By downloading content from our website, you accept the terms of this agreement.
Presentation Transcript
Transcript not available.