/
Market prices and  the cost of nutritious diets: Market prices and  the cost of nutritious diets:

Market prices and the cost of nutritious diets: - PowerPoint Presentation

tatiana-dople
tatiana-dople . @tatiana-dople
Follow
350 views
Uploaded On 2018-11-08

Market prices and the cost of nutritious diets: - PPT Presentation

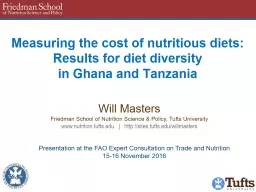
New price indexes to measure food system change Will Masters amp Robel Alemu Friedman School of Nutrition and Department of Economics Tufts University Advancing Research on Nutrition and Agriculture ARENA ID: 722775

amp food price cost food amp cost price indexes data measure diet system nutrient results change applications methods cases

Share:

Link:

Embed:

Download Presentation from below link

Download Presentation The PPT/PDF document "Market prices and the cost of nutritiou..." is the property of its rightful owner. Permission is granted to download and print the materials on this web site for personal, non-commercial use only, and to display it on your personal computer provided you do not modify the materials and that you retain all copyright notices contained in the materials. By downloading content from our website, you accept the terms of this agreement.


Presentation Transcript

Slide1

Market prices and the cost of nutritious diets: New price indexes to measure food system change

Will Masters & Robel AlemuFriedman School of Nutrition and Department of Economics, Tufts University

Advancing Research on Nutrition and Agriculture (ARENA)

pre-conference workshop at ICAE, 28 July 2018

http://sites.tufts.edu/willmasters | https://sites.tufts.edu/candasaSlide2

With rapid change in food environments, is the overall cost of nutritious dietseasier to buy, or further out of reach?Slide3

Existing food price indexes are weighted by market value and say little about nutritionFor global commodity prices, the FAO Food Price Index consists of five commodity group price indices, weighted with average export shares of each of the groups for 2002-2004.

Total of 23 commodities (73 prices), in 5 groups: Cereals

-- wheat (11), maize (1), rice (16)Oils/Fats

-- soybean, sunflower, rapeseed, groundnut, cottonseed, copra, palm kernel, palm, linseed, castor (1 each)Dairy-- whole milk powder, skim milk powder, cheese (2 each), cheese (1)

Meat-- poultry (13), beef (7), pork (6), sheep (1)

Sugar

-- sugar (1)

World food commodity prices, 2015-2018

Source:

www.fao.org/worldfoodsituation

, 21 July 2018

New price indexes to measure food system change

motivation

| data | methods & results | use cases & applications | conclusionSlide4

For foods actually consumed, a very long historyFleetwood (1707) food price index = 5 ‘quarters’ of wheat, 4 ‘hogsheads’ of beer

Lowe (1823) different baskets for different socioeconomic groupsJevons (1865), Laspeyres (1871) and many others lead to modern CPIFor affordability of dietary energy

, a long history and wide usePlayfair (1821) chart of wheat prices and wages from 1565 to 1821

Sukhatme (1961) and FAO’s Prevalence of Undernourishment in caloriesDrewnowski (2004) measure of energy cost ($/kcal) and density (kcal/kg)For nutrient adequacy, more recent history and many specific uses

Stigler (1945) linear programming to compute least-cost diets USDA Thrifty Food Plan for US nutrition assistance (1975, 1983, 1999, 2006)

SCUK

Cost of Diet tool

(2009) and FANTA et al.

Optifood

(2012) for aid programs

For next steps, we introduce three new concepts:

A nutritionally-weight price index (using nutrient profile scores, from 1 to 100)A cost of diet diversity

index (at least one from each of at least 5 food groups)A cost of recommended diets index (with quantities from local dietary guidelines)

Measuring diet cost has a long history

New price indexes to measure food system change

motivation

| data | methods & results | use cases & applications | conclusionSlide5

We introduce four kinds of indicatorsto add up the cost of foodsin terms of their nutritional

valuesUnit-free indexes that track change over time

Nutritious-food Price Index (NPI)Weight prices by

profile scores, instead of expenditure shares as in CPICost of Diet Diversity (CoDD)Uses least-cost food from the lowest-cost

food groups to reach MDD-WCost-per-day values that specify quantities neededCost of a Recommended Diet (

CoRD

):

weights each price by quantities in the

recommended

diet

Cost of Nutrient Adequacy (

CoNA

):the least-cost combination of foods to meet

nutrient requirementsApplications reveal their advantages and disadvantages for policy analysis, program management, and research

New price indexes to measure food system change

motivation

| data | methods & results | use cases & applications | conclusionSlide6

The price of each food depends on where and when it is bought

Food away from home (restaurants etc.)

Food at home

(groceries)Processed food & feed

Unprocessed food and feed

Source: US. Bureau of Labor Statistics, downloaded 21 July 2018.

Definitions and chart data are available at http://myf.red/g/kAoD

Retail prices

Wholesale prices

Local food prices in t

he

United States, 1970-2018 (index values, 1982=100)

New price indexes to measure food system change

motivation |

data

| methods & results | use cases & applications | conclusionSlide7

Several types of food price data are available

Ghana MoFA enumerator collecting food price data

Market information & price monitoring

National accounts & poverty monitoring

Actor

Agricultural & food agencies

Financial & statistical agencies

Purpose

Inform farmers, traders, distributors

Measure real income, inflation, poverty

Products

Traded commodities, often a few key staple foods and cash crops at wholesale markets

Retail products, often a long list of over 50 standardized items from urban supermarkets

Access

Individual prices may be available upon request; Private sources charge for subscriptions

Aggregate indexes reported annually,

quarterly or monthly; Item-level prices are sometimes confidential

Photo: Anna Herforth, 2017

All countries use food prices for their CPI

Many also collect food prices for an MIS

Sources differ in food lists and data quality

New price indexes to measure food system change

motivation |

data

| methods & results | use cases & applications | conclusionSlide8

Cereals

White R&T

Plantain

Pulses Nuts and Seeds

DGLVSeed Oil

Maize

Yam

Plantain

Cowpea

Groundnut

Nkontommire

Coconut oil

Millet

Cocoyam


Soya bean

Groundnut (red)

Jute mallow

Palm oil

Sorghum

Cassava


Bambara

Melon Seeds

Alefu

(Amaranthus)

Groundnut oil

Rice

Gari


Sweet potato


Cassava dough


Dried cassava


Meat, Poultry and Fish

Vegetables

Fruits

Egg

Dairy

Beef TomatoMangoEgg Fresh Cow MilkPorkGarden EggPineappleSalted dried fishOkroPalm fruitLive chicken birdOnionWatermelonSmoked herringGingerOrangeAnchovyPepper BananaFresh fishCabbageCoconutChicken meatLettuceAvocadoSnailCarrotPawpawGoat meatMutton

Ghana’s MoFA market price reports will soon include the additional foods marked in red, for 20 major markets

IANDA (2015-17) helped Ghana MoFA expand price monitoring to more foods

For nutritious diets, need diverse foods’ prices

New price indexes to measure food system change

motivation |

data

| methods & results | use cases & applications | conclusionSlide9

Standard food CPI:fCPI = ∑

ipiw

i , where

pi and w

i are prices and weights in consumer spending

weights each price by quantities actually chosen

Nutritious-food PI (NPI):

NPI = ∑

i

p

i

n

i

, where

n

i is a nutrient score,

eg

NuVaL

from 1 (worst) to 100 (best)

weighting each expense by its nutritional value

Nutrition scores aim to guide food choices

We use them to measure whether more nutritious foods are becoming

more or less affordable

To add up diverse foods, we can use

nutrient profile scores (NuVal, NRF, SENS etc.)

We can use nutritional value instead of expenditure weights in a CPI

New price indexes to measure food system change

motivation

| data |

methods & results

| use cases & applications | conclusionSlide10

A nutritious-food price index reflects a specific nutrition scoring system

Ghana Statistical Service CPI weights (food expenditure shares) versus NuVal scores (Nutritional Value index)

CPI weights

NuVal weights

Food

100

100

Cereals and cereal products

25.55

19.43

Meat and meat products

9.10

8.55

Fish and sea food

22.93

14.12

Milk, cheese and eggs

4.33

5.50

Fruits

4.29

14.64

Vegetables

23.36

32.67

Oils and fats

5.19

0.86

Sugar, jam, honey, chocolate & confectionery

2.29

0.24

Mineral water, soft drinks, fruit &vegetable juices

3.57

0.45

Food products

n.e.c

.

1.95

2.45

Non-alcoholic beverages

5.57

2.50

Coffee, tea and cocoa

2.002.05Nutritional value > consumer spendingNutritional value < consumer spending

Used to measure real income & poverty(food as a whole is 42% of CPI)Could use to measure nutritional valueNew price indexes to measure food system changemotivation | data | methods & results | use cases & applications | conclusionSlide11

In Ghana, have more nutritious foods

become more expensive than other foods?

Food Price Indexes in Greater Accra, 2012-2017

Food Price Indexes in Tamale, 2012-2017

Prices of more nutritious foods

rose

less

than prices of other foods

...but in Tamale from 2012 to 2014, the opposite occurred

Source: Author’s calculation, from Ghana Statistical Service file data.

New price indexes to measure food system change

motivation

| data |

methods & results

| use cases & applications | conclusionSlide12

Another metric of diet quality is

diversity

We follow the MDD-W

MDD-W is defined as ≥ 5 of these 10 food groups in past 24

hrs

(1)

Starchy staples

(Grains, white roots/tubers, plantains)

(2)

Pulses

(beans, peas and lentils – includes soybeans)

(3)

Nuts and seeds

(higher fat than pulses, includes groundnuts)(4) Flesh foods

(meat, poultry and fish)

(5)

Dark green leafy vegetables(6) Other vitA

-rich fruits & vegetables

(7)

Other vegetables

; (8)

Other fruits

; (9)

Eggs

; (10)

Dairy

New price indexes to measure food system change

motivation

| data |

methods & results

| use cases & applications | conclusionSlide13

We can measure the cost of reaching MDD-W with the least-cost food in each groupMDD-W has a direct economic interpretationWithin groups, all foods are equal substitutes

Each group meets different needs, and also contributes to energy balanceGroups can be ranked by cost towards total daily energy balancePeople with at least five groups are likely to reach adequacy thresholds

Cost of Diet Diversity (

CoDD

):

CoDD

= Min5{min{

p

i1

}, min{

p

i2

}, …, min{

p

im

}}

the least-cost way to include at least one food from at least 5 food groups

CoDD2 = Ave{min{

p

i1

}, min{

p

i2

}, …, min{

p

im

}}

the least-cost way to include at least one food from

any

5 of the 10 food groups

The cost of reaching MDD-W can be defined as:

New price indexes to measure food system change

motivation

| data |

methods & results

| use cases & applications | conclusionSlide14

1.Maize or cassava

Foods counted for the Cost of Diet Diversity (CoDD) in Ghana, 2009-14

2.Soya

3.Groundnuts

4.Mangoes

5.Fish or banana

In Ghana, foods in the five lowest-cost groups are:

The least-cost food in each group may vary

Source: Masters et al., (2018), “

Measuring the Affordability of Nutritious Diets in Africa: Price Indexes for Diet Diversity and the Cost of Nutrient Adequacy

“. 

AJAE,

forthcoming.

New price indexes to measure food system change

motivation

| data |

methods & results

| use cases & applications | conclusionSlide15

1.Maize

2.Soya

3.Groundnuts

4.Beef

5.Avocado

In Tanzania, each food group varies differently over time

Foods counted for the Cost of Diet Diversity (

CoDD

) in Tanzania, 2011-15

Each food group may have

different trends and fluctuations

Source: Masters et al., (2018), “

Measuring the Affordability of Nutritious Diets in Africa: Price Indexes for Diet Diversity and the Cost of Nutrient Adequacy

“. 

AJAE,

forthcoming.

New price indexes to measure food system change

motivation

| data |

methods & results

| use cases & applications | conclusionSlide16

To measure cost levels (e.g. $/day), we can use the Cost of a Recommended Diet (CoRD)Traditional food CPI

Nutritious-food CPI (NPI)Cost of Diet Diversity (CoDD)

The previous indexes are unit-free, to measure

change over time

Cost of a Recommended Diet (

CoRD

):

CoRD

= ∑

j

p

ij

q

j

, where

p

ij

= min{

p

ij

} and

q

j

= requirement for

j

={1,…, m} categories

 weights each price by quantities in the recommended

diet,

lowest-cost only

CoRD2 = ∑

j

p

ij

q

j

, where

p

ij

=

median

{

p

ij

} and qj = requirement for j={1,…, m} categories  weights each price by quantities in the recommended diet, all foods equallyWe measure total cost by specifying quantities consumedNew price indexes to measure food system changemotivation | data | methods & results | use cases & applications | conclusionSlide17

The Cost of a Recommended Diet (CoRD) reflects specific dietary guidelines

In Africa, the only countries with dietary guidelines are Benin, Sierra Leone, Nigeria, Namibia, and South Africa (+Kenya soon)

Cost per serving for lowest-cost

item in each food group (Ghana, 2015)

Guidelines specify

the number of servings in

each group

Cost/serving (PPP US$/item)

Ghana prices not available for dairy

Source: Author’s calculation, from Ghana Ministry of Food and Agriculture (

MoFA

) file data.

New price indexes to measure food system change

motivation

| data |

methods & results

| use cases & applications | conclusionSlide18

The Cost of a Recommended Diet (CoRD) depends on which foods are used

Cost per day for a recommended diet, median of all items (Ghana, 2015)

Cost per day (2011 US$ in PPP terms)

With the median item in each food group

(except dairy), total cost would be US$1.37/day

Ghana price data include several high-cost vegetables and protein foods, so those groups can be very expensive

Source: Author’s calculation, from Ghana Ministry of Food and Agriculture (

MoFA

) file data.

New price indexes to measure food system change

motivation

| data |

methods & results

| use cases & applications | conclusionSlide19

The Cost of a Recommended Diet (CoRD) depends on price and quantity per day

Cost per day (2011 US$ in PPP terms)

Cost per day for a recommended diet, lowest-cost items only (Ghana, 2015)

With the lowest-cost items in each food group (except dairy), total cost would be US$0.75/day

The required portions from each food group cost between $0.15 and $0.25 per day

Source: Author’s calculation, from Ghana Ministry of Food and Agriculture (

MoFA

) file data.

New price indexes to measure food system change

motivation

| data |

methods & results

| use cases & applications | conclusionSlide20

The Cost of Nutrient Adequacy (CoNA) is a “least-cost diet” using foods that reach EARs at lowest cost:

Minimize C = Σip

iq

i Subject to a

ij q

i

>

EAR

j

, for j = 1,…, 17 essential nutrients

and

aie

q

i

=

E

, for energy

where

p

i

is price and

q

i

is quantity of food

i

,

and

a

ij

is its content in nutrient

j

, for which

EAR

j

is the Estimated Average Requirements for adult women aged 19-30, not pregnant or lactating, at 55 kg with energy use (E) of 2000 kcal/day

We focus on total cost

Disaggregated by food groups, to show diet composition

Disaggregated by nutrients, valued at their shadow prices

The most widely-used gold standard for diet quality remains nutrient adequacyNew price indexes to measure food system changemotivation | data | methods & results | use cases & applications | conclusionSlide21

In Ghana, the cost of buying sufficient nutrients rose from 2010 to 2014, largely because vitamin-A rich F&V (e.g. mango) became more expensive

Source: Masters et al., (2018), “Measuring the Affordability of Nutritious Diets in Africa: Price Indexes for Diet Diversity and the Cost of Nutrient Adequacy

“.  AJAE, forthcoming.

In the Ghana data, vitamin A is very expensive

Cost of Nutrient Adequacy (CoNA) in Ghana, by food group

New price indexes to measure food system change

motivation

| data |

methods & results

| use cases & applications | conclusionSlide22

Cost of Nutrient Adequacy (CoNA) in Ghana, by limiting nutrient

In Ghana, the limiting nutrient whose cost has risen is mainly vitamin A, but the cost of meeting calcium requirements has also risen

Source: Masters et al., (2018), “

Measuring the Affordability of Nutritious Diets in Africa: Price Indexes for Diet Diversity and the Cost of Nutrient Adequacy“.  AJAE, forthcoming.

In Ghana, limiting nutrients after vitamin A are energy, calcium, vitamin E & vitamin B12

New price indexes to measure food system change

motivation

| data |

methods & results

| use cases & applications | conclusionSlide23

Cost of Nutrient Adequacy (CoNA) in Tanzania, by food group

In Tanzania, there was some rise in CoNA during 2011-12, with many different food groups playing important rolesSource: Masters et al., (2018), “

Measuring the Affordability of Nutritious Diets in Africa: Price Indexes for Diet Diversity and the Cost of Nutrient Adequacy“.  AJAE,

forthcoming.

In the Tanzania data, more different foods sometimes enter the least-cost diet

New price indexes to measure food system change

motivation

| data |

methods & results

| use cases & applications | conclusionSlide24

In Tanzania, there was some rise in CoNA during 2011-12, with many different nutrients as limiting factors

Source: Masters et al., (2018), “Measuring the Affordability of Nutritious Diets in Africa: Price Indexes for Diet Diversity and the Cost of Nutrient Adequacy“.  AJAE, forthcoming.

Cost of Nutrient Adequacy (CoNA) in Tanzania, by limiting nutrient

In Tanzania, limiting nutrients are

same as Ghana, plus vitamin C & folate

New price indexes to measure food system change

motivation

| data |

methods & results

| use cases & applications | conclusionSlide25

Note: Data shown are coefficient and 95% confidence interval on calendar month indicators, relative to May. Orange bars for cost of calorie adequacy (

CoCA) not significantly different from zero. 25

Source: Bai, Naumova

and Masters (2018), Seasonality in Food Prices and the Cost of a Nutritious Diet in Tanzania. Working paper, forthcoming.Monthly variation in cost of nutrient adequacy vs daily energy in Tanzania, 2011-15

Application #1: Seasonality in the cost of nutritious diets vs. cost of daily energy

2011 US dollars per day

Nutrient costs are more seasonal due

to both storage and transport

New price indexes to measure food system change

motivation

| data | methods & results |

use cases & applications

| conclusionSlide26

26

Source: Bai, Naumova and Masters (2018), Seasonality in Food Prices and the Cost of a Nutritious Diet in Tanzania. Working paper, forthcoming.

Harmonic regression results for cost of nutrient adequacy in Tanzania, 2011-15

2011 US cents per day

Application #1: Seasonality in diet costs

can be summarized by a single variable

Harmonic regression reveals both magnitude and timing of peak costs

New price indexes to measure food system change

motivation

| data | methods & results |

use cases & applications

| conclusionSlide27

Source: Sarpong, Bai, Mishili and Masters (2018), Impacts of Agricultural and Trade Policy on the Cost of Nutritious Diets in Ghana and Tanzania. Framework paper for AERC AFPON project, forthcoming.

Impact on cost of nutrients of 10% price reductions by food group in Ghana, 2011-15

Application #2: Ghana’s PFJ program could have more impact if it included F&V

Base case (actual prices)

Starchy staples only

Pulses, nuts & seeds only

Animal sourced foods only

Fruits & vegetables

In reality, Ghana’s

“Planting for Food and Jobs” program excludes

fruits and vegetables

New price indexes to measure food system change

motivation

| data | methods & results |

use cases & applications

| conclusionSlide28

Source: Sarpong, Bai, Mishili and Masters (2018),

Impacts of Agricultural and Trade Policy on the Cost of Nutritious Diets in Ghana and Tanzania. Framework paper for AERC AFPON project, forthcoming.Impact on cost of nutrients of 50% s.d.

reductions by food group in Tanzania, 2009-14

Application #2: Tanzania’s marketing policies could reduce disparities in cost of nutrients by targeting pulses, nuts & seeds

Base case (actual prices)

Starchy staples only

Pulses, nuts & seeds only

Animal sourced foods only

Fruits & vegetables

Our whole-of-diet approach reveals how improvements in one food group

leads other groups

to become binding constraint

New price indexes to measure food system change

motivation

| data | methods & results |

use cases & applications

| conclusionSlide29

Conclusions and next stepsWe provide economic price indexes corresponding to nutritionists’ definitions of a healthy diet:Nutrient profile scores for individual foods, modifying CPI to calculate

NPIMinimum recommended diets, using dietary guidelines to calculate CoRDMinimum dietary diversity levels, using MDD-W to calculate CoDD

Minimum (and max.) nutrient levels, using DRIs to calculate CoNA

For research, the gold standard remains nutrient adequacyInitial applications include:Seasonality in the added cost of nutrient adequacy over daily energyPolicy-induced changes in average levels and also disparities in diet costInternational differences associated with national income and urbanization

For policy and programs, simpler measures are useful tooGhana Statistical Service (GSS) and Min of Food & Ag (MoFA) officials intend to add NPI and

CoRD

to their monthly reports

New price indexes to measure food system change

motivation

| data | methods & results | use cases & applications |

conclusionSlide30

Thank you!

The CANDASA project is funded by UKAid and the Bill & Melinda Gates Foundation (OPP1182628). It is implemented at Tufts and IFPRI in Washington, Delhi and Addis, with academic partners in Ghana, Tanzania, and Malawi, and includes collaborations with ARENA, AFPON, and the ANH Academy.

Software tools will be published on the

Gates Open Research platform, and also available on the project website at http://sites.tufts.edu/candasa

Photo: Anna Herforth, 2017

Special thanks to all price enumerators

New price indexes to measure food system change

motivation

| data | methods & results | use cases & applications | conclusion