/
Status of hares in Ireland- Hare Survey of Ireland 2006/07 Status of hares in Ireland- Hare Survey of Ireland 2006/07

Status of hares in Ireland- Hare Survey of Ireland 2006/07 - PDF document

tatiana-dople
tatiana-dople . @tatiana-dople
Follow
471 views
Uploaded On 2016-06-11

Status of hares in Ireland- Hare Survey of Ireland 2006/07 - PPT Presentation

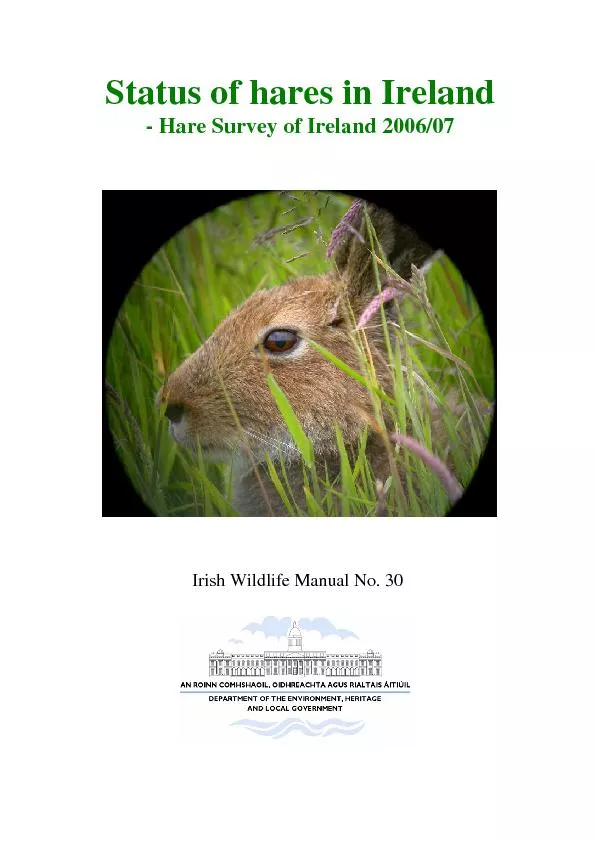
Irish Wildlife Manual No 30 Status of hares in IrelandHare Survey of Ireland 200607Neil Reid Karina Dingerkus W Ian Montgomery Ferdia Marnell RebeccaJeffrey Deirdre Lynn Naomi Kingston Robb ID: 357254

Irish Wildlife Manual No. 30 Status

Share:

Link:

Embed:

Download Presentation from below link

Download Pdf The PPT/PDF document "Status of hares in Ireland- Hare Survey ..." is the property of its rightful owner. Permission is granted to download and print the materials on this web site for personal, non-commercial use only, and to display it on your personal computer provided you do not modify the materials and that you retain all copyright notices contained in the materials. By downloading content from our website, you accept the terms of this agreement.


Presentation Transcript

Status of hares in Ireland- Hare Survey of Ireland 2006/07 Irish Wildlife Manual No. 30 Status of hares in IrelandHare Survey of Ireland 2006/07Neil Reid, Karina Dingerkus, W. Ian Montgomery, Ferdia Marnell, RebeccaJeffrey, Deirdre Lynn, Naomi Kingston & Robbie A. McDonald1,3Quercus, School of Biological Sciences, Queen's University Belfast, Medical Biology Centre(MBC), 97 Lisburn Road, BELFAST. BT9 7BL. Northern Ireland. http://www.quercus.ac.uk National Parks & Wildlife Service (NPWS), Department of Environment, Heritage & LocalGovernment (DOEHLG), 7 Ely Place, DUBLIN 2, Republic of Ireland. http://www.npws.ie/ Central Science Laboratory, Sand Hutton, YORK. YO41 1LZ, England. http://www.csl.gov.uk/ Citation :Reid, N., Dingerkus, K., Montgomery, W.I., Marnell, F., Jeffrey, R., Lynn, D., Kingston, N.& McDonald, R.A. (2007) Status of hares in Ireland. Irish Wildlife Manuals, No. 30.National Parks and Wildlife Service, Department of Environment, Heritage and LocalGovernment, Dublin, Ireland.Cover photo: Irish hare (© Neil Reid)Irish Wildlife Manuals Series Editors: F. Marnell & N. Kingston© National Parks and Wildlife Service 2007ISSN –1393 - 6670 Hare Survey of Ireland 2006/07 Executive summaryThe Irish hare (Lepus timidus hibernicus) is an endemic sub-species of mountain hare and is the focus of an All-Ireland Species Action Plan. The Irish Government isrequired to report on the status of Irish hares under the EC Habitats Directive. Quercusundertook a survey for the National Parks and Wildlife Service in order to report on thecurrent and historical status of hares and to formulate recommendations for monitoring.Historical game bag data suggest that the Irish hare population is likely to have beenconsiderably larger during the mid-19th to early 20th century than at present. Sincethen, there has been a substantial decline in the number of hares shot per year. Similarhunting data from Britain and Europe are accepted as evidence of the historical declineof hare populations. Game bags show marked fluctuations and multiannual periodicityin Irish hare populations. Intrinsic density dependence and extrinsic climatic effectsinfluence the scale and period of fluctuations. Coursing records mainly reflect changesin practice, but with information on capture effort, they may be suitable for monitoringchanges in hare numbers.Quercus staff and �80 NPWS personnel surveyed 691 1km squares across Irelandduring 2006 and 2007. To estimate hare densities, novel distance samplingapproaches were developed to account for non-uniform distribution of animals withrespect to distance from roads. Here, we demonstrate the importance of accountingfor this bias when designing and analysing hare surveys.Assuming that the survey areas were representative and stratifying data analysis byregion, the spring density of Irish hares in the Republic of Ireland was estimated to be3.33 hares/km2 in 2006 and 7.66 hares/km2 in 2007. Multiplying density estimates byland area, the population of Irish hares in the Republic of Ireland was approximately233,000 hares in early 2006 and 535,000 in early 2007. The scale of this marked andsignificant change between consecutive years is consistent with historical data and withrecent surveys of Northern Ireland. Approximately 50% and 70% of the Irish harepopulation were found on pastoral farmland in 2006 and 2007 respectively. The bulk ofchange in population estimates between years was ascribed to an increase in densityon pastoral farmland.No records of brown hares were confirmed during the survey, suggesting that this non-native and potentially invasive species is mostly, if not entirely, restricted to NorthernIreland.We make several recommendations:1. The aim of future monitoring should be clarified prior to the adoption of a particularsurvey strategy as there are major implications for cost and analytical complexity;a. If the main aim is to produce accurate estimates of density, a custom Distancesampling approach similar to that developed here is essential.b. If the main aim is to establish temporal trends in population change, repeatedcounts of relative abundance with standardised effort will provide an index ofchange in numbers over time.c. Annual counts supplemented with the intermittent collection of distance datacould be analysed to establish temporal trends punctuated with referencepoints of estimated density.2. A pilot investigation should be undertaken to establish to what extent annualcoursing records supplemented with capture effort data could contribute to a lowcost monitoring strategy.3. Better understanding of the drivers of population change, particularly on pastoralfarmland, is required. Hare Survey of Ireland 2006/07 Contents Executive summary 3 1.0General Introduction 5 2.0Historical data analysis 7 2.1Introduction 7 2.2Game bag records 8 2.3Coursing records 19 3.0Hare Survey of Ireland 2006/07 25 3.1Introduction 25 3.2Methodology 27 3.3Results 32 3.4 Discussion 45 4.0General Discussion 48 5.0Recommendations 49 6.0Acknowledgements 509 7.0References 50 8.0Appendices 59 Hare Survey of Ireland 2006/07 1General introductionThe Irish hare (Lepus timidus hibernicus Bell, 1837) is an endemic sub-species of themountain hare (L. timidus Linnaeus, 1758) and is the only native lagomorph in Ireland(Fairley, 2001; Hamill, 2001). Both the rabbit (Oryctolagus cuniculus Linnaeus, 1758)and the brown hare (Lepus europaeus Pallas, 1778) have been introduced (Hayden &Harrington, 2000; Fairley, 2001).The relationship between the Irish hare and other mountain hare subspecies remainssomewhat unclear (Alves et al., 2003; Thulin, 2003). Recent evidence (Hamill et al2006) indicates that the Irish hare is more closely related to mountain hare populationsin mainland Europe than its geographically closest neighbour, the Scottish hare (Lepustimidus scoticus Hilzheimer, 1906). Furthermore, levels of genetic diversity within Irelandmay suggest that the Irish hare may warrant full species status (Hughes et al. 2006).Irish hares are larger than other mountain hares (4.5kg), possessing a darker pelt thatis often distinctly russet in colour and does not turn fully white in winter (Barrett-Hamilton, 1910; Fairley, 2001). Its ears are relatively small and rounded and its tail ispredominately white (Barrett-Hamilton, 1910; Fairley, 2001). Mountain hares elsewhereinhabit high mountains, boreal forest and tundra (Thulin, 2003). However, in Ireland theIrish hare is distributed from the inter-tidal zone (Wolfe, Whelan & Hayden, 1996) tomountain summits (Walker & Fairley, 1968).Whilst remaining widespread (Fig. 1), the status of the Irish hare has attracted concernfollowing a population decline in Northern Ireland (Dingerkus & Montgomery, 2002).Recent studies in Northern Ireland suggest short-term population fluctuations are thenorm (O’Mahony & Montgomery, 2001; Dingerkus & Montgomery, 2002; Preston et al.2003; Tosh et al. 2004; Tosh et al. 2005; Hall-Aspland et al. 2006). In the Republic ofIreland, some anecdotal evidence suggests a decline in hare populations (Anon, 2005).The Irish hare has been legally protected since 1930 in the Republic of Ireland, initiallyunder the Game Preservation Act (1930), more recently by the Wildlife Act (1976) andWildlife (Amendment) Act (2000). It is listed on Appendix III of the Berne Convention(Anon, 1979), Annex V(a) of the EC Habitats Directive (92/43/EEC) and is listed as aninternationally important species in the Irish Red Data Book (Whilde, 1993). The ECHabitats Directive requires member states to “maintain or restore [mountain hares] tofavourable conservation status”, necessitating “surveillance” of the population andencouraging scientific research.Due to its phylogenetic status, distinct morphology and ecology and its cultural valuethe Irish hare is considered to have intrinsic value. This, in combination with its legalstatus and suggestions of a population decline, led to the formulation of an Irish hareAll-Ireland Species Action Plan (SAP). This aims to maintain the existing range of Irish Hare Survey of Ireland 2006/07 hares in Ireland, demonstrate a population increase by 2010 and maintain and increasethe area and quality of suitable hare habitat (Anon, 2005).Specifically, the aims of the current project were to:i) Establish the current distribution of the Irish hare in the Republic of Ireland.ii) Provide estimates of density of hares according to land class andgeographic regions.iii) Provide the basis for future monitoring of the conservation status of theIrish hare.iv) Establish the current distribution of the brown hare in the Republic ofIreland.This project helps fulfill requirements of the EC Habitats Directive in respect ofsurveillance (Article 11), the assessment of compatibility with exploitation (Article 14)and the promotion of research (Article 18). In turn this information will assist in thedemonstration, maintenance and/or restoration of the hare population to “favourableconservation status” (Article 2). Furthermore, the current study partly fulfils section5.3.1 of the Irish hare All-Ireland Species Action Plan which seeks to “develop astrategy for the conservation and monitoring of the Irish hare” and addresses section5.5.2 which requires a “base-line survey to determine the current population… in theRepublic of Ireland by 2007”. Furthermore, in relation to section 5.5.5 of the SAP, thiswork assesses “the status of the brown hare”.Fig. 1 Distribution of Irish hare detections during badger and habitat surveys from 1989-1993.The species has a widespread distribution throughout Ireland. Data extracted from Feore (1994)and Smal (1995). Hare Survey of Ireland 2006/07 2Historical data analysis2.1IntroductionAgricultural intensification is widely accepted to be the cause of the decline in manyEuropean farmland wildlife populations (Donald, 1998; Wilson et al. 1999; Preston etal. 2002), including hares (Smith et al. 2004; Smith et al. 2005). Successfulmanagement of wildlife populations and implementation of conservation strategies fordeclining species rely on knowledge of their population dynamics, achieved by long-term assessment of their abundance or density (Langbein et al. 1999). However,relatively few data exist on the historical status of the Irish hare.Game bag time-series have been used to derive indices of hare abundance elsewhere(Strandgaard & Asferg, 1980; Tapper & Parsons, 1984; Tapper, 1987; Smith et al2005) illustrating declines in populations and regional differences in the timing ofdeclines. In Great Britain, the National Gamebag Census was established in 1961and has been used to monitor brown hare populations in the UK (Tapper & Parsons,1984; Tapper, 1992). Elsewhere total catches from clearance netting or driven countshave also been used as hare census methods (Abildgård et al., 1972; Pépin, 1985).Recent primary surveys (O’Mahony & Montgomery, 2001; Dingerkus & Montgomery,2002; Preston et al. 2002; Tosh et al. 2004; Tosh et al. 2005; Hall-Aspland et al. 2006)suggest that Irish hare populations, in common with hare populations elsewhere,exhibit a considerable degree of interannual fluctuation (Krebs et al. 2001; Kauhala,2005), making interpretation of short-term population changes difficult. The scarcity oflong term historical data hampers efforts to assess the significance of recentlyobserved population change.Here we present an analysis of shooting records from Irish estates and netting recordsfrom the Irish Coursing Club with the aim of describing long term and recent trends inthe Irish hare population. Hare Survey of Ireland 2006/07 2.2Game bag records2.2.1IntroductionHares are an important game species throughout much of Europe and game estatesoften recorded the number taken in each shooting season. The collection of gamebag records was formalised in Great Britain by The Game Conservancy’sestablishment of the National Gamebag Census and its subsequent use to describechanges in long-term, time-series of brown hare populations (Tapper & Parsons,1984; Tapper, 1992). It has been suggested that changes to game legislation in thelate 1800s coupled with agricultural intensification and changes to land managementpractises during the early 1900s initiated brown hare population declines (Matheson,1941; Tapper & Parsons, 1984; Hutchings & Harris, 1993) in England during the early20th century (Fig. 2). Hare populations continued to decline, not just in Britain butacross Europe, throughout the late 20th century (Smith et al., 2004).Long-term studies of snowshoe hare (Lepus americanus) populations derived fromhunting records have not only revealed temporal population trends but also complexpopulation dynamics. Canadian snowshoe hares exhibit a decadal cycle of between9-11 years which is strongly synchronised with fluctuations of their main predator, thelynx (Lynx canadensis(Elton & Nicholson, 1942; Keith, 1963; Krebs et al. 1986;Keith, 1990; Krebs et al. 2001). Complex dynamics including cyclicity have also beenfound in mountain hare populations (Ranta et al. 1997; Kauhala, 2005). Recentexplanations of temporal variability and cyclicity have highlighted the complexinteracting roles of density dependence, food supply, direct predation, indirectpredator-induced stress, other small mammal populations, parasitism, local weatherconditions, climatic cycles and solar activity (Sinclair et al. 1993; Krebs et al. 1995;Ranta et al. 1997; Krebs et al. 2001; Korpimaki et al. 2004; Newey & Thirgood, 2004;Korpimaki et al. 2005; Kauhala et al. 2005; Newey et al. 2005; Selvas, 2006).The effects of intrinsic density dependent processes on hare population dynamics arewell documented (Krebs et al., 2001). In cyclic snowshoe hare populations, femalereproductive output is known to be influenced by the stage of the population phaseand thus by population density (Carry & Keith, 1979; Stefan, 1998; Hodges, 2000).Furthermore, juvenile and adult survival, particularly over-winter survival, is affected byintraspecific competition, predation and disease transmission, all mediated bypopulation density (Keith et al., 1984; Boutin et al., 1995; Newey et al., 2005). Thesynchrony of local hare populations with both terrestrial and aerial predatorabundance suggests that density dependent trophic effects are a major influence onthe governing dynamics of cyclic population fluctuations (Boutin et al., 1995; Krebs etal., 2001). Hare Survey of Ireland 2006/07 Fig. 2 An example of the decline in the number of brown hares shot in Great Britain during theearly 20th century. These data are from Holkham Estate, Norfolk. After Tapper & Parsons(1984).Extrinsic, density-independent processes such as large-scale climatic patterns arealso associated with the population dynamics of many terrestrial species (Post &Stenseth, 1999; Patterson & Power, 2001; Stenseth et al., 2002; Stenseth, 2003).Recent studies show that interannual and multiannual hare population fluctuations insome regions are correlated with measures of climatic variation such as the NorthernAtlantic Oscillation (NAO) (Schmidt et al., 2004). The NAO is a complex climaticphenomenon characterised by cyclical fluctuations of air pressure and changes inwest to east storm tracks across the Northern Atlantic between 40-60N. The NAOaffects temperature, precipitation and wind across most of the northern hemisphere(Lamb & Peppler, 1987; Hurrell & van Loon, 1997), and represents a measure thatintegrates the effects of a number of abiotic factors that may influence animalpopulation dynamics.Here we evaluate the use of Irish gamebag records in assessing long-term historicalIrish hare population trends. Establishment of trends may enable causal factors ofdeclines to be identified whilst an analysis of hare population dynamics will allowrecent population changes to be set in a wider context to better inform conservationstrategies.Specifically we test two hypotheses: 1) that Irish hares have experienced a historicaldecline in their abundance and that the initiation of such a decline coincided with theagricultural intensification in the early 20th century and 2) that Irish hare populationsexhibit multiannual periodicity. Hare Survey of Ireland 2006/07 10 2.2.2MethodsRecord collationEstate shooting records were acquired from the National Library of Ireland (Dublin),the Public Records Office of Northern Ireland and various private estates. Thenumbers of hares shot per shooting season (August-February each year) weregathered and a total of 14 time-series were collated spanning 124 shooting seasonsbetween 1846 and 1970. The estates used in analyses were Castle Archdale(Fermanagh), Castlegar (Galway), Crom (Fermanagh), Dromoland (Clare), FavourRoyal (Tyrone), Finnebrogue (Down), Headfort (Meath), Kenmare (Kerry), Lissadell(Sligo), Louth Estate (Louth), Oakpark (Carlow), Parkanaur (Tyrone), Shane’s Castle(Antrim) and Wicklow House (Wicklow) (Fig. 3).Fig. 3The locations of 14 shooting estates from which gamebag records were collated. Hare Survey of Ireland 2006/07 11Population indices and growthIndices of hare gamebag change between 1846-1970 were produced using thespecialist software programme TRIM (TRends and Indices for Monitoring data;Pannekoek & van Strien, 2001). Accounting for overdispersion and serial correlationof the data, TRIM interpolates missing observations at each site from changes in allother sites using a Poisson general log-linear model (McCullagh & Nelder, 1989). Thetechnique is particularly useful as it can isolate temporal variation from spatialvariation among sites. The first year of the time-series was set to 1 and allsubsequent years relative to the first. TRIM allows trends within time-series to beestablished prior to or after specific events that may have influenced the data; thesetime points are referred to as changepoints. We identified two potential changepoints:1914 marked the beginning of World War I (WWI) and the early events precipitatingIrish independence, both of which influenced land management and the managementof sporting estates, and 1939 was the beginning of World War II (WWII) and theinitiation of post-war agricultural intensification.Gamebag indices have often been used as a proxy for hare abundance and aregenerally a reflection of hare density (Langbein et al. 1999). Hereafter, gamebagindices are also referred to as population indices.A measure of total population growth was established using the formula:Where is annual population growth, logrepresents the application of a naturallogarithmic algorithm to , the population index at year (i.e. the year of interest) andt-1 the population index of yeart-1 (i.e. the preceding year).Statistical analysisTime-series analysis was used to assess the occurrence of periodicity in harepopulation indices. Autocorrelation coefficients describe the relationship between hareindices at different lagged time periods whilst partial autocorrelation coefficientsassess the consistency of the effect throughout the time-series. Only time lags thatpresented both significant autocorrelation and partial autocorrelation coefficients weredeemed statistically meaningful. Where the data were significantly influenced bytemporal trends (e.g. population decline) they were first detrended by fitting acurvilinear growth regression and treating the residuals as the population index.To assess the regulatory factors determining annual hare population growth, multipleregression analysis was conducted using a REML (REstricted M aximum L ikelihood) procedure assuming an autoregressive AR(1) error structure (Patterson & Thompson,1971). Population growth was modelled separately for both the stable (pre-1914) and(N(Nloglog - = Hare Survey of Ireland 2006/07 12declining (post-1914) phases of the population. To establish intrinsic densitydependent processes the population index in the year preceding that of interest (t-1was added as a covariate to models for both phases. To assess extrinsic climaticeffects, the mean Northern Atlantic Oscillation Index value for the preceding autumnNAOt-1) was also entered as a covariate. The NAO is measured by an index ofdifferences in sea-surface pressure between Iceland and the Azores or Iberia. Meanautumn NAO indices were calculated using monthly index data available from theClimate Analysis Section of National Centre for Atmospheric Research, USA(http://www.cgd.ucar.edu/#jhurrell/nao.html). The importance of inherent periodicity, judged by prior time-series analysis, wastested by including the population index at significant autocorrelated lags. Hence, thepopulation index ten years previous (t-10) to the year of interest () was added to thepre-1914 stable phase model, while the population index seven years previous (t-7to the year of interest () was added to the post-1914 declining phase model.For both study periods all possible models including two-way interactions betweenpopulation indices at autocorrelated lags and the NAOt-1 were created and theirperformance assessed using the Information-theoretic approach proposed byBurnham & Anderson (2002). Model parsimony was evaluated using the AkaikeInformation Criterion (AIC) and Akaike weights (). The top set of N models wastaken as 0.95 within the whole set of models (Burnham & Anderson, 2002).The Akaike weight of each model is the relative likelihood of that model being the bestwithin a set of models. A model deviance ratio (MDR) test was used to assess the fitof the single best approximating model assuming an distribution. We ranked thevariables according to their relative importance by summing the Akaike weight (  from all model combinations where the variable of interested was included (McAlpineet al., 2006). The larger the summed Akaike weight (which varies between 0 and 1),the more important the variable. Finally, multimodel inferencing was used todetermine the averaged regression coefficient of each variable across the top set ofmodels (Burnham & Anderson, 2002). To allow for the direct comparison of regressioncoefficients all variables were standardised to have a = 0 and a s = 1 prior toanalysis (Schmidt et al., 2004).Statistical analyses were conducted using GenStat v6 and SPSS v14. Hare Survey of Ireland 2006/07 132.2.3ResultsOf 340 hare game bag records, four estates contributed substantially to the time-series: Castle Archdale (14.8%), Crom (13%), Headfort House (13.5%) and Lissadell(28.8%; Appendix 1). Trends were reconstructed in the number of Irish hares shotannually throughout Ireland between 1846-1970 (Fig. 4). Prior to the first changepoint(1914), there was no overall change in the hare population. However, distinctinterannual and multiannual fluctuations were apparent. From 1914-1970 gamebagindices declined significantly by -88% (TRIM Wald1,61=13.87, p0.001). The secondchangepoint (1939) did not significantly alter this trend.The coverage of the gamebag data, as described by the number of shooting estatesrepresented in each year of the time-series was comparable between the stable anddeclining phases of the indices. Prior to 1914, each year, on average, had datacontributed by 2.71±1.46 estates and after 1914 this remained at 2.76±1.76 estatesper year. Eleven of the 14 estates provided a measure of shooting effort, taken as thenumber of guns used per season, in 109 out of the 340 bag records. This was notaccounted for in analyses as it would have substantially reduced the data available,however, mean shooting effort was 1.5 times greater after 1914 (79.3±43.3guns.estates-1.year-1) than pre-1914 (49.9±32.1 guns.estates-1.year-1).Time-series analysis suggested that hare gamebags prior to 1914 exhibited asignificant positive autocorrelation at a lag of 1 year (r = 0.43) and a significantnegative autocorrelation at a lag of 10 years (r = -0.40, Fig. 5a). Detrended gamebagindices post-1914 exhibited a significant positive autocorrelated lag at 1 year (r = 0.48)and a significant negative autocorrelated lag at 8 years, however the effect at 7 yearswas more consistent throughout the time series (r=-0.42, Fig. 5b). Irrespective of theirsignificance, autocorrelation coefficients for both the stable and declining populationphases fell into a clear pattern, with a well defined anti-phase. In both time periods thesuggested phasic period was 16-17 years, although this was not significant at a0.05 level. All autocorrelated lags were subject to strong damping and were notmaintained beyond the first cycle.During the stable phase of the population indices, annual hare population growth wasinfluenced negatively by the population index in the preceding year (t-1) and tenyears previously (t-10) (Figs. 6a & 7a) but positively by the autumn Northern AtlanticOscillation Index value for the preceding autumn (NAOt-1, Figs. 6a & 7a). During thedeclining phase of the population indices, annual hare population growth wasinfluenced negatively by the population index in the preceding year (t-1) and sevenyears previous (t-7) but no effect of the autumn Northern Atlantic Oscillation Indexvalue for the preceding autumn (NAOt-1) could be discerned (Figs. 6b & 7b).For the stable phase of the time-series, five variables were retained within the top setof models and were taken as those most likely to explain variation in annual Irish hare Hare Survey of Ireland 2006/07 14population growth prior to 1914. Direct interannual density dependence, demonstratedby the population index at yeart-1 t-1) and inherent decadal periodicity demonstratedby the population index at yeart-10 t-10) had consistently strong negative effects onpopulation growth. The autumn NAO index during yeart-1 (i.e. NAOt-1) also contributedto interannual variation in population growth (Fig. 6).For the declining phase of the time-series, only two variables were retained within thetop set of models describing annual Irish hare population growth post-1914. Directinterannual density dependence (t-1) and inherent periodicity on a 7 year (t-7) anti-phase (Fig. 6).Fig. 4Trends in Irish hare gamebag indices from 14 shooting estates throughout Ireland from1846-1970 produced using TRIM software analysis. Analysis changepoints are shown at thebeginning of WWI (1914) and WWII (1939). Shooting season Gamebag (population) Index 0.00.20.40.60.81.01.21.41.61.8 Trend Hare gamebag index WWI WWII1846/471866/671886/871906/071926/271946/471966/67 Hare Survey of Ireland 2006/07 15 0.00.20.40.60.81.0 t-1t-7 0.00.20.40.60.81.0Explanatory variables t-1NAOt-1t-1*NAOt-1t-10(a) (b)(a)Fig. 5Time-series autocorrelation coefficients of (a) pre-1914 hare population indices and (b)post-1914 detrended hare population indices. Lines indicate lags that are significant at p0.05and * indicates lags that have significant autocorrelation and partial autocorrelation coefficients.(a) (b)Fig. 6 Relative importance of factors in explaining variation in the annual Irish hare populationgrowth (a) pre-1914 and (b) post-1914. Variables are ranked in the order of their summed Akaikeweight (  ) within the top set of models. Black bars indicate those variables that were retainedin the best single approximating model i.e. that with the lowest AIC value, and grey bars indicatevariables included in all other models within the top set. Lag (years) 01020304050Correlation coefficient -0.6-0.4-0.20.00.20.40.6 ** Lag (years) 01020304050 -0.6-0.4-0.20.00.20.40.6 ** Hare Survey of Ireland 2006/07 16(a)(b)Fig. 7Path diagram showing the model averaged regression coefficient ± standard error foreach explanatory variable retained within the top set of models that explain variation in annualIrish hare population growth for (a) 1846-1913 and (b) 1914-1970. Line width represents thescale of the effect while dashed lines indicate negative effects and solid lines indicate positiveeffects.2.2.4DiscussionWe have established long-term historical trends in Irish hare game bags anddemonstrated the prevalence and influence of some factors governing interannual andmultiannual population growth. From localities throughout Ireland, 124 years arerepresented within Irish game bag records and long-term trends are clear (Fig. 4). Priorto 1914, hare game bags fluctuated markedly but there was no overall trend.Thereafter, the annual hare index declined markedly reflecting a major decline in thenumber of hares shot. Although the sample of estates is small, the consistency ofcoverage and shooting effort between the stable and declining phases of the game bagindices suggest that the trend observed after 1914 represents a real change in the harepopulation of Ireland. If the abundance of hares differed between game estates and thewider countryside the results presented here may be biased. Nevertheless, game bagindices have often been used as a proxy for hare abundance and are generallyaccepted to reflect real changes in hare density over time (Strandgaard & Asferg, 1980;Tapper & Parsons, 1984; Tapper, 1987; Langbein et al. 1999; Smith et al. 2005). Theobserved decline in the numbers of hares shot in Ireland is consistent with declines ingame bags across Great Britain (Fig. 2) and elsewhere in Europe (Bröekhuizen, 1982;Tapper & Parsons 1984; Pielowski, 1990; Tapper, 1992; Mitchell-Jones et al., 1999;Smith et al., 2005).A number of factors may have played an important role in this decline. The loss ofgamekeepers in Britain during WWI and WWII which has been linked to the decline inthe brown hare population (Tapper, 1992) may also have been experienced in Ireland.Significant changes in land ownership patterns were also underway in Ireland at thistime, namely the sub-division of numerous large estates into smaller holdings. As aresult, practises that would have enhanced hare populations, such as predator controland habitat management, were discontinued. Furthermore, in common with the rest of Hare Survey of Ireland 2006/07 17Europe, agricultural intensification in Ireland during the early 20th century may also havecontributed to declines in hare populations.Time-series analysis suggested that density dependence may be a strong factordetermining Irish hare population fluctuations. Prior to the start of the long-termpopulation decline, multiannual fluctuations were evident with a distinct anti-phase at alag of 10 years, whilst a 16 year phasic period was suggested. During the long-termdecline of Irish hare population, multiannual fluctuations exhibited a shortened anti-phase at 7 years, whilst a 17 year phasic period was suggested. Decadal fluctuationsare well known from snowshoe hare populations in North America (Keith, 1963; Krebs etal., 2001), whilst recent analysis of Scottish gamebag records suggest that Lepustimidus scoticus may exhibit a 16 year quasi-cycle and mountain hare populations in thePeak District have been shown to have a strong 7 year periodicity (Reynolds et al.,2006).Explanations of the cause of multiannual fluctuations vary widely (Middleton, 1934;Tapper, 1987, 1992; Mallon et al, 2003; Newey, 2005). Krebs et al. (2001) supportedthe ‘predator-prey-winter food’ or ‘tri-trophic’ hypothesis for explaining hare populationregulation (Krebs et al., 1986; Trostel et al., 1987; Sinclair et al., 1988) suggesting thathare cycles are largely predator-prey oscillations influenced by winter food availability.Delayed density dependence of one or more years is a common characteristic in theseprocesses (Carry & Keith, 1979; Boutin et al., 1995).Large scale climatic processes may be capable of synchronising populations over largegeographical areas (Stenseth et al., 1999, 2002). Geographic synchrony of harepopulations elsewhere is poorly understood but other large scale influences such assolar activity have been implicated (Ranta et al. 1997; Sinclair, 1993; Smith, 1983).Solar activity and the NAO exhibit roughly decadal variations that have been shown tobe closely associated (Lamb & Peppler, 1987; Hurrell & van Loon, 1997; Angell, 2001;Tourpali et al., 2005;Versteegh, 2005), especially in autumn and winter (Ogi et al.,2003; Lukianova & Alekseev, 2004; Koder & Kuroda, 2005; Bochnicek & Heida, 2006).It is possible that the influence of the NAO on Irish hare population growth may havebeen responsible for the decadal periodicity evident prior to 1914.High seasonal NAO indices are associated with increased rainfall and mild temperaturesin Great Britain and Ireland (Butler et al., 1998; Benner, 1999). During cyclicalfluctuations in small mammals such as voles, lemmings, mice and hares it has beensuggested that survival rather than reproductive rate drives population increase(Korpimaki et al., 2004). Here we suggest that over-winter survival of adults may beaided by extended grass growth whilst survival and maturation of leverets, particular bythose born late in summer, may be assisted by the mild autumns that occur during highNAO index years. Furthermore, Irish hares may breed throughout the autumn andwinter during mild years (Neil Reid, pers. obs.). Greater survival of adults and leveretsfrom the previous year provides a greater founder population for reproduction in the yearof the shoot from which gamebag indices were calculated. Consequently, we suggest Hare Survey of Ireland 2006/07 18that interannual fluctuations of Irish hare populations prior to population decline werepartly mediated by autumn temperatures and rainfall determined by the NorthernAtlantic Oscillation. Similar influences of the NAO on brown hare populations have beendemonstrated in Denmark (Schmidt et al., 2004).Schmidt et al. (2004) noted that the steady increase in NAO indices during the latter 20thcentury should have brought increases in hare populations. However, such increaseswere unable to reverse declines caused by ongoing agricultural intensification. Thismay explain the disappearance of the NAO as a major influence on Irish hare populationgrowth after 1914. Some authors have suggested that lagged density dependentprocesses, such as variation in reproductive success are sufficient to induce periodicityor regular cyclicity alone (Royama, 1992). Consequently, it may be that despite theapparent disappearance of climatic decadal forcing, the Irish hare population stillmaintained a regular cycle, albeit with a shortened period.The present study provides evidence from game bag data that supports the hypothesisthat Irish hare populations began to decline during the early 20th century. Irish harepopulations exhibit multiannual periodicity prior to and after the population decline. Thismay suggest that the processes that naturally regulate hare populations continued toinfluence their dynamics despite overriding anthropogenic factors. Hare Survey of Ireland 2006/07 192.3Coursing records2.3.1IntroductionThe Irish Coursing Club (ICC) is the official body responsible for organising harecoursing meetings in Ireland. Coursing is licensed under the Wildlife Acts (1976 and2000) and as a condition of this licensing the ICC has collated records of the number ofhares netted for coursing and released back into the wild since 1988. Catches of haresfrom clearance netting and driven counts have previously been used as successfulhare census techniques (Andrzejewski & Jerierski, 1966; Abildgård et al., 1972; Grosset al., 1974; Pépin, 1985). In contrast to historical game shooting records wehypothesised that coursing records might reflect more recent trends in the Irish harepopulation.While it is likely that coursing records indicate hare availability to some extent, clearlythe number of hares caught will also reflect the scale of club needs for meetings and arelated effect of hare survival rates in captivity, both of which may change over time. Acomprehensive review of hare mortality during coursing in Ireland is provided by Reidet al. (2007). For example, in 1993 the ICC introduced a directive for improving haresurvival that included compulsory muzzling of dogs. As part of our investigation of thefactors affecting the number of hares caught and released for coursing, we weretherefore obliged to consider the contribution of such changes in practice to variation inthe number of hares caught and released.Our analytical approach was to account for as many “practice-related” variables aspossible and isolate the remaining component of variance that could then be ascribedto temporal trends. This variance could, nonetheless, still be alternatively ascribed totrends in the hare population or in the scale of coursing activity.2.3.2MethodsRecords were examined for all coursing club meetings in Ireland between 1988/89 and2003/04. The numbers of active clubs per season and the number of hares taken fromand released back into the wild were collated. Approximately 13% of records weremissing data on the numbers of captures but data on the numbers of releases werealways present. Capture data were missing entirely for 1995/96 and 1997/98. Thereasons for missing data are not known. For descriptive purposes only, i.e. not forstatistical analysis, missing capture data were interpolated using the number of haresreleased and mean mortality for the specific season. For 1995/96 and 1997/98 datawere interpolated using mean hare mortality after 1993, i.e. after the implementation ofmuzzling. Hare Survey of Ireland 2006/07 20Statistical analysesFactors affecting the number of hares released per club were analysed by fitting amodel using the REML procedure (Patterson & Thompson 1971). Yearly records weretreated as repeated measures of the same club, the use of muzzled or unmuzzled dogswas a fixed factor, club was treated as a random factor and the number of captureswas treated as a covariate. Factors affecting variation in hare survival, i.e. theproportion of hares released into the wild, was therefore indicated by significantinteractions with the numbers of hares captured. All two-way interaction terms werefitted initially, but subsequently removed if found to be non-significant. Prior to analysisall variables were tested for colinearity using correlation, ensuring that none of thevariables were significant bivariates i.e. r � 0.7 (Fielding and Haworth 1995). Theinfluence of each term in the final model was taken as the Wald statistic generatedwhen the term of interest was fitted last (Kruuk et al. 1999), divided by the degrees offreedom (Quinn & Keough 2002). Statistical tests were preformed using GenStat© (v6).Fig 8Distribution of coursing clubs in Ireland for which records between 1988/89 and 2003/04were analysed. 21Table 1 Summary of Irish Coursing Club records between 1988/89-2003/04.Status of dogsYearNumberof harescapturedNumberof haresreleasedNumber ofhares notreleasedNumberof activeclubsMean number ofhares capturedper club ± s.d.Mean % mortalityof hares perclub ± s.d. Unmuzzled1988/89*66445590*10547984.1 ± 17.216.0 ± 8.8 1989/90*67095636*10737984.9 ± 16.016.0 ± 9.71990/916373531510587782.8 ± 17.617.3 ± 1.81991/92656956179527785.3 ± 15.914.5 ± 7.41992/936756572210347886.6 ± 15.615.2 ± 6.7Sub-total-3305127880517139084.7 ± 16.515.8 ± 9.1Muzzled1993/94*58665427*4397380.4 ± 14.97.6 ± 4.9 1994/95592156502717677.9 ± 14.64.7 ± 5.91995/96*62656006*2597781.4 ± 16.74.2 ± 0.71996/97622460242007484.1 ± 13.73.4 ± 0.51997/98*61335882*2517878.6 ± 14.44.1 ± 0.11998/99605058042467679.6 ± 17.84.4 ± 0.91999/00650762942137883.4 ± 18.23.4 ± 0.52000/01587755703077677.3 ± 13.95.5 ± 1.42001/02600558231827679.0 ± 15.63.3 ± 0.52002/03587757201577578.5 ± 15.92.7 ± 0.42003/04575156081437181.0 ± 17.42.3 ± 0.6Sub-total-6647663808266883080.1 ± 15.94.1 ± 5.9Total-99527916887839122081.6 ± 16.27.9 ± 8.9 * partially incomplete records are interpolated Hare Survey of Ireland 2006/07 222.3.2 ResultsThe records of 81 clubs (Fig. 8) conducting 1220 coursing meetings (390 withunmuzzled dogs and 830 with muzzled dogs) over 16 seasons were analysed. Thenumber of active clubs decreased over the period of study reflecting a decrease ingeneral levels of coursing activity (Table 1).The main effects of hare captures and club were statistically substantial but biologicallytrivial, since they accounted for variation in the scale of coursing operations (Table 2).The relationship between the number of hares released and the number captured wasgreatly affected by the introduction of dog muzzling, i.e. hare survival was greater whendogs were muzzled (Fig. 9). The relationship between the number of hares releasedand those captured varied with time and when the analysis was run for each year theslope increased over time (Fig. 10), indicating that hare survival increased for reasonsthat could not be accounted for by muzzling alone. The relationship between thenumber of hares released and the number of hares captured varied among clubs,indicating that hare survival varied among clubs. Muzzling also affected the number ofhares released and this effect varied significantly among clubs.Finally, the number of hares released varied among years and this effect varied amongclubs. These two components of the total variance in the number of hares releasedcould not be accounted for by the modelled changes in coursing practice but could bealternatively ascribed to changes in the scale of coursing activity and/or trends in thehare population, either or both of which also varied among clubs or club localities.Table 2 Factors affecting the number of hares released by coursing clubs, from a REMLmodel.Explanatory variablesInterpretation of effectd.f. p Captures*muzzlingThe number of hares caught plus theaffect of muzzling substantially affects thenumber of hares released.228.071,9020.001 CapturesNumber of hares released is related tonumber of hares caught139.451,9020.001Captures*yearHare survival improves with time due tofactors other than muzzling 88.031,9020.001MuzzlingNumber of hares released affected bymuzzling of dogs 72.291,9020.001YearTemporal trend in hare availability and/orscale of coursing 10.611,9020.001ClubNumber of hares released varies amongclubs4.6580,9020.001Club*yearVariation among clubs in hare availabilitytrends and/or scale of coursing3.2879,9020.001Club*muzzlingEffect of muzzling dogs varies amongclubs2.7876,9020.001Captures*clubHare survival varies among clubs1.7379,9020.001 Hare Survey of Ireland 2006/07 23 Year Standardised -coefficient 0.820.840.860.880.900.920.940.960.981.00 Coursing with unmuzzled dogs Coursing with muzzled dogs 2003/041999/001995/961991/921987/88Figure 9The relationship between the number of hares captured and the number of haresreleased was closer during courses using muzzled dogs (r=0.91, n=675 club-years) thanthose using unmuzzled dogs (r=0.78, n= 386 club-years).Figure 10Slopes of the relationship between the numbers of hares released and numberscaptured in each year between 1988/89 and 2003/04. During 2000/01, two out of 76 clubsexperienced unusually high rates of hare mortality. Number of hares captured 050100150200Number of hares released 50100150200 Coursing with unmuzzled dogs (before 1993) Coursing with muzzled dogs (after 1993) Hare Survey of Ireland 2006/07 242.3.3 DiscussionThe number of hares caught for coursing reflects the availability of hares to a limitedextent, but is a substantial effect of the scale of club needs and, over the period of thisstudy, of changes in the survival of animals while in captivity. Therefore, to control forthese confounding factors we investigated variance in the number of animals released,while controlling for scale, changes in practice and resulting changes in survival.A large part of variation in the numbers of hares released by coursing clubs wasexplained by declining rates of hare mortality, due to the introduction of dog muzzlingand other ongoing enhancements of hare husbandry. Such improvements inhusbandry appear to have resulted in fewer hares being needed for meetings and,therefore, fewer hares being caught.A relatively small component of variance could not be accounted for by known scale orpractice-related factors, and was potentially a useful measure of changes with time(year effect) and variation in this temporal effect among clubs (year*club interaction).To resolve the proportion of these temporal trends that is due to variation in hareavailability, i.e. may reflect changes in hare populations, and to changes in the scale ofcoursing club needs, it is necessary to understand the effort put into capturing hares.Without measures of effort, ICC records are not appropriate for monitoring changes inthe status of the hare population. If effort was known, this could be added to themodels used above. The main statistical effect of effort would be biologically trivial, i.e.it would indicate that if you tried harder you would catch more hares. However, withunderstanding of the relationship between effort and numbers caught over a relevantrange of hare populations, the slopes for each year in the interaction between effortand year could be interpreted as a measure of changing hare availability. Put simply,in years when less effort is required to catch the same number of hares, this suggeststhat more hares are available for capture. The standard error of the slope could betaken as a measure of confidence. In principle, a similar approach to the interactionbetween club (or region) and effort would reflect spatial patterns of hare abundance.We recommended that, for a pilot period, coursing clubs should record some measureof capture effort. This would ideally take the form of a quantitative measure, such asnet-metre-days or at least the number of netting days, number of beaters and/or areanetted. Such recording would enable the ICC to make a valuable contribution to themonitoring of the status of the Irish hare and provide a relatively simple and costeffective tool to help NPWS fulfil its surveillance requirements under the EC HabitatsDirective. Hare Survey of Ireland 2006/07 253Hare Survey of Ireland 2006/073.1IntroductionFor species of conservation concern, the importance of contemporary monitoring dataand its direct application to management is widely recognised (Choudhury, 1999, 2002;Battersby & Greenwood; 2004). This is especially pertinent for species that areexploited for hunting (Perez et al., 2002; Reeves, 2002; Baghli & Verhagen, 2003)where an understanding of demography is essential to establish sustainable harvestrates. For mammals in particular, such data are usually limited and often unreliable(Harris et al., 1995). In Great Britain the need for a comprehensive national mammalmonitoring network to provide robust data on population trends has long beenrecognised (Toms, Siriwardena & Greenwood, 1999; Macdonald & Tattersall, 2001;Battersby & Greenwood; 2004) and recently established by the Tracking MammalsPartnership (Battersby, 2005). A Bat Monitoring Programme has been in place in theRepublic of Ireland since 2003 (McAney, 2006) and major efforts have been made inrecent years to establish standardised monitoring methodologies for other mammalspecies of conservation concern such as pine martens, cetaceans, otters, seals and inthe current study, Irish hares. Ideally, mammal surveillance programmes shouldemulate the success of bird monitoring programmes, generating annual trend data(Battersby & Greenwood; 2004).Article 11 of the European Habitats Directive (92/43/EEC) requires that member states“undertake surveillance of [mountain hare] conservation status” giving Ireland astatutory obligation to monitor changes in the Irish hare population. Hellawell (1991)defines surveillance as repeated and standardised observations of abundance overtime, using methods that enable changes in numbers to be detected. Whilst no dataexist on the current conservation status of the Irish hare in the Republic of Ireland,previous studies, notwithstanding varying methodologies, suggest that Irish harepopulation densities may have varied markedly in Northern Ireland over the last 13years (Table 3). Table 3Estimated density of Irish hares in Northern Ireland from 1994-2006.StudyYear offieldworkMean estimated densityhares/km (range) Dingerkus & Montgomery (2002)1994-960.65 (0.20-1.54) O’Mahony & Montgomery (2001)20001.18* (0.27-2.86)Preston et al. (2003)20021.00 (0.50-1.80)Tosh et al. (2005)20045.11 (4.23-6.16)Tosh et al. (2005)20053.10 (2.49-3.87)Reid (2006)20053.01 (2.02-4.48)Hall-Aspland et al. (2006)20062.57 (1.91-3.46) Density calculated using the published total abundance divided by the land area of NorthernIreland c. 14,043km Hare Survey of Ireland 2006/07 26One of the greatest problems facing conservation, particularly on islands is the spreadand establishment of introduced species (Harris & Yalden, 2004; Stokes et al., 2006).Reid & Montgomery (2007) demonstrate that the brown hare is well established inNorthern Ireland and suggest that its naturalisation may represent a significant risk tothe future ecological security and genetic integrity of the Irish hare. Ireland hasinternational obligations under the Convention on Biological Diversity (Anonymous,1992), the Berne Convention (Anonymous, 1979) and the European Habitats Directive(EEC 43/92) to address invasive species issues. It is, therefore, desirable thatadequate monitoring is established to document the spread and impact of alien species(Anonymous, 2003; Harris & Yalden, 2004), including the brown hare in Ireland.Population estimation techniquesLagomorphs have been surveyed using almost every census technique available forterrestrial mammals (Hutchings & Harris, 1993). Night-driven, spotlight surveys havebecome a favoured method of estimating relative abundance of nocturnal mammalsdue to their efficiency, repeatability, and lack of interference with the subject (Langbeinet al., 1999). A measure of true density and abundance can sometimes be moreinformative to conservation strategies than simpler measures of relative abundance.Distance sampling, using the software programme Distance, enables estimates of truedensity to be modelled by relating count data to the distribution of animals relative tothe observer (Fig. 11; Buckland, et al., 2004). Distance sampling assumes that allanimals at the point of survey are detected (i.e. 100% of animals on the survey transector point). The further the surveyor looks from the survey point the less likely itbecomes that a target animal will be detected. Assuming uniform distribution of animalsFig 11Hypothetical example of detection function estimation. The grey bars represent the(scaled) counts of hares detected within each of distance interval; the dashed bars representthe (scaled) expected number of hares; the curve represents the estimated detection functionfitted to the observed counts. (Counts have been scaled to take account of the fact that morehares are expected at greater distances because there is more area at greater distances from apoint.) Scaled frequency Hare Survey of Ireland 2006/07 27in the area searched, the probability of detecting an animal at any distance from thesurveyor can be estimated using the distances to observed animals. This is then usedto convert the number of animals seen into an estimate of the number of animalspresent within the area searched. Animal density is estimated by dividing theestimated number of animals present by the area of the region searched. Finally, if thearea searched is representative of the country as a whole, the density estimate can bemultiplied up by the total land area of the Republic of Ireland to provide an estimate ofthe total abundance of hares.Distance sampling provides robust estimates of absolute abundance only when thestudy population and survey design conform to the key assumptions of the analyses.Previous research demonstrates that surveys of hares conducted from roads do notconform to the assumptions of distance sampling and biased estimates are common(Tosh et al., 2004; Tosh et al., 2005). However, by identifying biases in hare surveymethodologies and developing means of accounting for them we aimed to develop astrategy that will provide a robust basis for future monitoring.3.2MethodologySurvey designForty survey teams involving �80 people (Appendix 2) surveyed the most south-westerly 1km Irish grid square in each 10km Irish grid square. In cases where themost south-westerly 1km square was not bisected by 1km of suitable minor road thenext nearest 1km square that was suitable was selected. To ensure uniformcoverage an attempt was made to survey each 10km grid square each year. Squareselection was made with a geographic information system (GIS). Squares that provedunsurveyable during 2006 due to issues such as access or health and safety wereabandoned in 2007 and replaced with the next nearest suitable square.Surveyors were trained in the identification and differentiation of Irish and brown haresand rabbits. Data were also gathered for foxes. Surveys were conducted during winter(January-March) when ground vegetation was minimal, maximising the detectability ofanimals. Furthermore, it is generally better to assess pre-breeding mammalpopulations due to the variability in juvenile recruitment between years (Macdonald etal., 1998). A 2 million candlepower spotlight was used from the back of a highclearance vehicle or from a step ladder such that the observer’s head height wasapproximately 3m from ground level, i.e. above most hedgerows (Fig. 12). Five pointswere surveyed along each 1km transect spaced at approximately 200m intervals (Fig.13). Both sides of the road were swept twice with the light beam to ensure that alltarget animals were detected. For each cluster of animals observed, the species,cluster size (i.e. number in the group) and the angle and radial distance (measured bylaser rangefinder) of the cluster from the observer was recorded. During both survey Hare Survey of Ireland 2006/07 28years, survey effort was taken as the number out of the eighteen 20 sectors of a 360circle, i.e., swept by the light beam that were visible without obstruction (measuredusing a custom-made protractor; Appendix 3). During 2007, data were also collectedon the frequency at which each 20 sector of the 360 field of view were visible(Appendix 3). Surveys were conducted between one hour after sunset and midnight.To describe patterns of hare distribution with respect to field boundaries, “transfield”transects were walked perpendicular to the road at a random selection of points in2007. These transects extended to the first field boundary or 250m in cases where aboundary was not met. For each cluster of hares detected, the species, cluster size(i.e. number) and perpendicular distance of the cluster from the transect (and byinference, from the road and field boundary) was recorded.To describe hare distribution, data were collated from hare surveys during both yearssupplemented by incidental sightings from surveyors, sightings submitted by membersof the public via e-mail and sightings recorded on the biology.ie database(www.biology.ie). Fig. 12 Survey being conducted from the back of a pickup truck © Mathieu Lundy Hare Survey of Ireland 2006/07 29Fig. 13A typical 1km survey square containing a 1km transect on which 5 survey pointswere placed approximately 200m apart from which the number and distance of each harecluster was recorded. Note that not all hares within each square will have been detected.Habitat dataArcView GIS 3.3 (ESRI, California, USA) was used to compute landscape and habitatvariables using the CORINE land cover map (EEA, 2000). Spatial Analyst 2.0 andPatch Analyst 3.1 extensions were used to describe the proportion of the landscapemade up of four landclass types:i) bog, moor, heath and marshii) mixed farmlandiii) pastoral farmlandiv) other habitatsEach landclass was measured at three spatial scales measured from the centre ofeach survey square; 1km (radius = 0.56km), 10km (radius = 1.78km) and 100km(radius = 5.64km). Landclass categories were chosen intuitively based on landscapecharacteristics that were likely to influence the patterns of abundance of apredominately grassland species (e.g. area of pastoral agriculture). Hare Survey of Ireland 2006/07 30Statistical analysesThe effect of habitat on Irish hare sightings was assessed by building a set ofunivariate generalised linear models assuming a Poisson error distribution with alogarithmic link function using the number of hares counted per survey square as thedependent variable and the proportional cover of each habitat type as independentvariables at each of three spatial scales (1km, 10km and 100km). The spatial extentwithin each variable was chosen as that which had the highest Akaike weight valuewithin each set of three models (Akaike, 1983; Burnham and Anderson, 2002).Variance in the frequency of Irish hare sightings was then investigated by fittinggeneralised linear models assuming a Poisson error distribution with a logarithmic linkfunction using the habitat variables at the appropriate spatial scale and anyparameters that may have confounded their effects including survey effort, year andregion (Table 4). Proportional data were arcsine square-root transformed (Hosmer &Lemeshow 2000). As the primary focus was to investigate the explanatory power ofthe independent variables rather than building a predictive model, interaction termswere omitted. Furthermore, their inclusion would have limited resolution for somevariables if the data were further divided with respect to nominal factors.Table 4 Explanatory variables used to predict Irish hare abundance. Habitat variables wereobtained from the CORINE database (EEA, 2000).Variable categoryVariable nameUnitsDescription DependentvariableIrish hare abundanceCount1km frequency of hare sightings Rabbit abundanceCount1km frequency of rabbit sightingsSpecies dataFox abundanceCount1km frequency of fox sightingsYearCategorical2006 or 2007FactorsRegionCategoricalEast, North-west and South-westConfoundingcovariateSurvey effortProportionProduct of the number of survey pointsand the number of visible sectors per1km survey squareBog, moor, heath &marshProportionArea of each 1km 2 , 10km 2 and 100km 2 area around each survey square classedas inland marsh, moor, heath or peat bogMixed farmlandProportionArea of each 1km, 10km and 100kmarea around each survey square classedas arable horticulture, complex cultivationpatterns or heterogeneous agriculturalareas including areas dominated byagriculture with significant areas ofnatural vegetationPastoral farmlandProportionArea of each 1km 2 , 10km 2 and 100km 2 area around each survey square classedas improved pasture or natural grasslandHabitatsOtherProportionArea of each 1km 2 , 10km 2 and 100km 2 area around each survey square classedas bare rock, beaches, burnt areas, saltmarsh, sand dunes, scrub, sparelyvegetated areas or woodland Hare Survey of Ireland 2006/07 31Model parsimony was evaluated using the Akaike Information Criterion (AIC) andAkaike weights (), while multimodel inference was used to assess the contributionand effect of each covariate (for full explanation of model selection procedures seeStatistical Analyses on page 8, Section 2.2.2). To allow for the direct comparison ofregression coefficients all variables were standardised to have a = 0 and a s = 1prior to analysis (Schmidt et al., 2004). Statistical analyses were conducted usingGenStat v6.Density estimationConventional Distance Sampling (CDS) point transect methods require that:i) Points are placed randomly with respect to animals.ii) All animals at distance zero are detected.iii) Distances are measured accurately to the initial position ofdetected animals.iv) The fraction of a circle about each point which is searched is eitherthe same at each point transect or is measured.The terrestrial environment does not always fulfil the analytical assumptions ofDistance-sampling. First, hares are surveyed at night. Travelling to randomly locatedpoints throughout the countryside during darkness is unsafe, logistically impracticaland disturbing to those living in the countryside. Therefore, sample points were placedon roads. Whilst this facilitates the survey, locating samplers on roads will introducebias into the data, as hares may avoid field boundaries or avoid roads in particular dueto human disturbance. Consequently, the highest proportion of animals may be somedistance from the observer. An additional complication is that survey effort at differentpoints was not always the same because obstacles, such as hedgerows and trees,sometimes obscured a portion of the area being surveyed. Also not all survey squarescontained 5 survey points leading to highly variable levels of survey effort per surveysquare.Consequently, CDS was not appropriate to estimate absolute density of hares whenusing data from surveys located on roads and specialist methods were developed bythe University of St. Andrews, Scotland to account for non-uniform distribution ofanimals with respect to roads and variable survey effort (Marques & Borchers, 2006;Paxton et al. 2007) using the programme language R (CRAN, 2007).In 2007, a measure of angular sampling bias was achieved by recording the numberand direction of 20 sectors visible within a 360 circle around each survey point(Appendix 3). This bias was accounted for during custom analysis. In addition to thisdirectional bias, variation in total survey effort per square was taken into account byusing the number of points surveyed in each 1km survey square. Hare Survey of Ireland 2006/07 32The data from night-walked transfield transects were used to provide additionalinformation for estimating hare density gradients relative to field boundaries, in thiscase, the road. Three models were used to estimate the hare density gradient awayfrom roads; (1) half-normal, (2) hazard-rate and a (3) modified Gaussian.Density and abundance estimates were obtained for the Republic of Ireland as a wholeduring 2006 and 2007, with estimates stratified by geographic region (Fig. 14a)comprising i) East (Leinster plus Cavan and Monaghan), ii) North-west (Connaughtplus Donegal) and iii) South-west (Munster) and by landclass (Fig. 14b): i) bog, moor,heath & marsh, ii) mixed farmland, iii) pastoral farmland and iv) other habitats. Upperand lower 95% confidence limits were produced using a non-parametric bootstrappingprocedure.3.3ResultsOver both survey years a total of 691 out of 833 (c. 83.0%) of the 10km Irish gridsquares in the Republic of Ireland were successfully surveyed for hares (Fig. 15). Ofthose that were not surveyed, the majority were missed because they were mostly seawith a relatively small area of land. This under-sampling of the coastline may causebias if density is different on the coast than elsewhere. However, the pattern ofdetections suggest that this is not the case (Fig. 16). A total of 365 Irish hares (in 240groups), 1209 rabbits (in 669 groups) and 198 foxes (in 191 groups) were recorded.The number of hares observed increased from 141 hares in 2006 to 224 in 2007 (Table5). The Irish hare is widespread throughout the Republic of Ireland (Fig. 16a). Rabbitand fox sightings were greater in the eastern and south-western regions (Fig. 16b &16c). A detailed analysis of rabbit and fox sightings will be the subject of a laterpublication.No confirmed reports of brown hare were made in either survey year. However, anumber of anecdotal reports suggest that a small population of brown hares may existbetween Julianstown, Co. Meath (5340’21”N, 0617’07”W) and Balbriggan, Co. Dublin(5336’28”N, 0611’03”W) and may extend as far north as south Co. Louth.Landclass type exerted varying influences on Irish hare counts at different spatialscales (Fig. 17). The effect of pastoral farmland was most evident within immediatevicinity (1km); bog, moor, heath & marsh and other habitats exerted most influence onhare abundance at the local scale (10km), while mixed farmland dominated by arablehorticulture had its greatest effect at the landscape scale (100km).Multimodel inference produced a summary of the competing set of models accountingfor variance in frequency of Irish hare sightings. As expected, survey effort had thegreatest effect on the number of hares seen (Fig. 18). The area of pastoral farmland inthe immediate vicinity (1km) and the area of bog, moor, heath & marsh at the local Hare Survey of Ireland 2006/07 33scale (10km) had positive influences on hare abundance, whilst rabbit relativeabundance appeared negatively to affect the number of hares observed (Fig. 18).Accounting for the effects of survey effort, landscape type and rabbit abundance thefrequency of Irish hare sightings was significantly higher in the eastern region thaneither of the two western regions during both survey years and the total frequency ofhare sightings increased between 2006 and 2007 (Fig. 19). Hare Survey of Ireland 2006/07 34 (a) Geographic regions(b) Landclass categoriesFig. 14Stratification of Ireland into (a) geographic regions and (b) landclass categories for use in analyses Hare Survey of Ireland 2006/07 35Fig. 15The distribution of 10km Irish grid squares that were surveyed during the Hare Surveyof Ireland 2006/07.Table 5Descriptive summary for 1km squares surveyed during the Hare Survey of Ireland ina) 2006 and b) 2007.2006 a) RegionnNumberwithsurveyeffort �0Number withIrish haredetectionsDetected% occurrence(confidence intervals)Total numberof Irish haresseen Republic of Ireland6035257213.71 (11.60-15.90)141East2001502416.00 (13.60-17.80)52North-west1811651911.51 (9.50 - 13.50)35South-west2222122913.68 (11.80-15.90)54 2007 b) RegionnNumberwithsurveyeffort �0Number withIrish haredetectionsDetected% occurrence(confidence intervals)Total numberof Irish haresseen Republic of Ireland6476389214.42 (12.30-16.60)224East1951942613.40 (11.40-15.40)77North-west2142093617.22 (14.90-19.70)80South-west2382373012.66 (10.80-14.80)67 36(a) Irish hare (b) Rabbit (c) FoxFig. 16Sightings of (a) Irish hare, (b) rabbit and (c) fox in the Republic of Ireland during 2006/07. *[Data were extracted from the Hare Survey of Ireland 2006/07 (includingincidental sightings submitted by e-mail) and www.biology.ie. Hare Survey of Ireland 2006/07 37 0.00.20.40.60.81.01.2Explanatory variable(s) Year*RegionFox abundanceMixed farmland (100kmOther habitats (10km)Rabbit abundanceBog, moor, heath & marsh (10km)Pastoral farmland (1km)RegionYearSurvey effort 0.401±0.055FactorialFactorial0.244±0.0660.166±0.068-0.080±0.049-0.010±0.0100.008±0.010-0.001±0.006Not included Fig. 17Selection of appropriate spatial scale for (a) bog, moor, heath & marsh, (b) mixedfarmland, (c) pastoral farmland and (d) other habitats. The scale at which each variable wastaken to operate was chosen as that which had the highest Akaike weight (black columns).Mean values ± standard deviations are shown as grey columns.Fig. 18Relative importance of factors in explaining variation in the frequency of Irish haresightings. Variables are ranked in order of the sum of their Akaike weights (  ) within thetop set of models i.e. models with dAIC2. Black bars indicate those variables that wereretained in the best single approximating model (i.e. that with the lowest AIC value) and greybars indicate variables included in all other models within the top set. Notation to the rightindicates the strength of the slopes for each standardised covariate. Hare Survey of Ireland 2006/07 38Fig. 19Adjusted mean frequency of hare sightings per survey square controlling for the effectsof survey effort, habitat and rabbit abundance.Survey points located on the same transect are related and therefore not independent,for this reason the survey square, not the survey point, was taken as an independentsampling unit for variance estimation during Distance analyses. Most survey squaresin both years contained 5 survey points, but some had less (Fig. 20). Survey effort wasfurther affected by the angular bias anticipated by the sampling procedure (Fig. 21).The distribution of visible 20 sectors around each survey point was non-uniform (df=17= 356.00, p0.001), with less search effort in segments lying more parallel to the road(Fig. 22). Partly as a consequence of this, and partly because of non-uniform haredistribution, the observed density of hares relative to the survey point exhibited a highlynon-uniform distribution with respect to angle from road, with lower frequencies close tothe road and greatest numbers being observed directly perpendicular to the road fromthe survey points. Using measured radial distances from the survey point (Fig. 23a)and calculated perpendicular distances from the road (Fig. 23b), the distribution of hareclusters exhibited a pronounced shoulder. Regions EastNorth-westSouth-westAdjusted mean hare count(hares.km 0.00.10.20.30.40.5 2006 2007 Hare Survey of Ireland 2006/07 39Fig. 20Distribution of the number of survey points within each survey square. Data from2006 and 2007 combined and the sample size (n) in each case is shown in parentheses abovethe bars.Fig. 21Proportion of survey points where each sector was visible across all field sectors.Sectors ‘E’ is perpendicular to the surveyor on the right side of the road (90-100) and sector ‘N’is perpendicular to the surveyor on the left side of the road (260-280). Number of survey points 12345Proportion of squares 0.00.20.40.60.81.0 (25)(26)(45)(144)(941) Sectors ABCDEFGHIJKLMNOPQRProportion of points 0.00.20.40.60.81.0 Hare Survey of Ireland 2006/07 40 Distance (m) Frequency 1020304050 50100150200250 Distance (m) Frequency 1020304050 50100150200250Fig. 22The positions of detected hares (small open circles) relative to the survey point (boldopen circle at 0,0) and the road (dashed line). The intensity of colour is a smoothrepresentation of the density of hare detections in space, with highest relative densities beingwhite and lowest being red. Note that if the assumptions of conventional Distance sampling hadbeen met a single hotspot of density would lie directly over the observed at co-ordinates 0,0.(a)(b)Fig. 23Frequency of distances of hare clusters measured (a) radially from survey points and(b) perpendicularly from the road for the 2007 survey. Hare Survey of Ireland 2006/07 41Customised Distance Sampling methods were used to estimate the parameters of boththe detection function and density gradient of hares, while simultaneously accountingfor the non-uniform angular sampling bias. Angular bias was not measured in 2006,however, data from 2007 were used to correct the 2006 data. A half-normal detectionfunction was used with three models of density gradient including (a) half-normal, (b)hazard-rate and (c) Gaussian-based (Fig. 24). All models were right-truncated at adistance of 250m. These models assume that true hare density in each sector isindependent of that sector being visible.One troubling issue was that there was a subset of survey points where overall surveyeffort was noted, but the visibility in each sector was not recorded. This subset of datahad a significantly higher median total field of view value (0.67 per survey square) thanthose squares in which the field of view breakdown was known (0.55 per surveysquare; Mann-Whitney W = 1281504, two-tailed p0.001). Without data on the field ofview broken down by sector, models of density gradient assume that effort distributionis the same for all survey points; this is evidently not the case. This may haveintroduced further bias, but additional data would be required to determine this.Fig. 24Estimated detection function (lines peaking at the left) and density gradient (linespeaking at the right) ignoring angular sampling bias (black lines) and accounting for it (bluelines) estimated using a (a) half-normal, (b) hazard-rate and (c) Gaussian based model showingthe AIC value used for model selection. Hare Survey of Ireland 2006/07 42 Frequency 10121416 Distance (m)50100150200250 Frequency 20406080100120140 Distance (m)50100150200250When using data from the points alone, all three models used to estimate the perceiveddensity gradient of hares from the road in both years had similar AIC values implyingthey were equally good representations of the density gradient (Fig. 24). This is aconcern because the models lead to very different estimates of density andabundance. The point transect data were, however, supplemented by the data onperpendicular distance of hare detections from the road from the night walked transfieldtransects. Use of these data which establish the extent to which hares actually avoidroads, allowed the Gaussian-based model to be chosen above others on the basis ofAIC.A total of 59 hares (in 42 groups) were observed on 432 night-walked transfieldtransect surveys. Six hare detections were made beyond 250m from the road andwere excluded from further analyses as these would have been undetectable to anypoint surveys from the road. Unlike the point transect data, in which animals fartherfrom the road are sampled with lower probability, transfield transect data can provide adirect sample from the distribution of distances of hares from roads (Fig. 25). As thetotal length of walked transfield transects varied (transects were walked perpendicularto the road until the first boundary was met), transfield data actually over-sample closedistances relative to further distances. We refer to this decline in relative samplingintensity with distance as the "attenuation effect", and this was taken into account in theanalysis (Fig. 26).(a) (b)Fig. 25Frequency of (a) night-walked transfield transects length and (b) perpendiculardistances of detected hare clusters from the road during 2006 and 2007 combined. Hare Survey of Ireland 2006/07 43 Col 1 Distance (m) 050100150200250Attenuation effectat(x) 0.00.20.40.60.81.0 Distance (m) 050100150200250Estimated density gradientD(x) 0.0000.0020.0040.0060.008 No attenuation effectAttentuation effect Distance (m) 050100150200250Estimated true density gradient 0.0000.0020.0040.0060.008 (a) (b)Fig. 26(a)The attenuation effect due to the varying lengths of transfield transects and (b) itseffect on the estimated density gradient of hares from on-road point surveys.The estimated density gradient obtained from both the transfield transect data withattenuation and the point transect data (taking account of non-uniform angular effort) inthe analysis is shown in Fig. 26 (using a Gaussian-based model for density gradient).The estimated modal density of hares occurred at 130m (Fig. 27), not 250m as wasestimated in models that did not include the transfield transect data.Fig. 27The estimated density gradient derived from on-road point surveys and walkedtransfield transect surveys with respect to distance from the road. Note modal density occurs at130m from the road. Hare Survey of Ireland 2006/07 44Without taking any biases into account and using conventional distance analyses,estimated hare density would have been 1.72 hares/km in 2006 and 2.29 hares/km in2007. Accounting for the sources of bias identified above and using custom Distance-analysis methods, hare density was estimated to be 3.33 hares/km in 2006 and 7.66hares/km in 2007. Hare density increased significantly between 2006 and 2007(pairwise comparison p0.01, Table 6). Hare densities did not vary significantlybetween geographic regions in either year (pairwise comparison p=NS). During 2006,hare density did not differ significantly among habitats. During 2007, hare densitieswere significantly higher on pastoral farmland than both bog, moor, heath & marsh andother marginal habitats (pairwise comparison p0.01, Table 7) but did not differ frommixed farmland.Table 6Density and abundance estimates with 95% confidence intervals in parentheses forIrish hares during 2006 and 2007 stratified by geographic region. The total area of Republic ofIreland = 69,878km, West and North-west = 22,580km, East = 23,015km and South-west =24,283km20062007 RegionMean density(hares/kmMeanabundanceMean density(hares/kmMeanabundance West and North-west2.62(1.30-4.67)59,000(29,000-105,000)7.63(4.58-15.19)172,000(104,000-343,000) East4.20(2.32-8.20)97,000(53,000-189,000 )9.13(4.66-17.56)210,000(107,000-404,000)South-west3.16(1.35-6.78)77,000(33,000-165,000)6.31(3.08-11.81)153,000(75,000-287,000)Republic of Ireland(All regions)3.33*(1.97-6.21)233,000(138,000-434,000)7.66*(4.83-14.29)535,000(338,000-999,000) Superscript lower case letters indicate no statistically significant difference between estimates. Pairwisecomparison are only between regions within years.*Overall density significantly different between 2006 and 2007Table 7Density and abundance estimates with 95% confidence intervals in parentheses forIrish hares during 2006 and 2007 stratified by habitat type. The total area of Bog, moor heath &marsh = 12,159km, Mixed farmland = 10,873km, Pastoral farmland = 37,315km and Othermarginal habitats = 9,531km20062007 HabitatsMean density(hares/kmMeanabundanceMean density(hares/kmMeanabundance Bog, moor, heath & marsh5.11(1.62-12.47)62,000(20,000-152,000)2.89(1.27-6.53)35,000(15,400-79,500) Mixed farmland3.06(1.51-5.41)33,000(16,000-59,000)7.96a,b(2.96-17.49)87,000(32,000-190,000)Pastoral farmland2.97(1.57-5.36)111,000(59,000-200,000)9.18(5.96-17.11)343,000(223,000-641,100)Other marginal habitats2.64(0.79-5.07)25,000(7,500-48,000)3.58(0.001-8.14)34,100(0-77,800)Republic of Ireland(All habitats)3.29(1.94-6.06)231,000(137,000-425,000)7.19(5.46-11.07)499,000(326,000-966,000) a,b Superscript lower case letters indicate no statistically significant difference between estimates.Pairwise comparison are only between habitats within years. Hare Survey of Ireland 2006/07 453.4 DiscussionRecognising that the task of estimating terrestrial mammal abundance is fraught withdifficulties, particularly if the study species is predominantly nocturnal and exhibitscomplicating behaviour such as non-random animal distribution patterns (e.g.avoidance of roads); we have developed novel field survey techniques and innovativeanalytical solutions to the challenges of hare surveys.The number of hares seen in survey squares could, with consistent sampling effort atrepeated sites, be adopted as a rough index of hare abundance. However, manyauthors have highlighted problems associated with analyses of relative abundance dueto sampling biases caused by variation in visibility and animal behaviour (Mahon,Banks & Dickman 1998; Edwards et al., 2000). It is therefore necessary to interpretdifferences in sighting frequencies with caution. Hare abundance was positivelyinfluenced by the extent of pastoral grasslands within the immediate vicinity (within the1km survey square) provided the local landscape (defined as the surrounding 10kmgrid square) was interspersed by rough areas such as bog, moor, heath and marsh.These results are to some degree consistent with previous work in Northern Irelandsuggesting that hares require a patchwork of grassland habitats and rough rushyhabitats to provide both quality grazing and suitable shelter (Reid et al., 2007). Rabbitabundance had a negative relationship with the number of hares seen. Grazing affectsthe availability of herbaceous vegetation (MacCracken & Hansen, 1982) andcompetition between sympatric leporids is known (Homolka, 1987; Chapuis, 1990;Flux, 1993).By using distance-sampling it was possible to estimate absolute density of hares andthereby improve on simple encounter rate indices. The level of detail and analysiswas, however, rather involved because many of the central assumptions of distance-sampling theory are broken by point surveys of hares conducted from roads.Assumptions relating to measurement of distances and angles were fully met. Critically,however, hares do not distribute themselves uniformly with respect to roads.Furthermore, roadside hedges (a typical feature of the Irish landscape) obscured visionin the portions of the point transects immediately adjacent to the road. Previousresearchers have dealt with these biases by left truncation and/or grouping animaldetections into bins. Whilst these techniques are commonly applied they areinadequate for dealing with the major biases identified here and would have resulted inflawed estimates of hare abundance. We developed novel distance samplingestimation methods to deal with the particular nature of these surveys.Despite the analytical complications of working from roads, for Irish hare surveys,spotlight counts from minor roads is the only realistic way of surveying enough land toobtain the minimum number of sightings required to estimate density with some degreeof precision. In Ireland, particularly rural areas, both road density and traffic volumes Hare Survey of Ireland 2006/07 46are low, especially at night, and recent radio-tracking experience suggests that minorroads were neither avoided nor used preferentially by Irish hares during either the dayor night (Neil Reid, pers. obs.). It seems likely that the avoidance behaviour observedwas in reference to field boundaries in general rather than roads in particular. Howeverplausible this argument may be, the calculation of general hare abundance based onsurveys within the 250m strip either side of roads rests on the untested assumption thatthe density of hares in this strip is not significantly different from that in the widercountryside. If this assumption is wrong, and there is higher or lower hare densityoutside of this area, the densities provided here will be biased for the area beyond theimmediate vicinity of roads.If the underlying assumptions of our survey and analytical methods hold, theabundance of Irish hares in the Republic of Ireland is in the order of several hundredthousand albeit with wide confidence limits. The estimated density of 7.66 hares/km(95% CI 4.83-14.29) in the Republic of Ireland is entirely consistent with the estimatefor Northern Ireland of 7.99 hares/km2 (95% CI 4.18-14.46) during early 2007 (Reid, etal. 2007b), using comparable survey methods and analytical techniques. Theestimated abundance of hares in the Republic of Ireland taken together with the resultsof the Northern Ireland hare survey in 2007 (Reid, et al. 2007b), suggest that therewere 649,000 hares (95% CI 432,000-1,198,000) in Ireland as a whole during early2007. Irish hare densities have been reported to range from 1.0-126.6 hares/km(Fairley, 2001; Jeffrey, 1996), with current estimates being comparable to that recordedon mixed farmland during winter in Kildare (6.8 hares/km; Whelan, 1985). Scottishmountain hare populations have been shown to fluctuate between 2-59 times theminimum density (Watson & Hewson, 1973). In common with hare populationselsewhere (Watson & Hewson, 1973; Krebs et al., 2001), the Irish hare has thecapacity for dramatic short-term population change and it is plausible that thepopulation could have more than doubled between 2006 and 2007. Local weatherconditions and climatic events have been suggested as driving forces for mountainhare population change (see Section 2.2 Game bag records). It is noteworthy thatmost of the change in populations between 2006 and 2007 was ascribed to change indensities on pastoral farmland. This may reflect the importance of grassland habitatsto Irish hares, particularly with regards to management practices. Specifically, a delayin silage cutting during 2006 caused by unusually wet conditions during late spring andearly summer may have facilitated leveret maturation, survival and recruitment duringthat year. Furthermore, 2006 was one of the highest North Atlantic Oscillation Indexyears in the last decade with mild autumn and winter conditions. An extended period ofgrass growth may have extended hare reproduction and aided over-winter survival ofadults.Between-year comparisons of densities within different habitats could not be made.Estimates for bog, moor, heath and marsh in 2006 are based on few sightings andhave extremely wide confidence intervals so should be treated with caution. It ispossible that under-sampling of habitats with respect to vegetation height may have Hare Survey of Ireland 2006/07 47biased detection rates. Densities in 2007 are more reliable than 2006 due to anincreased number of sightings. The prevalence of suitable pastoral grasslandthroughout the three geographic regions was similar; consequently, regionaldifferences in mean hare densities are unremarkable.In relation to Article 2 of the EC Habitats Directive, without temporal data comparableto the current survey there is little information by which to define “favourableconservation status” for the Irish hare. All that can be said with certainty is that totalabundance of Irish hares in Ireland is higher than expected based on previous NorthernIreland hare surveys and that given favourable environmental conditions the populationappears robust enough to undergo an apparent doubling within one year. It seemslikely that the greatest potential for successful anthropogenic intervention in harepopulations, in line with the objectives of the Irish hare Species Action Plan (Anon,2005), is in areas of extensive pastoral farmland.The brown hare is well established in Northern Ireland (Reid & Montgomery, 2007).Whilst not confirmed as present in the Republic of Ireland during these surveys, itspresence cannot be ruled out. Given the difficulty in distinguishing the brown hare fromthe native Irish hare and the frequently localised nature of introduced populations,further work is required, particular in those areas in which anecdotal reports have beenmadeIn conclusion, the custom Distance-sampling methods developed here are useful fordemonstrating differences in hare density over time, regions and landclasses. Thecurrent study is not directly comparable to previous work on Irish hare distribution in theRepublic of Ireland (Ni Lamhna, 1979; Smal, 1995; Fig. 1.2), however, the speciesremains widespread and common, and has been shown to exhibit substantialinterannual fluctuations in density. Hare Survey of Ireland 2006/07 484General discussionThis is the first study to establish long-term historical population trends and providerobust estimates of current and recent density and abundance of Irish hares in theRepublic of Ireland. Historically, Irish hare populations may have been many timeshigher than the current population and, based on game-bag analysis, a long-termdecline in abundance of hares in Ireland coincided with similar declines in Great Britainand Europe. Changes in land management practises during the early 20th century andongoing agricultural intensification throughout the mid-late 20th century are the mostinfluential amongst factors that have contributed to historical declines of hares (Smithet al. 2005).Irish populations, similar to hares elsewhere, exhibit marked interannual andmultiannual fluctuations. Intrinsic density dependence and extrinsic climatic factorsclearly influence annual population growth. Interannual fluctuations remain a feature ofthe contemporary hare population with total estimated abundance in the Republic ofIreland increasing significantly from 233,000 to 535,000 hares between 2006 and 2007.Such dramatic short-term change is consistent with the fluctuations observed inhistorical game bag indices, suggesting that substantial changes in the hare populationare not unusual.Interpretation of short-term changes should be made in the context of long-term time-series. General population declines can be ongoing, despite short term increases. Inthis case, there are no reliable data to establish recent population trends. Despite thelikelihood that recent studies of Irish hare population status in Northern Ireland containnegative bias, the interannual fluctuations identified are likely to reflect genuine changein the hare population. The current All-Ireland population of Irish hares is estimated at649,000 hares (95% CI 432,000-1,198,000; this study; Reid et al. 2007b).The Distance-sampling methodologies, both field surveys and statistical models,developed in this study have proven useful and robust tools for demonstrating harepopulation change over time. However, we have to stress that care must be taken toaccount for biases introduced not only from sampling protocols but also animalbehaviour, when assessing hare abundance using these methods and surveying fromroads. Further work is desirable to verify the assumption that the density of the harepopulation is similar in the area adjacent to roads and the rest of the countryside.Establishing a population increase by 2010, as required by the Irish hare SpeciesAction Plan, needs to be evaluated carefully as a target. Given what is known offluctuations in the Irish hare population, a doubling, or indeed a halving of thepopulation from one year to the next may not be unusual and cannot be interpreted asa measure of success or failure of conservation strategies. Consequently, regularcontinued surveillance of the population is necessary to establish long-term populationtrends. Hare Survey of Ireland 2006/07 495RecommendationsVariation in the Irish hare population can be substantial over a short period of time.When fluctuations are pronounced populations must be monitored for longer todetermine trends. Multiannual cycles complicate monitoring further and would requirea much longer time-series. If a full understanding of contemporary trends is required,annual population monitoring in some considerable detail will be required. Undertakenat the scale applied here, such monitoring would place considerable strain on existingresources and manpower. Consequently, it will be necessary to carefully evaluate thepurpose of monitoring in order to design a cost-effective approach.For comparability between surveys over time, a standard methodology must beadopted that is repeatable and provides widespread coverage with a large number ofstatistically independent replicates. Simple counts are labour intensive and relativelyeasy but are wholly inadequate for the calculation of national population estimates.Repeated observations by NPWS personnel of the same points over time, togetherwith recording of certain other metrics (distance and visibility) that would allow analysisby specialist contractors when resources permitted, may prove a compromise strategyfor routine determination of trends. No advantage is gained by adopting a simple countmethod, with no measurements of distance or visibility, over a Distance-samplingmethod as labour is only reduced marginally but potential biases are greatly enhanced.Consequently, future data collection should be based on the survey and analyticalmethods developed here.A cost effective tool to provide further information for monitoring the Irish harepopulation, particularly in areas where the species is exploited, would be to pilot thecollection of capture effort data by coursing clubs.The precise mechanisms that drive interannual and multiannual hare populationchange remain unknown. Evidently, such drivers can have a substantial impact onpopulation change. Without a better understanding of factors affecting hare populationgrowth, it is not possible to develop or implement measures for enhancing harepopulations.Conservation policies, such as the Irish hare SAP, would benefit from revision atregular intervals to account for emerging scientific information regarding the biologyand status of the species. The success of conservation strategies in increasing theIrish hare population should account for natural variation and periodicity exhibited bythe species. Care must be taken not only to establish realistic conservation targets,with some supportable means of achieving these, but also to ensure that the successor failure of SAP measures can be properly evaluated. One potential area of futureresearch is to evaluate the efficacy of the REPS scheme in maintaining and improvingsuitable hare habitat within areas of pastoral farmland. Hare Survey of Ireland 2006/07 506AcknowledgementsThanks to all the NPWS staff (Regional Staff and Headquarter Staff) whoenthusiastically participated in field surveys and provided additional sighting data andadvice.We are grateful to David Borchers, Tiago Marques and Charles Paxton at TheResearch Unit for Wildlife Population Assessment within the Centre for Research intoEcological and Environmental Modelling at the University of St. Andrews for providingtheir expertise during data analysis (Marques & Borchers, 2006; Paxton et al. 2007).We are also thankful to the Irish Coursing Club for their co-operation in the collationand interpretation of coursing records and Chris Smal and Sarah Feore who provideddata from the Badger and Habitat Survey of Ireland. Further thanks are due to JanePreston for health & safety and project management and to Alex Portig for assistancewith survey site selection.The project was commissioned and funded by NPWS, Department of Environment,Heritage and Local Government. Hare Survey of Ireland 2006/07 517ReferencesAbildgård, F., Andersen, J. & Barnorff-Nielsen, O (1972) The hare population (Lepuseuropaeus, Pallas) of Illumø Island, Denmark. A report on the analysis of the data from 1959to 1970. Danish Review of Game Biology, , 1-31.Akaike, H. (1983) Information measure and model selection. Bulletin of theInternationalStatistical Institute, 50(1), 277-291.Alves PC, Ferrand N, Suchentrunk F, Harris DJ (2003) Ancient introgression of Lepus timidusmtDNA into L. granatensis and L. europaeus in the Iberian Peninsula. MolecularPhylogenetics and Evolution, 27, 70–80.Andrejewski, R. & Jezierski, W. (1966) Studies on European hare. XI. Estimation of populationdensity and attempt to plan the yearly take of hares. Acta theriologica, 11; 433-488.Angell, J.K. (2001) Relation of size and displacement of the 300 mbar north circumpolar vortexto QBO, El Nino, and sunspot number, 1963-2000. Journal of Geophysical Research –Atmospheres, 106(D23): 31787-31794.Anonymous (1979) Convention on the conservation of European wildlife and natural habitatsBern Convention. Council of Europe, Strasbourg.Anonymous (1992) Convention on Biological Diversity. Rio de Janeiro. Brazil.Anonymous (2003) Review of non-native species policy - report of the working groupDepartment for Environment, Food and Rural Affairs DEFRA, London, UK.Anonymous (2005) All Ireland Species Action Plans: Irish Lady’s-tresses (Spiranthes romanzoffiana), Pollan (Coregonus autumnalis ), Irish hare (Lepus timidus hibernicus ), and Corncrake (Crex crex). Environment & Heritage Service, Department of Environment, Northern Ireland and the National Parks & Wildlife Service, Department of Environment,Heritage and Local Government, Republic of Ireland.Baghli A. & Verhagen R. (2003) The distribution and status of the polecat Mustela putorius inLuxembourg. Mammal review, 33; 57-68.Barrett-Hamilton, G.E.H. (1910) A History of British Mammals. Vol. , pp 325-348. London. UK.Battersby, J.E. & Greenwood, J.J.D. (2004). Monitoring terrestrial mammals in the UK: past,present and future, using lessons from the bird world. Mammal Review 34:3-29.Battersby, J. (Ed) & Tracking Mammals Partnership. (2005) UK Mammals: species Status andPopulation Trends. First Report by the Tracking Mammals Partnership. JNCC / TrackingMammals Partnership, Peterborough.Bearzi, G. (2003). Delphinus delphis (Mediterranean subpopulation). In: IUCN 2006. 2006 IUCNRed List of Threatened Species. www.iucnredlist.org Bell, T. (1837) History of British Quadrupeds, including the cetacea. 1st ed. pp 341. London.UK.Benner, T.C. (1999) Central England temperatures: long-term variability and teleconnections.International Journal of Climatology, 19(4):391-403.Bochnicek, J. & Hejda, P. (2006) Connections between the distribution of prevailing winds in thewinter Northern Hemisphere, solar/geomagnetic activity and the quasi-biennial oscillation(QBO) phase. Studia Geophysica Geodaetica, 50(2): 299-318. Hare Survey of Ireland 2006/07 52Boutin, S., Krebs, C. J., Boonstra, R. (1995). Population changes of the vertebrate communityduring a snowshoe hare cycle in Canada’s boreal forest. Oikos, 74: 69–80.Bröekhuizen, S. & Masskamp, F. (1982) Movement, home range and clustering in the Europeanhare (Lepus europaeus Pallas) in the Netherlands. Zeitschrift fur Saugetierkunde, 47;22-32.Buckland, S.T., D.R. Anderson, K.P. Burnham, J.L. Laake, D.L. Borchers & L. Thomas (2004)Advanced Distance Sampling. Oxford University Press. UK.Burnham, K.P., Anderson, D.R. (2002) Model selection and Multimodel Inference: A practicalinformation-theoretic approach, 2nd edn. Springer, New York, USA.Butler, C.J., Coughlin, A.D.S. & Fee, D.T. (1998) Precipitation at Armagh Observatory 1838-1997. Biology and Environment, Proceedings of the Royal Irish Academy, 98B(2): 123-140.Cary, J.R., and Keith, L.B. (1979). Reproductive change in the 10-year cycle of snowshoehares. Canadian Journal of Zoology, 57: 375–390Chapuis, J.L. (1990) Comparison of the diets of two sympatric lagomorphs, Lepus europaeusPallas and Oryctolagus cuniculus L. in an agro-ecosystem of the Ile-de-France.Zeitschrift fürSäugetierkunde, 55; 176–185.Choudhury, A. U. (1999)Status and Conservation of the Asian Elephant Elephas maximus innorth-eastern India. Mammal Review, 29(3), 141-173. Choudhury, A. U. (2002) Distribution and conservation of the Gaur Bos gaurus in the IndianSubcontinent. Mammal Review, 32, 199–226.CRAN (2007) The Comprehensive R Archive Network. http://cran.r-project.org/ Dingerkus, S.K. & Montgomery, W.I. (2002) A review of the status and decline in abundance ofthe Irish hare (Lepus timidus hibernicus) in Northern Ireland. Mammal Review, 32, 1-11.Donald, P.F. (1998) Changes in the abundance of invertebrates and plants on British farmland.British Wildlife, , 279–289.Edwards, G.P., de Preu, N.D., Shakeshaft, B.J. & Crealy, I.V. (2000) An evaluation of twomethods of assessing feral cat and dingo abundance in central Australia. Wildlife Research27, 143–149.EEA (2000) Corine Land Cover map 2000 – digital data. European Environment Agency.http://www.eea.europa.eu/ EEC 43/92 (1992) Directive on the Conservation of Natural Habitats of Wild Fauna and Flora.Official Journal of the European Union L, 206, 7Elton, C. S. & Nicholson, M. (1942). The ten-year cycle in numbers of the lynx in Canada.Journal of Animal Ecology, 11: 215-244.Fairley, J. (2001) A basket of weasels. Privately published, Belfast. UK.Feore, S.M. (1994) The distribution and abundance of the Badger Meles meles L. in NorthernIreland. Unpublished PhD thesis. Queen’s University Belfast.Fielding, A.H. & Haworth, P.F. (1995) Testing the generality of bird-habitat models.Conservation Biology, , 1466-1481.Flux, J.E.C. (1993) Relative effect of cats, myxomatosis, traditional control, or competitors inremoving rabbits from islands. New Zealand Journal of Zoology, 20; 13–18. Hare Survey of Ireland 2006/07 53Gross, J. W., L. C. Stoddart, and F. H. Wagner. (1974). Demographic analysis of a northernUtah jackrabbit population. Wildlife Monographs Number 40:1–68.Hall-Aspland, S., Sweeney, O., Tosh, D., Preston., P., Montgomery, W.I. & McDonald, R.A.(2006) Northern Ireland Irish hare survey 2006. Report prepared by Quercus for theEnvironment and Heritage Service (DOE, N.I.). UK.Hamill, R. (2001) A study of the genetic structure and phylogeography of Lepus timidus L.subspecies in Europe using microsatellite DNA and mtDNA. Unpublished PhD thesis,University College Dublin. Ireland.Hamill, R.M., Doyle, D. & Duke, E.J. (2006) Spatial patterns of genetic diversity acrossEuropean subspecies of mountain hare, Lepus timidus L. Heredity, 1-11.Harris, S., Morris, P., Wray, S. & Yalden, D. (1995) A Review of British Mammals: populationestimates and conservation status of British mammals other than cetaceans. JNCC,Peterborough. UK.Harris, S. & Yalden, D.W. (2004) An integrated monitoring programme for terrestrial mammalsin Britain. Mammal Review, 34 1/2; 157-167.Hayden, T. & Harrington, R. (2000) Exploring Irish mammals. Town House and Country houseLtd, Dublin. Ireland.Hellawell, J.M. (1991) Development of a rationale for monitoring. In Goldsmith B., Ed.,Monitoring for conservation and ecology. Chapman and Hall, London, pp 1-14.Hodges, K.E. (2000) Ecology of snowshoe hares in southern boreal and montane forests. InEcology and conservation of lynx in the United States. USDA For. Serv. Gen. Tech. Rep.RMRS-GTR-30WWW, 163–206.Homolka, M. (1987) A comparison of the trophic niches of Lepus europaeus and Oryctolaguscuniculus. Folia Zoologica, 36; 307–317.Hughes, M., Montgomery, W.I. & Prodöhl, P. (2006) Population genetic structure andsystematics of the Irish Hare. Report prepared by Quercus for the Environment and HeritageService (DOE, N.I.). UK.Hutchings, M.R. & Harris, S. (1996) The current status of the brown hare Lepus europaeus inBritain. Joint Nature Conservation Committee, Peterborough. UK.Hurrell, J. W., & H. van Loon (1997) Decadal Variations in Climate associated with the NorthAtlantic Oscillation. Climate Change, 36, 301-326.Jeffrey, R. (1996) Aspects of the ecology and behaviour of the Irish hare (Lepus timidushibernicus Bell, 1837) on lowland farmland. Unpublished PhD thesis. Trinity College Dublin.Kauhala, K., Helle, P. & Hiltunen, M. (2005) Population dynamics of mountain hare Lepustimidus populations in Finland. Wildlife Biology, : 299-307.Keith, L. B. (1963) Wildlife's Ten-Year Cycle. Univ. of Wisconsin Press, Madison.Keith, L. B., J. R. Carey, O. J. Rongstad & M. C. Brittingham (1984) Demography and ecologyof a declining snowshoe hare population. Wildlife Monographs, 90:1-43Keith, L. B. (1990) Dynamics of snowshoe hare populations. Current Mammalogy, : 119–195.Kodera, K. & Kuroda, Y. (2005) A possible mechanism of solar modulation of the spatialstructure of the North Atlantic Oscillation. Journal of Geophysical Research – Atmospheres,110(D2): D02111. Hare Survey of Ireland 2006/07 54Korpimaki, E., Brown, P.R., Jacob, J. & Pech, R.P. (2004) The puzzles of population cycles andoutbreaks of small mammals solved? Bioscience, 54(12): 1071-1079.Korpimaki, E., Norrdahl, K., Huitu, O. & Klemola, T. (2005) Predator-induced synchrony inpopulation oscillations of coexisting small mammal species. Proceedings of the Royal SocietyB-Biological Sciences, 272 (1559): 193-202.Krebs, C.J., Gilbert, B.S., Boutin, S., Sinclair, A.R.E., and Smith, J.N.M. (1986) Populationbiology of snowshoe hares. I. Demography of food-supplemented populations in the southernYukon. Journal of Animal Ecology55: 963–982.Krebs, C.J., Boutin, S., Boonstra, R., Sinclair, A.R.E., Smith, J.N.M., Dale, M.R.T., Martin, K.,and Turkington, R. (1995) Impact of food and predation on the snowshoe hare cycle. Science(Washington, D.C.), 269: 1112–1115.Krebs, C. J., Boonstra, R., Boutin, S. & Sinclair, A. R. E. (2001) What drives the 10-year cycle ofsnowshoe hares? Bioscience, 51, 25–35.Kruuk, L.E.B., Clutton-Brock, T.H., Albon, S.D., Pemberton, J.M. & Guiness, F.E. (1999)Population density affects sex ratio variation in red deer. Nature, 399: 459-461.Lamb, P.J., & R.A. Peppler (1987) North Atlantic Oscillation: concept and application. Bulletinof Amercian Meterological Society, 68; 1217-1225.Langbein, J., Hutchings, M.R., Harris, S., Stoate, C., Tapper, S.C. & Wray, S. (1999)Techniques for assessing the abundance of brown hares Lepus europaeus. Mammal Review29, 93-116.Linnaeus, C. (1758) Systema Naturaeper regna tria naturae, secundum classes, ordines,genera, species, cum characteribus, differentiis, synonymis, locis. 10th edn. Stockholm.Sweden.Lukianova, R. & Alekseev, G. (2004) Long-term correlation between the NAO and solar activity.Solar Physics, 224(1): 445-454.MacCracken, J.G. & Hansen, R.M. (1982) Herbaceous vegetation of habitat used by BlacktailJackrabbits and Nuttall Cottontails in Southeastern Idaho. America Midlands Naturalist, 107180–184Macdonald, D.W., Mace, G. & Rushton, S.P. (1998). Proposals for Future Monitoring of BritishMammals. Department of the Environment, Transport and the Regions / Joint NatureConservation Committee.Mahon, P.S., Banks, P.B. & Dickman, C.R. (1998) Population indices for wild carnivores: acritical study in sand-dune habitat, south-western Queensland. Wildlife Research, 25, 11–22.Mallon, D., Wheeler, P., Whiteley, D. & Yalden, D.W. (2003). Mountain hares in the PeakDistrict. British Wildlife, 15; 110–116.Matheson, C. (1941) The rabbit and the hare in Wales. Antiquity, 1941; 371-381.McAney, K. (2006) A conservation plan for Irish vesper bats. Irish Wildlife Manuals No. 20.National Parks and Wildlife Service, Department of the Environment, Heritage and LocalGovernment, Dublin, Ireland.McCullagh, P. & J.A. Nelder. (1989) Generalized Linear Models. Chapman and Hall: London.Middleton, A.D. (1934). Periodic fluctuations in British Game. Journal of Animal Ecology, 231–249. Hare Survey of Ireland 2006/07 55Mitchell-Jones, A.J., Amori, G., Bogdanowicz, W., Krystufek, B., Reijnders, P.J.H.,Spitzenberger, F., Stubbe, M., Thissen, J.B.M., Vohralik, V. & Zima, J. (1999) Atlas ofEuropean Mammals. Academic Press, London.Newey, S. & Thirgood, S. (2004) Parasite-mediated reduction in fecundity of mountain hares.Proceedings of the Royal Society B-Biological Sciences, 271(Suppl.); 543-545.Newey, S., Shaw, D.J., Kirby, A., Monteith, P., Hudson, P.J. & Thirgood, S.J. (2005)Prevalence, intensity and aggregation of intestinal parasites in mountain hares and theirpotential impact on population dynamics. International Journal of Parasitology, 35, 367-363.Ní Lamhna, E. C. (1979) Provisional distribution Atlas of Amphibians, Reptiles and Mammals inIreland. 2nd Edition. An Foras Forbatha. Ireland.Ogi, M., Yamazaki, K. & Tachibana, Y. (2003) Solar cycle modulation of the seasonal linkage ofthe North Atlantic Oscillation (NAO). Geophysical Letters, 30(22): Art. Number 2170.O’Mahony, D. & Montgomery, W.I. (2001) The distribution, abundance and habitat use of theIrish hare (Lepus timidus hibernicus) in upland and lowland areas of Co. Antrim and Co.Down, Northern Ireland. Report prepared by Queen’s University Belfast for the Environmentand Heritage Service (DOE, N.I.). UK.Pannekoek, J. & van Strien, A. (2005) TRIM 3 Manual: Trends & Indices for Monitoring data.Statistics Netherlands.Patterson, H.D. & Thompson, R. (1971) Recovery of interblock information when block sizes areunequal. Biometrika, 58: 545-554.Patterson, B.R. & Power, V.A. (2001) Contributions of forage competition, harvest, and climatefluctuation to changes in population growth of northern white-tailed deer. Oecologia, 128244–255.Pépin, D. (1985) Spring density and day time distribution of the European hare in relation to thehabitat in an open field agrosystem. Zeitschriff für Säugetierkunde, 51, 79-86.Perez, J.M., Granados, J.E., Soriguer, R.C., Fandos, P., Marquez, F.J., and Crampe, J.P.(2002) Distribution, status and conservation problems of the Spanish ibex, Capra pyrenaica(Mammalia: Artiodactyla). Mammal Rev.32(1):26-39.Pielowski, Z. (1990) Über die Abhängigkeit der Besatzdichte und anderer Populationsparameterdes Hasen von der Agrarstruktur und landwirtschaftlichen Aktivitäten. Beiträge Zur Jagd- undWildforschung, 17, 147–156.Post, E. & Stenseth, N.C. (1999) Climatic variability, plant phenology, and northern ungulates.Ecology, 80(4): 1322-1339.Preston, C.D., Telfer, M.G., Arnold, H.R., Carey, P.D., Cooper, J.M., Dines, T.D., Hill, M.O.,Pearman, D.A., Roy, D.B. & Smart, S.M. (2002) The Changing Flora of the UK. DEFRA:Department for Environment, Food & Rural Affairs , London. UK.Preston, J., Prodöhl, P., Portig, A & Montgomery, W.I. (2003) The Northern Ireland Irish HareLepus timidus hibernicus Survey 2002. Report prepared by Queen's University of Belfast forthe Environment and Heritage Service (DOE, N.I.). UK.Quinn, G.P. & Keough, M.J. (2002) Experimental design and data analysis for biologistsCambrigde University Press, Cambridge, UK.Ranta, E., Lindstrom, J., Kaitala, V., Kokko, H., Linden, L. & Helle, E. (1997) Solar activity andhare dynamics: a crosscontinential comparison. American Naturalist, 149, 765-775. Hare Survey of Ireland 2006/07 56Reeves, R.R. (2002) The origins and character of ‘aboriginal subsistence’ whaling: a globalreview. Mammal Review,32: 71-106.Reid, N. (2006) The conservation ecology of the Irish hare (Lepus timidus hibernicus).Unpublished PhD thesis. Queen’s University Belfast.Reid, N., Montgomery, W.I. & McDonald, R.A. (2007) Mammals and agri-environment schemes:hare haven or pest paradise? Journal of Applied Ecology, doi: 10.1111/j.1365- 2664.2007.01336.x Reid, N. & Montgomery, W.I. (2007) Is naturalisation of the brown hare in Ireland a threat to theendemic Irish hare? Biology and Environment: Proceedings of the Royal Irish Academy107B, 1-10.Reid, N., Sweeney, O., Wilson, C., Preston, S.J., Montgomery, W.I. & McDonald, R.A. (2007b)Northern Ireland Irish hare survey 2007. Report prepared by Quercus for the Environment andHeritage Service (DOE, N.I.). UK.Reid, N., Montgomery, W.I. & McDonald, R.A. (2007) Factors associated with hare mortalityduring coursing. Animal Welfare, 16 (4).Reynolds, J.C., O’Mahony, D.O. & Aebischer, N.J. (2006) Implications of ‘cyclical’ populationdynamics for the conservation of the Irish hare (Lepus timidus hibernicus). Journal ofZoology, 270(3); 408-413.Royama, T. (1992) Analytical population dynamics. Chapman & Hall, New York. USA.Schmidt, N.M., Asferg, T. & Forchhammer, M,C. (2004) Long-term patterns in European brownhare population dynamics in Denmark: effects of agriculture, predation and climatic. BMCEcology, (15).Selvas, V. (2006) UV-B-induced plant stress as a possible cause of ten-year hare cycles.Population Ecology, 48(1): 71-77.Sinclair, A.R.E., Gosline, I.M., Holdsworth, G., Krebs, C.J., Boutin, S., Smith, I.N.M., Boonstra,R. & Dale, M. (1993) Can the solar-cycle and climate synchronize the snowshoe hare cycle inCanada - Evidence from tree rings and ice cores. American Naturalist, 141(2): 173-198.Sinclair, A. R. E., Krebs, C.J., Smith, J. M. N. & Boutin, S. (1988) Population biology ofsnowshoe hares. III. Nutrition, plant secondary compounds and food limitation. Journal ofAnimal Ecology 57: 787–806.Smal, C. (1995) The badger and habitat survey of Ireland. Report to NPWS, Department ofEnvironment, Heritage and Local Government. Government Publications, Dublin. ISBN 0-7076-1604-2.Smith, C.H. (1983) Spatial trends in Canadian snowshoe hare, Lepus americanus, populationcycles. Canadian Field Naturalist, 97: 151-160.Smith, R.K., Vaughan-Jennings, N. Robinson, A. & Harris, S. (2004) Conservation of Europeanhares Lepus europaeus in Britain: is increasing habitat heterogeneity in farmland the answer?Journal of Applied Ecology, 41, 1092-1102.Smith, R.K., Vaughan-Jennings & Harris, S. (2005) A quantitative analysis of the abundanceand demography of European hares Lepus europaeus in relation to habitat type, intensity ofagriculture and climate. Mammal Review, 35(1), 1-24.Stefan, C.I. (1998) Reproduction and pre-weaning juvenile survival in a cyclical population ofsnowshoe hares. MSc. thesis, University of British Columbia, Vancouver. Canada. Hare Survey of Ireland 2006/07 57Stenseth, N.C., Chan, K.-S., Tong, H., Boonstra, R., Boutin, R., Krebs, C.J., Post, E.,O’Donoghue, M., Yoccoz, N.G., Forchhammer, M.C. & Hurrell, J.W. (1999) Common dynamicstructure of Canada lynx populations within three climatic regions. Science285, 1071-1073.Stenseth, N.C., Mysterud, A., Ottersen, G., Hurrell, J.W., Chan, K.S., Lima, M. (2002) Ecologicaleffects of climate fluctuations. Science, 297(5585): 1292-1296.Stenseth, N.C., Ottersen, G., Hurrell, J.W. Mysterud, A., Lima, M., Chan, K.S., Yoccoz, N.G. &Adlandsvik, B. (2003) Studying climate effects on ecology through the use of climate indices:the North Atlantic Oscillation, El Nino Southern Oscillation and beyond. Proceedings of theRoyal Society of London B-Biological Series, 270(1529): 2087-2096.Stokes, K., O’Neill, K. and McDonald, R.A. (2006) Invasive species in Ireland. Report toEnvironment and Heritage Service and National Parks and Wildlife Service by Quercus,Queen’s University. Environment and Heritage Service, Belfast and National Parks andWildlife Service, Dublin.Strandgaard, H. & Asferg, T. (1980) The Danish bag record II. Fluctuations and trends in thebag record in the years 1941-76 and the geographical distribution of the bags in 1976.Danish Review of Game Biology, 11, 1-112.Tapper, S. & Parsons, N, (1984) The changing status of the brown hare Lepus capensis L. inBritain. Mammal Review, 14; 57-70.Tapper, S.C. (1987) Cycles in game bag records of hares and rabbits in Britain. Symposia ofthe Zoological Society of London, 58, 79-98.Tapper, S.C. (1992) Game Heritage: an Ecological Review from Shooting and Gamekeepingrecords. Game Conservancy, Fordingbridge, UK.Thulin, C.G. (2003) The distribution of Mountain Hares (Lepus timidus, L. 1758) in Europe: Achallenge from Brown Hares (L. europaeus, Pall. 1778)? Mammal Review, 33: 29-42.Toms, M.P., Siriwardena, G.M. & Greenwood, J.J.D. (1999) Developing a mammal monitoringprogramme for the United Kingdom. BTO Research Report Number 223. British Trust forOrnithology, Thetford. UK.Tosh, D., Towers, R., Preston, J., Portig, A., McDonald, R.A. & Montgomery, W.I. (2004)Northern Ireland Irish hare survey 2004. Report prepared by Quercus for the Environment andHeritage Service (DOE, N.I.). UK.Tosh, D., Brown, S., Preston, J., Montgomery, W.I., Reid, N., Marques, T.A., Borchers, D.L.,Buckland, S.T. & McDonald, R.A. (2005) Northern Ireland Irish hare survey 2005. Reportprepared by Quercus for the Environment and Heritage Service (DOE, N.I.). UK.Tourpali, K., Schuurmans, C.J.E., van Dorland, R., Steil, B., Bruhl, C. & Manzini, E. (2005) Solarcycle modulation of the Arctic Oscillation in a chemistry-climate model. GeophysicalResearch Letters, 32(17): L17803.Trostel, K., Sinclair, A. R. E., Walters, C. & Krebs, C.J. (1987). Can predation cause the 10-yearhare cycle? Oecologia 74: 185–193.Versteegh, G.J.M. (2005) Solar forcing of climate 2: Evidence from the past. Space ScienceReviews, 120(3-4): 243-286.Walker, J. & Fairley, J.S. (1968) Winter food of Irish hares in County Antrim, Northern Ireland.Journal of Mammalogy,49, 783-785.Watson, A., R. Hewson, D. Jenkins, & P. Parr. (1973) Population densities of mountain harescompared with red grouse on Scottish moors. Oikos, 24; 225-230. Hare Survey of Ireland 2006/07 58Whelan, J. (1985) The population and distribution of the mountain hare (Lepus timidus L.) onfarmland. Irish Naturalists’ Journal, 21; 532-534.Whilde, A. (1993) Threatened mammals, birds, amphibians and fish in Ireland. Irish Red DataBook II: Vertebrates. HMSO, Belfast. UK.Wilson, J.D., Morris, A.J., Arroyo, B.E., Clark, S.C. & Bradbury, R.B. (1999) A review of theabundance and diversity of invertebrate and plant foods of granivorous birds in northernEurope in relation to agricultural change. Agriculture Ecosystems & Environment, 75, 13–30.Wolfe, A. Whelan, J. & Hayden, T.J. (1996) Dietary overlap between the Irish mountain hare,Lepus timidus hibernicus and the rabbit Oryctolagus cuniculus on coastal grassland. Biologyand Environment: Proceedings of the Royal Irish Academy, 96B, 89-95. Hare Survey of Ireland 2006/07 59AppendicesAppendix 1Contribution of records from each shooting estate to the gamebag database.Estate nameCountyProvinceYearsrepresentedPercentageof totalyears (%)Percentageof total harecount (%) Castle ArchdaleFermanaghUlster1859-18671899-194114.614.8 CastlegarGalwayConnaught1854-18561858-18601865-18751878-18901917-19218.85.2CromFermanaghUlster1858-18651895-18961924-195613.013.0DromolandClareConnaught1875-18842.91.8Favour RoyalTyroneUlster1928-19321.30.1FinnebrogueDownUlster1875-18863.65.8HeadfortMeathLeinster1865-18927.813.5KenmareKerryMunster1897-18981902-19071909-19100.60.2LissadellSligoConnaught1846-18471853-18631890-18951900-19341938-194516.928.8Louth HouseLouthLeinster1900-19010.30.1OakparkCarlowLeinster1878-18911894-18951897-18991946-19495.82.7ParkanaurTyroneUlster1876-19021919-195412.00.6Shane’s CastleAntrimUlster1921-19271929-19371956-19708.89.7Wicklow HouseWicklowLeinster1874-18863.63.7 Hare Survey of Ireland 2006/07 60Appendix 2Survey teams that participated in the Hare Survey of Ireland 2006/07.Survey teamsNumber ofpointssurveyed 40 teams Barry O'Donoghue & Penny Bartlett165Brian Haran, John Higgins & Eoin McGreal179Cameron Clotworthy, Maurice McDonald & Denis Strong71Carl Byrne et al.148Ciara Flynn & Roy Thompson141Ciarán Foley et al.171Clare Heardman & Paddy Graham226Cyril Saich & Sean Breen197Danny O'Keeffe & Donal Scannell261David Lyons & Emma Granville / Sinead Biggane160David McNamara & Miriam Crowley241Declan O'Donnell & Michael O'Sullivan57Denis O'Higgins et al.64Enda Mullen et al.275Eva Sweeney & Tim Burkitt219NPWS Research (Ferdia Marnell& Rebecca Jeffrey /Naomi Kingston / Deirdre Lynn)268Ger O'Donnell, Robert Holloway & Aonghus O'Donaill114Irene O'Brien, James Kilroy & Denis Strong144Jerry Higgins & Robert Steed69John Mathews et al.104Judit Kelemen et al.128Kathryn Freeman & Padraig O'Sullivan10Liam Lenihan & Seamus Hassett261Lorcan Scott & Jimi Conroy170Mark Byrne & Rebecca Teesdale112Maurice Eakin et al.294Neil Reid & Karina Dingerkus142Noel Buglar & Colm Malone197Paddy O'Sullivan & Tony Murray57Padraig O'Donnell & Denis O'Higgins54Pat Smiddy & Brian Duffy361Pat Vaughan et al.61Robert Lundy & Anthony Prins82Roy Thompson & John Carroll152Stefan Jones & Denis Ryan193Sue Moles et al.49Tim O'Donoghue & Paschal Dower266Tim Roderick et al.146Tony Murray & Paddy O'Sullivan90Tríona Finnen, Ciarán Foley, Sue Moles & Andrea Webb42TOTAL6141 61Appendix 3Hare Survey of Ireland form.