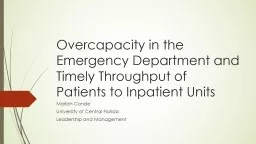
Jesse M Pines MD MBA MSCE Mark Zocchi George Washington University AHRQ Annual Meeting Disclosures Funding AHRQ Robert Wood Johnson Foundation National Priorities Partnership on Aging Department of Homeland Security ID: 130897
Download Presentation The PPT/PDF document "Hospital admission rates through the eme..." is the property of its rightful owner. Permission is granted to download and print the materials on this web site for personal, non-commercial use only, and to display it on your personal computer provided you do not modify the materials and that you retain all copyright notices contained in the materials. By downloading content from our website, you accept the terms of this agreement.
Slide1
Hospital admission rates through the emergency department: An important, expensive source of variation
Jesse M. Pines, MD, MBA, MSCE
Mark
Zocchi
George Washington University AHRQ Annual MeetingSlide2
Disclosures / FundingAHRQ
Robert Wood Johnson Foundation
National Priorities Partnership on Aging
Department of Homeland Security
Kingdom of Saudi ArabiaSlide3
Study teamRyan Mutter (AHRQ)
Mark Zocchi (GWU)
Andriana Hohlbauch (Thomson-Reuters)
David Ross (Thomson-Reuters)
Rachel Henke (Thomson-Reuters)Slide4
Introduction
HCUP Data: 125 million ED visits in 2008
15.5% admission rate
19.4 million hospitalizations
ED visit growth outpacing population growth
Why are EDs so popular?
Variable outpatient primary care availability
High-technology care has become the standard
Patient preferences / convenienceSlide5
IntroductionEDs are becoming the hospital
’
s front door
2008 v. 1997
43% of U.S. hospital admissions originated in the ED v. 37%
Mean charge per hospital stay - $29,046 v. $11,281.Slide6
Introduction
Why are ED admissions important?
Variation in inpatient charges are one of the major drivers of cost variation
Welch NEJM 1993Slide7
Introduction
Hospital Care Intensity (HCI)
www.dartmouthatlas.orgSlide8
Introduction
The perspective of the ED
Why admit someone?
Requires hospital resources
Critically ill
Is unable to access a timely resource outside the hospital
Has a high-risk presentation
Other reasonsSlide9
IntroductionVariation in the decision to admit from the ED
2-3 fold variation in the decision for primary care practices to hospitalize on emergency basis
Individual ED physician admission rates vary in Canada: 8% - 17%
Emergency physicians more likely to admit than family physicians or internal medicine physicians.
Differences in risk tolerance by individual physicians
Malpractice fear
Differences in patient & community resources Slide10
Introduction
Three categories
Clear cut admissions
AMI, stroke, severely-injured trauma
Clear cut discharges
Minor conditions
The remainder
Shades of graySlide11
Specific AimsExplore the regional variation in hospital-level ED admission rate across a wide sample of hospitals.
Determine predictors the hospital-level ED admission rate
Hospital-level factors, ED case-mix, and age-mix, and local economic factors that may drive differences in admission rate
Determine the contribution of local standards of care to explain hospital-level variation in admission rateSlide12
MethodsHCUP Data from 2008
All ED encounters from the 2,558 hospital-based EDs in the 28 states
Had a SID and a SEDD to HCUP in 2008
Calculate an admission rate for each ED
Transfers included as admissionsSlide13
MethodsExclusions
EDs removed
“
atypical characteristics
”
639 EDs removed with an annual volume < 8,408, the 25th percentile
Removed 4 EDs with admit rate > 49%
HCUP requirements
Counties < 2 hospitals not appear in a map
Additional exclusions
Empirical analysis of the effects of local practice patterns on a facility
’
s ED admission rate
Excluded 493 facilities that had the only ED in the county1,376 EDs: Final sampleSlide14
MethodsCalculated variables
County-level ED admission rate
Age-mix proportions
Insurance proportions
Case-mix: 25 most common CCS categories
Other characteristics
Hospital factors (2008 AHA survey)
Trauma-level (2008 TIEP survey)
Community-factors (2007-8 ARF)Slide15
MethodsMapped of ED admission rates at the county level.
Each ED
’
s admission rate was weighted by its annual volume
Counties that did not have a sufficient number of EDs or which are in states that did not provide a SID and a SEDD are in graySlide16
Methods
Adjusted analysis
Other factors associated with variations in ED admission rates using multivariate analysis
Hospital-level ED admission rate (dependent variable).
Natural log of the dependent variable and the continuous independent variables so that the coefficients on the
regressors
are
elasticities
.
Clustered at the hospital-levelSlide17
Results
Variable
Mean
Std. Dev.
Patient Characteristics of EDs
% of ED encounters resulting in admission or transfer
17.5
6.5
% of ED encounters paid by Medicare
21.7
7.16
% of ED encounters paid by Medicaid
20.8
11.0
% of ED encounters paid by private insurance
36.8
13.8
% of ED encounters by the uninsured
15.9
9.0
% of ED encounters paid by other source
4.8
4.5
% of ED encounters aged 0 to 17
18.8
7.5
% of ED encounters aged 18 to 34
28.2
5.1
% of ED encounters aged 35 to 54
25.4
3.8
% of ED encounters aged 55 to 64
9.1
1.7
% of ED encounters aged 65+
18.4
7.0Slide18
Results
Hospital Characteristics of EDs
Mean
Std Dev
Number of inpatient beds
265.5
225.0
ED volume
40,903.9
28,462.8
% of EDs at teaching hospitals
31.5
46.5
% of EDs in an urban location
87.3
33.3
% of EDs at public hospitals
12.1
32.6
%of EDs at for-profit hospitals
15.5
36.3
% of EDs at non-profit hospitals
72.4
44.7
% of EDs at Level 1 trauma centers
8.9
28.5
% of EDs at Level 2 trauma centers
9.7
29.7
% of EDs at Level 3 trauma centers
7.6
26.4
% of EDs at non-trauma centers
73.8
44.0
Socioeconomic and market characteristics of EDs
% of ED encounters resulting in admission, county level with subject ED excluded
18.0
7.1
Per capita income, county level
$39,954.1
13,268.7
General practice MDs providing patient care per 100,000, county level
29.1
13.8Slide19Slide20Slide21
Adjusted analysis
Variable
Coefficient
t-statistic
Intercept
2.746**
4.62
Patient Characteristics of EDs
% of ED encounters paid by Medicare
0.236**
6.61
% of ED encounters paid by Medicaid
0.003
0.19
% of ED encounters by the uninsured
0.007
1.31
% of ED encounters paid by other source
0.012
1.50
% of ED encounters aged 0 to 17
0.001
0.04
% of ED encounters aged 18 to 34
-0.181*
-2.37
% of ED encounters aged 35 to 54
0.065
0.70
% of ED encounters aged 55 to 64
0.015
0.20
** p < .01
* p < .05
† p < .10
Slide22
Adjusted Analysis
Hospital Characteristics of EDs
Coefficient
T-statistic
Number of inpatient beds
0.168**
9.04
ED volume
-0.080**
-3.01
Teaching hospital
0.032
†
1.72
Urban location
0.004
0.13
For-profit hospital
0.054
†
1.95
Non-profit hospital
-0.012
-0.56
Level 1 trauma center
0.118**
4.66
Level 2 trauma center
0.014
0.64
Level 3 trauma center
0.006
0.27
Socioeconomic and market characteristics of EDs
% of ED encounters resulting in admission, county level with subject ED excluded
0.145**
4.78
Per capita income, county level
0.007
0.21
General practice MDs providing patient care per 100,000, county level
-0.073**
-3.68
** p < .01
* p < .05
† p < .10
Slide23
DiscussionPatient-level characteristics
% Medicare (higher -> higher)
% 18-34 (higher -> lower)
Hospital-level characteristics
Number of inpatient beds (higher -> higher)
ED volume (higher -> lower)
Teaching hospital (Yes -> higher)
Level 1 trauma center (Yes -> higher)Slide24
DiscussionCommunity-level characteristics
County-level admission rate (higher -> higher)
Number of primary care doctors (higher -> lower)Slide25
ConclusionThere is tremendous variability in ED admission rates across 28 states
May be the most expensive, regular discretionary decision in U.S. healthcare
Patient & Hospital-level factors predict admission rates
Medicare & hospitals more likely to receive admissions (trauma, teaching, larger)Slide26
ConclusionCommunity-factors
Significant standard of care effect
Impact of local primary care MDsSlide27
Future DirectionsExploring specific diagnoses that may drive this impact
Pneumonia, DVT, Chest pain, others
Testing solutions to control variation
Clinical decision rules
Enhancing care coordination