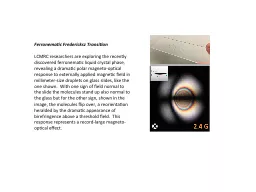
Sazaki et al 2012 Quasiliquid layers on ice crystal surfaces are made up of two different phases PNAS 109 10521055 Asakawa et al 2015 Prism and Other HighIndex Faces of Ice Crystals Exhibit Two Types of QuasiLiquid Layers ID: 553189
Download Presentation The PPT/PDF document "Quasi-liquid layers on ice crystal surfa..." is the property of its rightful owner. Permission is granted to download and print the materials on this web site for personal, non-commercial use only, and to display it on your personal computer provided you do not modify the materials and that you retain all copyright notices contained in the materials. By downloading content from our website, you accept the terms of this agreement.
Slide1Slide2
Quasi-liquid layers on ice crystal surfaces
Sazaki
, et al., 2012:
Quasi-liquid layers on ice crystal surfaces are made up of two different phases
, PNAS,
109
, 1052-1055.
Asakawa
, et al., 2015:
Prism and Other High-Index Faces of Ice Crystals Exhibit Two Types of Quasi-Liquid Layers
,
CGD,
15
, 3339-3344.Slide3
Quasi-liquid layers: why do we care?
Because they’re really cool.Slide4
Introduction: measurements of surface properties
Different ways to measure surface properties
X-ray diffraction
Neutron backscattering
Electron scattering
Low-energy electron scattering
Infrared spectroscopy
Voltammetry
Tunneling electron microscopy
Atomic force microscopySlide5
Introduction: measurements of surface properties
Different ways to measure surface properties
X-ray diffraction
Neutron backscattering
Electron scattering
Low-energy electron scattering
Infrared spectroscopy
Voltammetry
Tunneling electron microscopyAtomic force microscopy
Penetrates surface
Penetrates surface
Penetrates surfaceSlide6
Introduction: measurements of surface properties
Different ways to measure surface properties
X-ray diffraction
Neutron backscattering
Electron scattering
Low-energy electron scattering
Infrared spectroscopy
Voltammetry
Tunneling electron microscopyAtomic force microscopy
Penetrates surface
Penetrates surface
Penetrates surfaceSlide7
Introduction: measurements of surface properties
Different ways to measure surface properties
X-ray diffraction
Neutron backscattering
Electron scattering
Low-energy electron scattering
Infrared spectroscopy
Voltammetry
Tunneling electron microscopyAtomic force microscopy
High vacuum
High vacuumSlide8
Introduction: measurements of surface properties
Different ways to measure surface properties
X-ray diffraction
Neutron backscattering
Electron scattering
Low-energy electron scattering
Infrared spectroscopy
Voltammetry
Tunneling electron microscopy
Atomic force microscopyHigh vacuum
High vacuumSlide9
Introduction: measurements of surface properties
Different ways to measure surface properties
X-ray diffraction
Neutron backscattering
Electron scattering
Low-energy electron scattering
Infrared spectroscopy
Voltammetry
Tunneling electron microscopy
Atomic force microscopyEllipsometry
Grazing-incidence x-ray diffractionConfocal laser scanning microscopyNuclear magnetic resonanceInterference microscopyInterferometrySlide10
Introduction: measurements of surface properties
Different ways to measure surface properties
X-ray diffraction
Neutron backscattering
Electron scattering
Low-energy electron scattering
Infrared spectroscopy
Voltammetry
Tunneling electron microscopy
Atomic force microscopyEllipsometry
Grazing-incidence x-ray diffractionConfocal laser scanning microscopyNuclear magnetic resonanceInterference microscopyInterferometry
Ice destroys AFM tips
Difficult and questionable precision
Poor resolution
Ice is mostly transparent Slide11
Introduction: measurements of surface properties
Different ways to measure surface properties
X-ray diffraction
Neutron backscattering
Electron scattering
Low-energy electron scattering
Infrared spectroscopy
Voltammetry
Tunneling electron microscopy
Atomic force microscopyEllipsometryGrazing-incidence x-ray diffraction
Confocal laser scanning microscopyNuclear magnetic resonanceInterference microscopyInterferometry
Ambiguous results
n
ice
≈
n
water
Very difficult interpretationSlide12
Introduction: so who’s tried this?
Faraday (1840’s) (1860, PRSL)
Several clever experiments showing that “
water particles
” on
ice can briefly turn to liquid
before freezing again (experimental)
Thomson and Lord Kelvin (1850-1870’s)
“Faraday must be daft.”
The surface of ice is just melting because the extra pressure lowers the melting point
Fletcher (1962, Phil. Mag.)
First theoretical treatment
of QLL, used thermodynamics and kinetics to show QLL’s are possible and probable (theoretical)
Jellinek
(1967, JCIS)
First literature review
in the field of water ice QLL
Kuroda and
Lacmann
(1982, JCG)
QLL’s modulate vapor depositional growth
at high temperatures with different temperature dependence for the two different facets (theoretical)
Elbaum
, et al. (1993, JCG)
Optical measurements (
ellipsometry
and interference microscopy)
detected possible QLLSlide13
Introduction: so who’s tried this?
Knight (1996, JGR)
QLL’s don’t make physical sense,
they’re not thermodynamically possible
, and even as a conceptual model they’re useless (comment)
Baker and Dash (1996, JGR)
Charlie Knight is applying macroscopic thermodynamics to a nanoscale system (reply)
Nelson and Knight (1998, JAS)
“There is little doubt that the ice surface is rather badly disturbed at temperatures not far below zero…” but
Kuroda and
Lacmann
are
wrong
about QLL
.
(theoretical)
Ewing (2004, JPCB)
QLL is difficult to measure, but IR can tell us some things.
QLL kind of appears to be a different phase
(experimental review)
Nunes, et al. (2007, Solid State NMR)
No evidence of QLL
, but proving NMR as a possible technique (theoretical)
Sazaki, et al. (2012, PNAS)
First unambiguous observation of two types of QLL on basal facets
Asakawa, et al. (2015, CGD)
First unambiguous observation of two types of QLL on prism facetsSlide14
0.37-nm
vertical resolution
Creates images by scanning the laser across the crystal
Allows video imaging of individual step growth
(
Sazaki
, et al., 2012:
Quasi-liquid layers on ice crystal surfaces are made up of two different phases
, PNAS.)
Fig S2 (
Asakawa
, 2015)
Fig S2 (
Sazaki
, 2012)
Laser confocal microscopy-differential interference microscopy (LCM-DIM)Slide15
Round droplet-like features formed at -1.5 to -0.4
°C:
α
-QLLs
Interference measurements give heights of approximately
0.5
μ
m
for a width of
50
μmIndicates high wettability of ice surface by QLL
(
Sazaki
, et al., 2012:
Quasi-liquid layers on ice crystal surfaces are made up of two different phases
, PNAS.)
Round liquid-like droplets
-0.4
°C
-0.3
°C
-0.6
°C
-0.3
°C
Figure 1.
each band is 317 nmSlide16
Coalescence of
α
-QLLs shows they cannot be solid
They appear to serve as step sources (
Sazaki
, et al. say they nucleate steps)
(
Sazaki
, et al., 2012:
Quasi-liquid layers on ice crystal surfaces are made up of two different phases, PNAS.)
Coalescence of
α
-QLLs
temperature: -0.3
°C
duration: 38 seconds
Movie S1Slide17
Thin layers form at -1.0 to -0.2
°C:
β
-QLLs
Clearly thicker than steps, but too thin for interferometry:
thickness < 100 nm
Droplets and thin layers (not shown here) eventually coalesce
(
Sazaki
, et al., 2012:
Quasi-liquid layers on ice crystal surfaces are made up of two different phases, PNAS.)
Formation of thin layers
temperature: -0.1
°C
duration: 88 seconds
Movie S2Slide18
Adjusting image settings shows
steps underneath the
β
-QLL
Either
β
-QLL
deforms over steps
, or QLL refractive index is different than ice
Thin layers cannot be solid ice
(Sazaki, et al., 2012: Quasi-liquid layers on ice crystal surfaces are made up of two different phases, PNAS.)
Seeing “through”
β
-QLLs
temperature: -0.1
°C
duration: 163.5 seconds
Movie S3Slide19
Temperature decreased -0.5 to -1.0
°C
β
-QLL “decomposed and changed into
α
-QLLs” and many bunched steps
Shows reversibility and phase stability of the transitions between
α
- and
β
-QLLsα-QLLs are more stable than
β
-QLLs in the measured case
(
Sazaki
, et al., 2012:
Quasi-liquid layers on ice crystal surfaces are made up of two different phases
, PNAS.)
Refreezing of QLLs
temperature: -0.5 to -1.0
°C
duration: 163.5 seconds
Movie S4Slide20
According to classical thermodynamics:
β
-QLLs are more thermodynamically favorable
: high wettability means low interaction energy with ice
α
-QLLs are more stable
: lower appearance temperature
β
-QLLs always appear after
α-QLLs
(Sazaki, et al., 2012: Quasi-liquid layers on ice crystal surfaces are made up of two different phases
, PNAS.)
Other notes from
Sazaki
, et al.
Figure S1.Slide21
Roughening transition on prism/high-index facets
Screw dislocation growth at -4.4
°C (A)
Distances between steps decrease at ≈-3.0
°C
(B; 42.1 seconds later)
Surface becoming rounded (C; 501.0 seconds later)
Almost no reflection off surface (D; 1081.0 seconds later)
(
Asakawa
, et al., 2015:
Prism and Other High-Index Faces of Ice Crystals Exhibit Two Types of Quasi-Liquid Layers. CGD.
)
Figure 1.Slide22
QLL’s on prism/high-index facets
Prism facet experiencing a roughening transition/becoming rounded
Liquid-like droplets appear (little lumps on face)
(
Asakawa
, et al., 2015:
Prism and Other High-Index Faces of Ice Crystals Exhibit Two Types of Quasi-Liquid Layers. CGD.
)
Figure 2.Slide23
Liquid-like coalescing on a
a
prism/high-index facet
Two liquid-like droplets coalescing to form one droplet
(
Asakawa
, et al., 2015:
Prism and Other High-Index Faces of Ice Crystals Exhibit Two Types of Quasi-Liquid Layers. CGD.
)
Figure 3.
Movie S1.
-0.5
°CSlide24
(
Asakawa
, et al., 2015:
Prism and Other High-Index Faces of Ice Crystals Exhibit Two Types of Quasi-Liquid Layers. CGD.
)
Figure 4.
Thin liquid-like layers on a prism/high-index facet
Thin layers coalescing to cover the surface
Liquid-like layer appearing underneath liquid-like drop
Liquid-like drops apparently “condensing” in to a growing liquid-like layerSlide25
(
Asakawa
, et al., 2015:
Prism and Other High-Index Faces of Ice Crystals Exhibit Two Types of Quasi-Liquid Layers. CGD.
)
Figure 5.
Thin liquid-like layers coalescing againSlide26
(
Asakawa
, et al., 2015:
Prism and Other High-Index Faces of Ice Crystals Exhibit Two Types of Quasi-Liquid Layers. CGD.
)
Figure 6.
Summary of overall findings
β
-QLLs are less stable (probably)
α
-QLLs always form first
Both are difficult to observe on prism/high-index faces