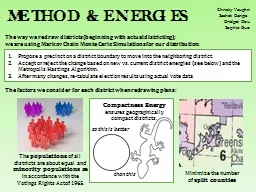
/
The factors  we consider for each district when redrawing plans: The factors  we consider for each district when redrawing plans:

The factors we consider for each district when redrawing plans: - PowerPoint Presentation

tatyana-admore
tatyana-admore . @tatyana-admore
Follow
344 views
Uploaded On 2018-10-25

The factors we consider for each district when redrawing plans: - PPT Presentation

The populations of all districts are about equal and minority populations are in accordance with the Votings Rights Act of 1965 so this is better than this Compactness Energy ID: 696640

results district districts margin district results margin districts actual distribution victories drawn elected energies house split number 2012 based

Share:

Link:

Embed:

Download Presentation from below link

Download Presentation The PPT/PDF document "The factors we consider for each distri..." is the property of its rightful owner. Permission is granted to download and print the materials on this web site for personal, non-commercial use only, and to display it on your personal computer provided you do not modify the materials and that you retain all copyright notices contained in the materials. By downloading content from our website, you accept the terms of this agreement.


Presentation Transcript

Slide1

The factors

we consider for each district when redrawing plans:

The

populations

of all districts are about equal and minority populations are in accordance with the Votings Rights Act of 1965.

so this is better

than this

Compactness Energy

ensures geographically compact districts.

Minimize the number

of

split counties

METHOD & ENERGIES

Christy Vaughn

Sachet Bangia Bridget DouSophie Guo

Propose a precinct on a district boundary to move into the neighboring district.Accept or reject the change based on new vs. current district energies (see below) and the Metropolis Hastings Algorithm.After many changes, re-tabulate election results using actual vote data

The way we redraw districts (beginning with actual districting); we are using Markov Chain Monte Carlo Simulations for our distribution: Slide2

RESULTS

Distribution of Average Margin of Victories vs.

Actual Average Margin of Victories, Based on 2012 House Data

Projected Number of Democrats Elected to US House in NC, 2012

There is some evidence of bias in the redistricting process. Even in cases where the seats-split matched that of our randomly drawn samples, the margin of victories were often larger, as seen above.Our results on the left also so far seem to prefer bipartisan committees (IA) plans over those drawn solely by the state legislature (NC, MD). In addition, it is interesting to note the

effect of the Majority-Minority Energy on the distribution of Demo-

crats elected to office, as seen above.