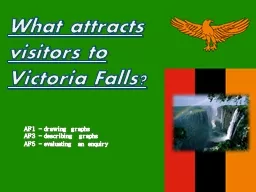
AF1 drawing graphs AF3 describing graphs AF5 evaluating an enquiry The Zambian Tourist Board are enquiring into ways that they can improve the facilities for tourists First they need to work out which activities attract tourists to the area ID: 749590
Download Presentation The PPT/PDF document "What attracts visitors to Victoria Falls..." is the property of its rightful owner. Permission is granted to download and print the materials on this web site for personal, non-commercial use only, and to display it on your personal computer provided you do not modify the materials and that you retain all copyright notices contained in the materials. By downloading content from our website, you accept the terms of this agreement.
Slide1
What attracts visitors to Victoria Falls?
AF1 – drawing graphs
AF3 – describing graphs
AF5 – evaluating an enquirySlide2
The Zambian Tourist Board are enquiring into ways that they can improve the facilities for tourists.
First, they need to work out which activities attract tourists to the area.Slide3
They make a prediction. This is known as a hypothesis.
This is what they decide;
Most people visit Victoria Falls area to see the waterfall.Slide4
What can tourists do?
See the waterfall
Victoria Falls Bridge
RaftingBungee jumpingWildlife ParkRiver CruiseElephant-back Safaris
What would you like to do there?
TASK: Write your hypothesis, similar to the one on the previous slide.Slide5
Data Collection
2
1
visitors were asked the following questions on Saturday April 2nd 2016.Their 2
nd hypothesis was.Most visitors are between 48 and 58TASK: Write your hypothesis – Most visitors will be……Slide6
Results
11
Over 58
Wildlife park
12Over 58Wildlife park1337-47Safaris14Over 58Wildlife park15
Over 58
Safaris
16
Under 25
Waterfall
17
37-47
River cruise
18
37-47
Safaris
19
Over 58
Wildlife
park
20Over 58
Bridge21Over 58Wildlife park
Visitor
Age
Activity
1
Under 25
Bungee
2
37-47
Bungee
3
Under 25
Rafting
4
Over 58
Wildlife park
5
Over 58
Bungee
6
37-47
River cruise
7
37-47
Wildlife park
8
Under 25
Bungee
9
Over 58
Waterfall
10
Over 58
WaterfallSlide7
Data presentation
- select one piece of information, preferably different to the person next to you.
Present one piece of information in a graph (your choice)Slide8
Analysis
Describe the graph.
Give your reasons for the pattern/answers e.g. Why do you think most visitors were over 58?
Why were there no 26-36 year olds?Slide9
Conclusion
Was your hypothesis correct?
The hypothesis was correct/incorrect/partially correct because most people were______ (add data from the graphSlide10
Evaluation
Why might the results be unreliable?
How could we make them more accurate?Slide11
Taboo
I will give you a word – describe it to the class without using that word.