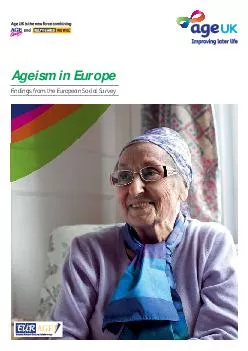
/
Ageism in Europe Ageism in Europe

Ageism in Europe - PDF document

tawny-fly
tawny-fly . @tawny-fly
Follow
407 views
Uploaded On 2016-05-09

Ageism in Europe - PPT Presentation

Findings from the European Social Survey About Age UKWith more people needing our services than ever before Age Concern and Help the Aged have joined forces combining almost 120 years of experience ID: 311830

Findings from the European Social

Share:

Link:

Embed:

Download Presentation from below link

Download Pdf The PPT/PDF document "Ageism in Europe" is the property of its rightful owner. Permission is granted to download and print the materials on this web site for personal, non-commercial use only, and to display it on your personal computer provided you do not modify the materials and that you retain all copyright notices contained in the materials. By downloading content from our website, you accept the terms of this agreement.


Presentation Transcript

Ageism in Europe Findings from the European Social Survey About Age UKWith more people needing our services than ever before, Age Concern and Help the Aged have joined forces, combining almost 120 years of experience. Together, we are Age UK. The Age UK family includes Age Scotland, Age Cymru and Age NI and, additionally, many local Age Concerns are changing their name to Age UK.We are the new voice for millions of people in later life. We believe that by combining our time and our talents, our services and our solutions, and with your help, we can do more to enrich the lives of many, both at home and abroad. By joining forces, we will ensure that more of our funds go where they are needed. We are now one of the most powerful and influential organisations in the UK.A Report from EURAGE (European Research Group on Attitudes to Age) commissioned by Age UKAuthors: Dominic Abrams, Pascale Sophieke Russell, Christin-Melanie Vauclair, Hannah SwiftEditors: Sujata Ray and Nicola Robinson, Age UKPublished by Age UK © 2011ISBN 978-0-9568731-0-1 1 Ageism in Europe and the UK About EURAGE Eurage (www.eurage.com) is an international team of researchers specialising in ageism, attitudes to age and cross-cultural comparisons. The team is led by Professor Dominic Abrams from the Centre for the Study of Group Processes, University of Kent (UK) and Professor Luisa Lima from the Centre for Psychological Research and Social Intervention, Instituto Superior de Ciências do Trabalho e da Empresa, Lisbon.It also includes Professor Geneviève Coudin (Paris V); Professor Kevin McKee (Dalarna Research Institute, Sweden); Dr Christopher Bratt (Kent and Centre for Child and Adolescent Mental Health, Norway); Dr Sibila Marques (Lisbon); Dr Melanie Vauclair, Hannah Swift, Dr Pascale Sophie Russell and David Langdale (University of Kent). Our research uses social psychological theory and methods, including surveys, experiments and qualitative approaches to address important societal questions about age and ageism. 2 Ageism in Europe and the UK Foreword 1 Executive summary 2 Introduction 3 Theoretical background 12 3.1 Age categorisation and identification 123.2 Experiences of age discrimination 123.3 Stereotype content: benevolent and hostile forms of prejudice 133.4 Prejudice against younger and older people 133.5 Perceived threat 3.6 Perceived status 3.7 Intergenerational contact and similarity 14 4 Methodology 5 Results 5.1 Age categorisation and identification 185.1.1 All ESS countries 185.1.2 United Kingdom 26 5.2 Experiences of age discrimination 315.2.1 All ESS countries 315.2.2 United Kingdom 425.3 Stereotype content: benevolent and hostile forms of prejudice 465.3.1 All ESS countries 465.3.2 United Kingdom 565.4 Prejudice against younger and older people 605.4.1 All ESS countries 605.4.2 United Kingdom 66 Contents 3 Ageism in Europe and the UK 5.5 Perceived threat 5.5.1 All ESS countries 705.5.2 United Kingdom 785.6 Perceived status 5.6.1 All ESS countries 835.6.2 United Kingdom 905.7 Intergenerational contact and similarity 935.7.1 All ESS countries 935.7.2 United Kingdom 109 6 Conclusions 118 6.1 Age categorisation and identification 1186.2 Experiences of age discrimination 1196.3 Stereotype content: benevolent and hostile forms of prejudice 1206.4 Prejudice against younger and older people 1216.5 Perceived threat 1226.6 Perceived status 1236.7 Intergenerational contact and similarity 1246.7.1 Family 1246.7.2 Work 1246.7.3 Friends 1256.8 Perceived similarity 1266.9 Overall conclusion 127 References 4 Ageism in Europe and the UKThere are currently 164 million older people in Europe. In practically all European countries, life expectancy is increasing … a considerable achievement resulting from better social conditions, safer work and better healthcare. This trend provides great opportunities in the 21st century and Age UK is working towards a world where older people can enjoy the benefits of later life, wherever they are in the world, being equal citizens with equal rights and continuing to make a contribution. By commissioning this important analysis of the European Social Survey, Age UK seeks to shed light on ageism and stimulate the policy debate. The survey sought the views of 55,000 people across 28 European countries. The wide variety of responses described in this comprehensive report by the Eurage team reflects the rich cultural diversity of Europe. For example, the average age at which youth is perceived to end varies considerably from 34 in Sweden to 52 in Greece. But general trends are clear, with the following headline findings: € 44percent think that age discriminationis a serious or very serious problem.€ 35percent report unfair treatment on grounds of age (more than on grounds of gender or race).€ 39percent have been shown lack of respect because of their age.€ 29percent have been insulted, abused or denied services on grounds of age.€ 51percent are worried that employers show preference to people in their 20s.€ 57percent perceive that people over 70 contribute little to the economy.€ 52percent of all respondents have no friends over 70.Older people face subtle discrimination such as disrespect, being ignored or patronised, more often than blatant discrimination such as insults or abuse. The subtle nature of this type of prejudice makes it more difficult to detect but it still has an impact on self-esteem, wellbeing and the ability to make the most of lifes opportunities. As new European and national policies are defined in respect of active ageing, employment, equal treatment and solidarity between generations, it is important to understand and address the subtle forms of prejudice experienced by older people revealed in this study. This is vital to ensure that older people share equally in economic and social opportunities and that they are treated equally and fairly as part of an intergenerational society.Legislation has an important role to play, and Age UK would like to see the EUs draft Equal Treatment Directive put back on the table for serious debate. Leadership is also required, and the 2012 European Year of Active Ageing provides the perfect opportunity. Standards must be set by European and national champions in political, civic and media worlds, who make the case for a positive view of ageing. Foreword 1. US Census Bureau estimates for 2011. 5 Ageism in Europe and the UKWe also want to show leadership. As the new force combining Age Concern and Help the Aged, Age UK has a combined 120 years of civil society experience, bringing together talents, services and solutions to enrich the lives of people in later life. We are keen to share this expertise with our government and civil society partners across Europe and use the evidence to inform our recommendations for change.Working lives must be longer if pension promises are to be sustainable. We are calling for a focus on raising the employment rate of older workers, which currently stands at just 46percent across Europe, in order to meet the Europe 2020 Strategy target of 75percent employment across all workers aged between 20 and 64. To allow people to age actively, there must be opportunities to participate and contribute to society for longer, whether in work, volunteering, caring or as consumers of goods and services. We want to see the Single Market Act used to empower older consumers; tailoring and marketing products appropriately, promoting inclusive design standards and facilitating ecommerce with simple but reliable processes.In some areas of life, the findings give us heart. Although friendships are age-segregated, where they do exist between generations, relationships are close and confiding. Within families we also interact very positively … over 85percent of respondents feel able to discuss personal issues with family members over 70. This suggests that the right initiatives, bringing different generations together around issues of shared importance, have good chances of success.The prize will be a Europe where an activeolder population, enjoying better health and wellbeing, are more engaged as citizens and consumers, contributing to successful community endeavours and enterprises, and helping to build the social and economic capital of their countries and of Europe as a whole. Michelle MitchellCharity DirectorAge UK Age UK is working towards a world where older people can enjoy the benefits of later life, wherever they are in the world. 6 Ageism in Europe and the UKThe changing population structure of Europe presents great opportunities for the 21st century. There is the potential to transform peoples expectations of ageing, their experiences of ageing, and relationships between different age groups. This report, commissioned by Age UK, uses the Age Attitudes and Experiences of Ageism module in the European Social Survey (ESS) to provide a unique opportunity to assess individuals attitudes toward age and their experiences of ageing across the European countries that participated in the ESS and draw particular comparisons with the UK. The European Social Survey (ESS) is a biennial project, the main aim of which is to study the attitudes and values of participating countries across Europe. It involves a research network of over 25 countries both within and outside the European Union. The analysis for this report encompasses data from 54,988 respondents in the 28 countries that participated in the fourth round of the ESS which took place in 2008 and 2009. The 28 countries comprise 21 of the 27 EU Member States (all but Austria, Ireland, Italy, Lithuania, Luxembourg, Malta); two EU Candidate Countries (Croatia, Turkey); two European Economic Area countries (Norway, Switzerland); plus Israel, Russia and Ukraine. Data for Ireland and Lithuania were only released in February 2011 and are therefore not included in the current report.The research was guided by theories and evidence from social psychology that provide a general framework for understanding and analysing prejudice and inequality. This framework (see Abrams, 2010) considers that prejudice can have multiple causes and features. Interventions to tackle inequality, prejudice and discrimination can therefore be implemented in a variety of different ways and need to reflect the specific factors that may place people at a disadvantage because of their membership of particular social categories. Age is a relatively unique social characteristic because peoples age changes continuously and because everyone who belongs to any age category has already been a member of an earlier age category. This means that age discrimination will have unique qualities that make it different from gender, ethnicity, disability and other equality strands, and why age deserves close attention in its own right.Our framework for investigating discrimination assumes that it is not necessarily deliberate and does not always result from malign intentions or motives. It can be a product simply of the way people perceive and categorise one another (as being young or old, for example). It can be a consequence of pervasive social stereotypes that shape our expectations about the characteristics and behaviour of people from different categories, including our own categories (self-stereotyping). The stereotype content model (Fiske et al., 2002) states that social groups, such as older and younger people, can be evaluated along two basic dimensions: competence and warmth (otherwise referred to as friendliness). Repeatedly, empirical research (e.g. Abrams Eilola and Swift, 2009; Vauclair, Abrams and Bratt, 2010) has established that older people are afforded a mixed stereotype representation of high warmth and low competence. This results in a patronising evaluation of older people that elicits feelings of pity. Such emotions are particularly dangerous because they appear to be positive but they are often at the root of unhelpful policies (Jost and Banaji, 1994). Discrimination can also result from the emotions that follow from peoples beliefs about how members of different categories may compete for resources in society (intergroup threat), and the perceived status of different categories of people. 1 Executive summary 7 Ageism in Europe and the UKPrejudice can also be expressed in different forms, ranging from blatant discrimination and maltreatment to more apparently benign forms such as being patronising towards or ignoring people, or not respecting them. Finally, prejudice can arise from lack of awareness and lack of social or psychological and emotional connection to people from different social groups. People may prefer members of their own groups and categories (even if they do not actively dislike other categories) simply because they have more contact with them, are more familiar with them, have more personal relationships with them and therefore regard them to be important. The main findings are as follows: Age categorisation and identification Across the 28 countries participating in the ESS, the mean age that youth was perceived to end was 40 and the mean age that old age was perceived to start was 62. There was less consensus about the end of youth than the onset of old age. In the UK, the perceived ages for the end of youth (35) and the onset of old age (59) were relatively earlier than the European averages. Those who self-categorise as young reported the strongest sense of belonging to their age category, followed by those categorising themselves as old. The middle age category reported the lowest sense of belonging to their age group. Experiences of age discrimination Throughout Europe (including the UK) age discrimination is experienced more often than other forms of discrimination based on sex or race. Across the ESS countries age discrimination is more likely to be experienced as subtle forms of prejudice rather than blatant prejudice. Most countries perceived age discrimination as a quite or very serious problem. In the UK, 64percent of the respondents perceived age discrimination as a quite or very serious problem, substantially more than the European average (44percent). Stereotypes People aged over 70 are more likely to be seen as stereotypically warm (or friendly) than competent. This difference is larger in the UK compared with the European average. People aged over 70 are also likely to be viewed as stereotypically attracting not only admiration but also pity (relative to younger people). This is consistent with previous research showing that society applies benevolent or patronising stereotypes of older people that can undermine their opportunities. Prejudice Across all ESS countries, including the UK, people tended not to express explicitly negative feelings towards older people. However, younger people felt less positive about older people than older people did about themselves. Perceived threat Perceived threat is an important contributor to prejudice and is measured in terms of realistic threat (e.g. worry about levels of crime committed by particular groups); symbolic threat (e.g. to customs and way of life) and economic threat (e.g. that one group will compete for or consume a disproportionate amount of resources). Across the ESS countries, though less so in the UK, older people are seen primarily as an economic threat, in terms of their contribution to the economy and being a burden on health services. There is, however, considerable variation between countries in the strength of this opinion. Younger people are more likely than older people to perceive older people as posing an economic threat. In the UK, people aged over 50 are more worried than younger people that employers would prefer a person in their 20s over an older individual. Economic conflicts are of particular concern as they provide a basis for resentment and are therefore likely to underpin ageist attitudes. These concerns are likely to be affected by peoples overall concerns about their national economy. 8 Ageism in Europe and the UK Perceived status People aged over 70 are viewed as having the lowest social status among age groups, although on average their status is viewed as higher by people in the UK compared with the rest of the ESS countries. Intergenerational relationships Across all ESS countries, and specifically in the UK, 47percent of people perceived those in their 20s and those over 70 as having no social connection. In general, peoples friendships are restricted to other people within their own age group. For example, across Europe, 80percent of 15…24-year-olds reported that they had no friends who were aged over 70, and 70percent of people aged 75+ reported that they had no friends under 30. These differences were somewhat smaller in the UK (70percent and 63percent, respectively), but still indicate considerable social segregation across the lifespan. Conclusion This report provides evidence of how attitudes to ageing and ageism differ across cultures and nations of Europe. Such differences demonstrate that ageism is amenable to influence from cultural, social and political forces, not an inevitable consequence of biological or developmental differences between people of different ages.Age is, to some degree, in the eye of the beholder and categorisation by age is important because an assessment of someone as young or old makes that person vulnerable to being judged as too young or too old for fair and equal treatment. Interestingly, people also apply ageist stereotypes to themselves by self-categorising into age groups, sometimes without being aware that they are doing so (Levy and Banaji, 2002). Categorisation by age therefore results in significant implications for choices and actions, for example the ESS-wide perception of old age as starting at 62 may in part explain the challenges faced by many who want or need to stay in employment beyond that age. Indeed, across all ESS countries, older people of working age, i.e. between 50 and 64, are the most likely to perceive age discrimination as a serious issue.Negative discrimination is the denial of a benefit or a right to something, based on the classification of a person as a member of a social category. The high prevalence of negative age discrimination found in the survey accords with previous population surveys in the UK (e.g. ACE, 2004; Abrams, Eilola and Swift, 2009). For older people, prejudice and discrimination are likely to be expressed subtly through ostensibly benevolent or patronising stereotypes of higher warmth and lower competence. This type of discrimination may make it more difficult for older people to feel empowered and be taken seriously. Constant exposure to subtle forms of discrimination can have a negative impact on older peoples age identification, self-esteem and work performance.The findings on intergenerational threat corroborate past research in the UK. The greater perception of economic threat by older people may be partly mitigated by increasing retirement ages in European countries so that people are now seen to be economically active for longer. However, this may equally lead to a perception of increased competition for jobs, particularly in times of high unemployment. Perceptions of threat are important indicators to monitor in the light of policy and legislative changes. 9 Ageism in Europe and the UKAge groups are associated with different roles, status, power and social responsibilities and the findings demonstrate differences in perceived social status according to age. The middle age group is seen as having the highest social status, and the old age group the lowest. The finding that older people are seen as less acceptable in a position of high status in the workplace is of particular concern if retirement ages are to increase.Intergenerational understanding and co-operation may also be hampered by perceptions of conflicting interests, status differences and social segregation. Although, within families, intergenerational relations appear to be positive, the findings across all ESS countries suggest that friendship outside of the family and contact at work are age-segregated. The fact that intergenerational contact reduces significantly once people move beyond their mid-60s signals that age-based segregation may have a stronger impact on peoples lives during that age period, when they lose connections that could be important in terms of social capital and wellbeing. However, where relationships do exist they are close and confiding. Together with other evidence about the benefits of intergroup contact, the findings suggest that appropriate initiatives aimed at increased contact and co-operation across age groups could provide important social benefits. Population ageing is a major challenge for Europe in the 21st century, one which is being recognised nationally and at EU level. As new European policies are defined, particularly in respect of employment, pensions and equal treatment, it is important to understand and address age-based prejudice.Ageism is not an inevitable consequence of real or natural differences between age groups. The findings in this report accord with the growing body of research to show that ageism is rooted in the way people categorise and stereotype age, in the perceptions of threat from different age groups, and in lack of shared understanding and positive relationships between people of different ages. All of these factors are amenable to political and social intervention. The findings in this report accord with the growing body of research to show that ageism is rooted in the way people categorise and stereotype age. 10 Ageism in Europe and the UK 2 Introduction The changing population structure of Europe presents significant challenges for the 21st century. Demographic trends show an increase in life expectancy as people live longer and healthier lives, alongside a reduction in the number of births because of falling fertility rates.The United Nations ageing index clearly illustrates demographic ageing trends within Europe. This index represents the number of people older than 60 years per 100 compared with the number of people aged between 0 and 14 years; where an index of 100 means there are equal numbers of people over 60 and 0…14. In 2007, Europe had an ageing index of 136.2, which is expected to increase to 229.7 in 2050. The dependency ratio (number of people older than 65 years compared to those between 15 and 64) in OECD countries is projected to double from 1:4 to 1:2 by 2050 (OECD, 2009). This means that within the EU the ratio of people of working age will decrease from four to only two for each citizen over 65.These trends are also found in the UK. According to the Office of National Statistics (ONS), by 2020 one-fifth of the UKs population will be over 65 years old and over half of these will be aged 75+ (the over-85s continue to be the fastest-growing age group). This implies significant changes for the UK workforce. These figures reflect a dramatic change in population structure, which will have significant societal implications for labour markets, economic growth, consumer behaviour, social security systems and health systems. Demographic ageing, and the policy response to this challenge has the potential to transform peoples expectations of ageing, their experiences of ageing including experiences of ageism (age discrimination), and relations between different age groups. Previous reports by our research group (e.g. Abrams, Eilola and Swift, 2009; Vauclair, Abrams and Bratt, 2010) and Age Concern England (e.g. ACE, 2004; Ray, Sharp and Abrams, 2006) have played a crucial role in demonstrating the prevalence of ageism in the UK over the last few years. This report is a recent development, providing a comprehensive analysis of the wider European context. The European Social Survey (ESS) is a biennial project, the main aim of which is to study the attitudes and values of Europeans comparatively and longitudinally. It involves a research network of embracing countries both within and outside the European Union. The inclusion of the ageism module in the European Social Survey provides us with a unique opportunity to comparatively map peoples attitudes towards age and their experiences of ageism in the UK against other participating European countries. The module was designed by an international team of social psychologists … Professor Dominic Abrams (University of Kent), Professor Luisa Lima (Instituto Superior de Ciências do Trabalho e da Empresa, Lisbon), and Professor Geneviève Coudin (Université Paris V) and is embedded in a social psychological framework. This report provides an important opportunity to understand the experience and meaning of ageing for people in the UK against the experiences of people from 27 other European countries that participated in the ESS. A companion report for the UK department for Work and Pensions (Abrams, Vauclair and Swift, 2011) reports a multilevel modelling analysis of the data. Next, we describe briefly the theoretical basis for the items included in the survey. 12 Ageism in Europe and the UKThe following concepts are examined within Age Attitudes and Experiences of Ageism module of the ESS: € age categorisation and identification€ experiences of age discrimination€ stereotype content: benevolent and hostile forms of prejudice€ prejudice against younger and older people € perceived threat€ perceived status€ intergenerational contact and similarity.The theoretical background of each concept is explained below. 3.1 Age categorisation and identification Discriminatory attitudes and behaviour can be predicted from the degree to which people categorise and identify with particular social groups (Hogg and Abrams, 2001; Tajfel, 1981). Unlike other group categories that have clearly defined boundaries (e.g. ethnicity or gender), age is continuous. What constitutes categorisations into young or old can vary and are relative to ones own age group (ACE, 2004). Understanding how people categorise themselves and how others are categorised as young or old gives us an important indication of how people apply age labels and stereotypical assumptions. Several studies show that the categorisation of ones self and others in different age categories has significant implications for the conduct and welfare of members of different age groups (e.g. Levy, 2003). 3.2 Experiences of age discrimination In order to fully investigate ageism it is important to understand peoples experience of age-based discrimination. The measures used in this report monitor the degree to which people reported being discriminated against because of their age. These measures can be compared to reported experiences of discrimination based on other category memberships, such as ethnicity or gender. This study also provides an extended comparison of experiences of ageism across 28 nations that participated in the ESS. Additional measures in the ESS allow us to understand the prevalence of specific forms of discrimination, such as blatant forms (e.g. bad treatment) or subtle forms (e.g. patronising behaviour or neglect). This section provides essential comparative information about the different experiences of ageism, which in turn helps to conceptualise the phenomenon of ageism in different countries. For example, the comparison between the reported experiences of discrimination (i.e. the degree to which members of a society were targeted by discriminatory conduct because of age) with the degree of prejudice because of age (i.e. the attitudes expressed towards certain age groups) gives us a more accurate idea of the real scale of the problem in context. 3 Theoretical background 13 Ageism in Europe and the UK 3.3 Stereotype content: benevolent and hostile forms of prejudice The stereotype content model (Fiske et al., 2002) states that social groups, such as older and younger people, can be evaluated along two basic dimensions: competence and warmth (otherwise referred to as friendliness). Typically, groups that are evaluated highly on both dimensions (perceived as competent and warm) are seen as having a high social status and are usually associated with positive feelings. Groups that are only evaluated highly on one dimension are typically perceived less favourably. For example, groups that are rated as competent but less friendly (e.g. rich people) are also accorded feelings of envy. In turn, groups that are rated as friendly but less competent (e.g. people with disabilities) are pitied. Finally, groups that are evaluated low on both dimensions (e.g. homeless people) are perceived as having low social status and are often associated with feelings of contempt. The classification of several groups along dimensions of competence and warmth has been examined in several countries around the world (Fiske et al., 2002). More recently, this model has also been applied to understanding the representations and associated feelings of people belonging to different age groups, particularly the young and old (Cuddy, Norton and Fiske, 2005). These studies and our own survey work (e.g. Abrams Eiolola and Swift, 2009; Vauclair, Abrams and Bratt, 2010) have shown repeatedly that older people are afforded a mixed stereotype representation of high warmth and low competence. This results in a patronising evaluation of older people that elicits feelings of pity. Such emotions are particularly dangerous because they appear to be positive but they are often at the root of unhelpful policies (Jost and Banaji, 1994). 3.4 Prejudice against younger and older people When mapping public attitudes towards groups, it is common to include a direct question. For example, What is your level of prejudice against a... (see, for example, the British Social Attitudes Survey since 1983; Rothon and Heath, 2003). However, measures of direct prejudice should be interpreted with some caution. First, people may not be aware of the prejudices they have. Second, people may not admit having feelings of prejudice towards other groups (Abrams, 2010). To overcome this, the ESS included two questions that allow us to ascertain the degree of self-control on prejudice (Plant and Devine, 1998). 3.5 Perceived threat The perception of differences based on age (e.g. lifestyle, employment opportunities or needs for healthcare) may influence feelings of threat. These threats can be felt in economic or material terms, but also in cultural or symbolic terms. For example, older people may be perceived as a burden on the economy as they are the largest recipients of healthcare resources. In addition, older people are the recipients of other welfare resources, such as pension provision and further concessions (e.g. winter fuel allowance). In contrast, young people are sometimes perceived as real threats to social values and morals, e.g. being thought to be more likely to commit crime or anti-social behaviour.The perception of such threats can inform prejudice and discrimination against these groups. Indeed, theories of prejudice and stereotyping suggest that the perception of inter-group threat is related significantly to the antipathy towards these groups (Riek, Ania and Gaertner, 2006). 14 Ageism in Europe and the UK 3.6 Perceived status Age is a primary dimension of categorisation after gender and ethnicity, and it is also an important social marker, determining social roles, status, power and responsibility to people of different ages. In the US, studies have shown that social status is informed by age. For example, Garstka and colleagues (Garstka et al., 2004) showed that both older and younger people agree that the group with the highest social status in society is the middle age group, followed by older people and finally younger people. Perceptions of social status are important because they determine how we deal with members of these groups and the way we interact with people of different ages. According to Social Identity Theory (Tajfel, 1981), people have a clear preference for belonging to groups with higher social status. Membership to subordinate, stigmatised or lower-status groups can have a negative influence on peoples self-esteem and wellbeing. Therefore, understanding how individuals from different countries perceive the social status of different age groups is crucial to understanding the attitudes towards these different groups in various societies. 3.7 Intergenerational contact and similarity An important indicator of social inequality and prejudice is the degree to which social groups share the same goals and values and the degree to which they understand each other. The Common ingroup identity model (Gaertner and Dovidio, 2000) shows that prejudice can be reduced when people perceive they belong to one common group, or belong to different groups that share an overarching community. Additionally, a large number of studies (see Pettigrew, 1998) also show that experiences of positive contact between members of different groups lead to positive inter-group attitudes and relations. Specifically, the theories about inter-group contact show that positive personal relationships, especially friendship with members of other groups, are important determinants for reducing prejudice between different groups. Thus, the degree and type of contact are relevant indicators of exclusion and discrimination of different age groups in a given society (Schneider, 2004). 16 Ageism in Europe and the UKThe findings presented within this report are from Round 4 of the ESS Age Attitudes and Experiences of Ageism module. The ESS employed computer-based personal interviews (CAPI). The ageism module was designed by an international team of social psychologists: Professor Dominic Abrams (University of Kent), Professor Luisa Lima (Instituto Superior de Ciências do Trabalho e da Empresa, Lisbon), and Professor Geneviève Coudin (Université Paris V). The module consists of 55 items which were developed and pilot-tested extensively.A total of 31 countries participated in the ESS project. Data for Ireland and Lithuania were only released in February 2011 (Ireland and Lithuania) and data for Austria have not yet been released. These three countries were therefore not included in the current report. The overall timing of the fieldwork for the 28 countries that were analysed in this report lasted from August 2008 to November 2009. The ESS sampling objective is to achieve equivalent sampling in all participating countries. The requirement is for random (probability) samples with comparable estimates based on full coverage of the eligible residential populations aged 15 and over. The dataset used for this report was released in March 2010 containing representative data from 28 countries across the European region and 54,988 respondents in total. The average sample size was 1,966, ranging from 1,215 (in Cyprus) to 2,751 (in Germany). The average response rate was 63percent, with a minimum of 45.7percent (in Croatia), and a maximum of 78.7percent (in Cyprus). The results presented in this report have been weighted according to ESS recommendations, multiplying the design and population weights when comparing multiple countries. Table 1 presents the period of data collection, sample size and response rate of the 28 countries that participated in the ESS and for which data were released in March 2010. 4 Methodology 17 Ageism in Europe and the UK Country Period of Number of Response data collection participants rate (per cent)Belgium 13.11.08…20.03.09 1,760 58.9Bulgaria 06.03.09…31.05.09 2,230 75.0Croatia 22.12.08…31.03.09 1,484 45.7Cyprus 29.09.08…21.12.08 1,215 78.7Czech Republic 08.06.09…08.07.09 2,018 69.5Denmark 01.09.08…11.01.09 1,610 53.9Estonia 05.11.08…11.03.09 1,661 57.4Finland 19.09.08…05.02.09 2,195 68.4France 28.09.08…31.01.09 2,073 49.4Germany 27.08.08…31.01.09 2,751 48.0Greece 15.07.09…20.11.09 2,072 74.3Hungary 20.02.09…20.04.09 1,544 61.3Israel 31.08.08…13.03.09 2,490 77.7Latvia 02.04.09…08.09.09 1,980 57.9Netherlands 08.09.08…28.06.09 1,778 49.8Norway 25.08.08…20.01.09 1,549 60.4Poland 03.11.08…15.02.09 1,619 71.2Portugal 09.10.08…08.03.09 2,367 75.7Romania 02.12.08…19.01.09 2,146 68.0Russia 08.11.08…09.04.09 2,512 67.9Slovakia 17.11.08…15.02.09 1,810 72.6Slovenia 20.10.08…20.01.09 1,286 59.1Spain 05.09.08…31.01.09 2,576 66.8Sweden 15.09.08…03.02.09 1,830 62.2Switzerland 30.08.08…17.04.09 1,819 49.9Turkey 02.11.08…17.05.09 2,461 66.5Ukraine 01.03.09…02.04.09 1,845 61.5United Kingdom 01.09.08…19.01.09 2,352 55.8Table 1 ESS countries, the period of data collection, number of participants and response rate 18 Ageism in Europe and the UK 5.1 Age categorisation and identification This section examines three dimensions: classifying others into age groups, classifying oneself into an age group, and self-identification with ones own age group. 5.1.1 All ESS countries Respondents gave specific ages of when they thought youth ends and old age starts. Figure1 indicates that on average across the ESS countries, youth is perceived to end at 40 and old age starts at 62. Therefore, middle age covers a 22-year span. Figure 2 shows that people in Greece perceive that youth ends at 52 years of age. In comparison, Norwegians think that youth ends at 34. Therefore, estimations of when youth ends cover an 18-year span across the ESS countries. Individuals in the UK estimate that youth ends at 35 years old, thus, below the average age across ESS countries (40 years old). With the exception of Finland and Portugal, the mean of all other countries significantly differed from the UK mean. As observed in Figure 3, people in Greece estimate that old age starts at 68, while in Turkey it starts at 55. Thus, the range of this categorisation covers a 13-year span across the ESS countries. Respondents in the UK perceive that old age starts at 59, lower than the mean age across ESS countries (62 years of age). In order to examine the average length of middle age, the difference between the start of old age and end of youth was calculated. The average length of middle age across the ESS countries was 22 years. Portugal had the longest span (30), while Romania and Cyprus had the shortest span (15). In the UK, middle age covered a 24-year span, thus, longer than the ESS average (22). The short range across the countries suggests that people are motivated to categorise others as either young or old. 5 Results 70 MeanAge people stopbeing describedas youngAge people startbeing describedas old39.962.0 Figure 1 Perceived end of youth and start of old age across ESS countries (mean estimated age) 19 Ageism in Europe and the UKFigure 2 Perceived end of youth in ESS countries (mean estimated age) GreeceCyprusRomaniaSloveniaBelgiumUkraineLatviaSlovakiaGermanyBulgariaIsraelSpainPolandSwitzerlandNetherlandsCzech RepublicEstoniaFranceHungaryCroatiaDenmarkRussiaUnited KingdomPortugalFinlandTurkeySwedenNorwayAll ESS 51.7 51.5 46.8 44.3 43.8 43.6 43.6 43.6 43.5 43.2 42.9 42.1 41.7 41.0 40.4 40.0 39.6 39.3 39.2 38.9 38.5 37.7 35.2 35.0 34.8 34.2 33.7 39.9 Age in years 20 Ageism in Europe and the UK 80 68.2 66.7 65.6 65.5 65.3 64.3 64.3 64.0 63.9 63.5 63.1 63.1 63.0 62.9 62.8 62.5 62.2 62.1 61.9 61.9 61.4 61.4 61.1 61.0 60.4 60.1 59.0 55.1 62.0 All ESSTurkeyUnited KingdomCroatiaCzech RepublicSlovakiaFinlandEstoniaHungaryGermanyRomaniaSpainSwedenNorwayLatviaNetherlandsBulgariaFranceUkraineRussiaSloveniaPolandBelgiumDenmarkSwitzerlandIsraelPortugalCyprusGreece Age in years Figure 3 Perceived start of old age in ESS countries (mean estimated age) 21 Ageism in Europe and the UK 35 30.5 28.8 27.9 26.3 25.8 25.7 24.2 23.7 23.6 22.6 22.4 22.3 22.2 21.6 21.2 20.6 20.5 20.4 20.1 19.9 19.5 19.4 19.2 18.4 17.2 16.5 15.2 15.1 22.0 All ESSRomaniaCyprusGreeceSlovakiaGermanyLatviaUkraineSloveniaBulgariaSpainCzech RepublicBelgiumTurkeyCroatiaEstoniaHungaryPolandIsraelNetherlandsFranceUnited KingdomSwitzerlandRussiaDenmarkFinlandSwedenNorwayPortugal Difference in years Figure 4 Perceived duration of middle age in ESS countries (difference scores between mean estimated age of end of youth and start of old age) 22 Ageism in Europe and the UKAlso examined were the age categories in which people place themselves. Participants were asked to indicate the age group to which they thought they belonged. As observed within Figure 5, most people categorised themselves as belonging to the middle age group (51percent), followed by the young age group (31percent), and the fewest to the old age group (18percent). In general, individuals categorised themselves into appropriate categories (e.g. 91percent of 15…24-year-olds classified themselves as young; 63percent of 25…49-year-olds classified themselves as middle aged; 76percent of 50…64-year-olds classified themselves as middle-aged; 83percent of over-70s classified themselves as old). As to be expected, people are more likely to categorise themselves as old and less likely to categorise themselves as young as they get older. There is also a curvilinear relationship of the likelihood to categorise oneself as being middle-aged, peaking within the 50…64 age group. After respondents categorised themselves into the age bands, they were asked about their sense of belonging to this age category. Individuals expressed the weakest sense of belonging to the middle age group (=6.3), followed by the old age group (=6.8), and the greatest to the young age group (=7.4). Interestingly, even though most people categorised themselves as belonging to the middle age category they expressed the weakest sense of belonging to this age category. Percentage MiddleYoungOld Figure 5 Age categories (young, middle, old) individuals see themselves belonging to across ESS countries (percentages) 23 Ageism in Europe and the UKFigure 7 Sense of belonging to age categories (young, middle, old) that respondents described themselves as belonging to across ESS countries (mean scores, scale ranged from 0: very weak sense of belonging to 10: very strong sense of belonging) Percentage 100 15…2425…4950…6465…7475+ 4.0 1.71.7 0.3 1.7 Young Middle OldAge of respondents90.835.263.176.236.715.219.861.683.1 Mean score 10 0 7.46.86.3MiddleYoungOld Figure 6 How age-categorised (young, middle, old) individuals see themselves belonging to comparing age groups (percentages) 24 Ageism in Europe and the UKFigure 8 Sense of belonging to young and old age categories that respondents described themselves as belonging to in ESS countries (mean scores, scale ranged from 0: very weak sense of belonging to 10: very strong sense of belonging) 10 All ESS Young OldMean score Turkey United Kingdom Croatia Czech Republic Slovakia Finland Estonia Hungary Germany Romania Spain Sweden Norway Latvia Netherlands Bulgaria France Ukraine Russia Slovenia Poland Belgium Denmark Switzerland Israel Portugal Cyprus Greece 25 Ageism in Europe and the UKFrom Figure 8 it can be observed that people felt the greatest sense of belonging to the old age category within Cyprus (=7.89). In comparison, people felt the weakest sense of belonging to the old age category within France (=5.74). In the UK, individuals expressed a weaker sense of belonging to the old age category (=6.8) in comparison to the European average (=7.8). Referring to the young age category, people expressed the greatest sense of belonging in Greece (=8.71), and the weakest sense of belonging in the Netherlands (=6.76). The UK had the second-lowest sense of belonging to the young age category (=6.83). Focusing on the appropriate age groups, it can be inferred that people felt the greatest sense of belonging to the young age category if they were between the ages of 15 and 24 (see Figure 9). On the other hand, respondents expressed the greatest sense of belonging to the old age category if they were 75 years old or older. However, there was not a large difference in the sense of belonging to the middle age category across age groups. This may suggest that there is not a firm boundary around this age category.Figure 9 Sense of belonging to age categories that respondents described themselves as belonging to comparing age groups (mean scores, scale ranged from 0: very weak sense of belonging to 10: very strong sense of belonging) Mean score 10 0 15…2425…4950…6465…7475+ 7.87.16.46.36.77.2 Young Middle Old Age group 26 Ageism in Europe and the UK 5.1.1.1 Main conclusions € Across the ESS countries, youth was perceived to end at 40 years of age and old age to start at 62. € Perception of when youth ends varied by 18 years across the ESS countries. € Perception of the age at which old age starts varied by 13 years across the ESS countries. € The average span of middle age across the ESS countries was 22 years. € Most people categorised themselves as belonging to the middle age group (51percent), followed by the young age group (31percent), and the fewest to the old age group (18percent). € In general, respondents categorised themselves into appropriate age categories. € Individuals expressed the weakest sense of belonging to the middle age category (=6.3), followed by the old age category (=6.8), and the greatest to the young age category =7.4). € Individuals in the UK expressed a weaker sense of belonging to the old age category =6.44) in comparison the ESS average =7.00). The UK had the second-lowest sense of belonging to the young age category =6.83) in comparison to other ESS countries. € Focusing on the appropriate age categories, people felt the greatest sense of belonging to the young age category if they were between the ages of 15 and 24 (see Figure 9). On the other hand, respondents felt the greatest sense of belonging to the old age category if they were 75 years old or older. There was not a large difference in the sense of belonging to the middle age category across age groups, suggesting a malleable boundary around this age category. 5.1.2 United Kingdom Based on Figure 10, in the UK, youth is perceived to end at 35 years old, which is lower than the ESS average (=39). In comparison, old age is perceived to start at 59 years old in the UK, which is also lower than the ESS average (=62). From this, it can be inferred that the perceived duration of middle age covers a span of 24 years, which is above the ESS average (=22). The estimated age for end of youth and start of old age both increase as individuals get older (see Figure 11). Alongside these increases the perceived duration of middle age becomes smaller as people get older. 27 Ageism in Europe and the UKFigure 10 Perceived end of youth, start of old age and duration of middle age in the UK (mean estimated age)Figure 11 Perceived end of youth, start of old age and duration of middle age in the UK by age groups (mean estimated age) Mean estimated age 70 Perceived start of old agePerceived end of youthDuration of middle age 35 Mean 15…2425…4950…64 Perceived end of youth Perceived start of old age Duration of middle age65…7475+ Age group 28 Ageism in Europe and the UKFigure 12 depicts that in the UK most individuals were likely to categorise themselves as belonging the middle age category (61percent), followed by the young age category (23percent), and the old age category (16percent), respectively. Figure 13 indicates that individuals most often categorised themselves into the young age category between the ages of 15 and 24. In comparison, individuals were most likely to categorise themselves into the old age group category if they were 75 or older. People only began to categorise themselves as old if they were over 50. Overall, the pattern of self-categorisation for the UK is very similar to the ESS average, if anything there are slightly more polarised categorisations into the young and old age categories in the UK. Figure 14 demonstrates that the pattern of sense of belonging is similar to the ESS average; however, the mean sense of belonging is lower for each age category (young, middle, old). Thus, individuals in the UK expressed a weaker sense of belonging to the age categories in which that they had put themselves. Figure 15 focuses on the sense of belonging to appropriate age categories for each age group. Individuals showed a greater sense of belonging to the young age category if they were 15…24, in comparison to 25…49. Similarly, people expressed a greater sense of belonging to the old age category if they were over 75 rather than 65…74 years old. Figure 12 Age categories (young, middle, old) that individuals see themselves belonging to in the UK (percentages) Percentage MiddleYoungOld 29 Ageism in Europe and the UKFigure 13 Age categories (young, middle, old) that individuals see themselves belonging to in the UK by age group (percentages)Figure 14 Sense of belonging to age categories (young, middle, old) that respondents described themselves as belonging to in the UK (mean scores, scale ranged from 0: very weak sense of belonging to 10: very strong sense of belonging) Percentage 15…2425…4950…64 Young Middle Old65…7475+ 2.6 2.81.9 0.8 Age group81.123.718.975.580.044.218.017.453.080.1 Mean score 10 0 6.86.46.1MiddleYoungOld 30 Ageism in Europe and the UK Figure 15 Sense of belonging to age categories that respondents described themselves as belonging to in the UK by age groups (mean scores, scale ranged from 0: very weak sense of belonging to 10: very strong sense of belonging) Mean score 10 15…2425…4950…6465…7475+ Young Middle Old 7.2 6.45.96.26.27.2 Age group5.1.2.1 Main conclusions € In the UK, youth is perceived to end at 35 years of age and old age to start at 59. These means are significantly lower than the average of other ESS countries. The perceived duration of middle age covers a span of 24 years, which is above the ESS average of 22. € The perceived ages at which youth ends and old age starts increase as individuals get older. € Individuals are most likely to categorise themselves into the middle age category, followed by the young age category, and the fewest into the old age category. € People most often categorised themselves into the young age category between the ages of 15 and 24. In comparison, individuals most often categorised themselves into the old age category if they were over 75. € In the UK the mean sense of belonging is significantly lower for each age category (young, middle, old) in comparison to the mean of other countries. Thus, individuals in the UK expressed a weaker sense of belonging to the age categories that they had put themselves in. € Individuals showed a greater sense of belonging to the young age group if they were 15…24, in comparison to 25…49. Similarly, people expressed a greater sense of belonging to the old age category if they were over 75, rather than 65…74 years old. 31 Ageism in Europe and the UK 5.2 Experiences of age discrimination This section investigates the perceived seriousness of age discrimination and reported experiences of ageism. It compares age discrimination to other forms of discrimination based on gender or race, and looks at the types of age discrimination that occur (lack of respect and other forms of bad treatment). 5.2.1 All ESS countries Participants were asked to indicate their perception of the severity of age discrimination. Figure 16 shows that age discrimination was often perceived as a serious problem across Europe … with 34.5percent of respondents rating it as quite serious and 9.9percent as very serious … 44.4percent in total. In contrast, only 6percent of people thought that age discrimination did not exist in their country. Figure 17 shows that in France 68percent of people thought age discrimination was a very or a quite serious problem, while in Turkey only 17percent thought of age discrimination in this manner. Thus, there was an extremely large range of opinion about age discrimination as a serious problem across the ESS countries. The UK had the second highest level of perceiving discrimination as a very or a quite serious problem (64percent), which is above the ESS average. Turkey, Denmark, Bulgaria and Cyprus were the only countries in which less than 30percent of individuals thought that age discrimination was a very or a quite serious problem. Figure 16 Percentage of respondents across ESS countries indicating perceptions of seriousness of age discrimination 50 QuiteseriousVeryserious PercentagedependsNot veryseriousNot atall seriousdiscrimination29.210.96.49.19.934.5 32 Ageism in Europe and the UKFigure 17 Percentage of people in ESS countries who indicated age discrimination as a very serious or a quite serious problem 70 All ESSRomaniaCyprusGreeceSlovakiaGermanyLatviaUkraineSloveniaBulgariaSpainCzech RepublicBelgiumCroatiaEstoniaHungaryPolandIsraelNetherlandsFranceUnited KingdomSwitzerlandRussiaDenmarkTurkeyFinlandSwedenNorwayPortugal Percentage 33 Ageism in Europe and the UKFigure 18 Percentage of people in ESS countries who indicated age discrimination as a very serious/a quite serious problem or that it does not exist 80 All ESSTurkey PercentageFrance United Kingdom Romania Portugal Norway Netherlands Hungary Israel Poland Sweden Czech Republic Finland Germany Switzerland Belgium Slovakia Slovenia Spain Latvia Estonia Ukraine Croatia Greece Russia Cyprus Bulgaria Denmark Very/quite serious No discrimination 34 Ageism in Europe and the UKFigure 18 demonstrates that within most countries, respondents perceived that there was at least some form of age discrimination. Respondents in Turkey had the lowest perceptions of age discrimination, with 31percent indicating that there is no age discrimination within that country, and only 17percent indicating that age discrimination is a very or a quite serious problem, which is the lowest percentage across ESS countries. In comparison, within eight countries (the UK,Belgium, Netherlands, France, Hungary, Finland, Germany, and Czech Republic) less than 1percent of the respondents thought that age discrimination did not exist. Also, two of these countries (the UK and France) were most likely to indicate that age discrimination is a quite or very serious problem. Figure 19 demonstrates that across the age groups there was a very similar percentage of responses indicating that age discrimination was a very or a quite serious problem (41…47percent). Individuals between the ages of 50 and 64 were slightly more likely to consider age discrimination a serious problem (47percent), but the similar result across age groups is striking. To compare the prevalence of different forms of discrimination, respondents were asked whether anyone had shown prejudice or treated them unfairly because of their age, sex or race/ethnic background. Figure 20 indicates that more respondents reported unfair treatment because of their age (35percent), than because of their sex (25percent) or race/ethnic background (17percent). Respondents that reported experiences of discrimination based on their race or ethnic background appeared to do so not only because of whether or not they actually belonged to a racial or ethnic minority, but also whether or not they were a national of the country in which they lived. 35 Ageism in Europe and the UK Percentage 34.517.324.9SexAgeRace/ethnicity Percentage15…2425…4950…6465…7475+ 45.5 41.2 41.0 42.2 Age group Figure 19 Percentage rating age discrimination as a very serious or a quite serious problem by age groups across all ESS countriesFigure 20 Percentage of people across ESS countries who had experienced unfair treatment because of their age, sex and race or ethnic background (includes individuals who did not indicate 0 on a scale that ranged from 0: never to 4: very often) 36 Ageism in Europe and the UKFigure 21 indicates that there was a large range of respondents reporting unfair treatment because of age within the past year, across the ESS countries, ranging from 17 to 54percent. People in the Czech Republic reported the most unfair treatment because of their age (54percent), while people in Cyprus reported the least (17percent). The UK had a smaller percentage of reported unfair treatment in comparison to the European average.Figure 22 indicates that reported unfair treatment due to age was more prevalent than that of sex or race and ethnic background, and that this is consistent across the age groups. There was a large decline in perceived unfair treatment because of age between the 15…24 and 25…49 age groups. After this decline the perception of unfair treatment because of age increased between the 50…64 and 65…74 age groups, levelling off afterwards. Participants were also asked about the type of unfair treatment they had experienced, with a distinction drawn between lack of respect (e.g. being ignored or patronised) and bad treatment (being insulted, abused or denied services). Figure 23 shows that 29percent of people reported being insulted, abused or denied services because of their age, and 39percent had been shown disrespect because of their age. Figure 24 suggests that people living in the Czech Republic reported being shown the most lack of respect (62percent), and those living in Portugal the least (18percent). Respondents in the Czech Republic were also most likely to report bad treatment (51percent). UK respondents reported being shown more lack of respect (UK = 42percent; All ESS countries = 39percent), but less bad treatment (UK = 23percent; All ESS countries = 29percent) than the ESS average. Both forms of age discrimination follow a similar pattern. Figure 25 shows that there was a steep decline between the age groups of 15…24 and 25…49, and afterwards a gradual increase until the 65…74 age group. On aggregate, one in four respondents across all age groups reported having been insulted, abused or denied services as a result of their age. 37 Ageism in Europe and the UK 60 PercentageAll ESSCyprusPortugalTurkeyGreeceHungaryCroatiaSwitzerlandBulgariaPolandNorwayUnited KingdomDenmarkLatviaSpainIsraelGermanyFranceSloveniaSwedenUkraineEstoniaRomaniaSlovakiaRussianBelgiumFinlandNetherlandsCzech Republic Figure 21 Percentage of people in ESS countries who had experienced unfair treatment because of their age (includes individuals who did not indicate 0 on a scale that ranged from 0: never to 4: very often) 38 Ageism in Europe and the UK Percentage 15…2425…4950…64 Age Sex Race/ethnicity65…7475+ Age group49.531.719.830.826.818.831.721.215.235.019.814.633.117.412.7 29.1Treated badly(e.g. insulted and abused) 39.0Lack of respect(e.g. ignored and patronised) 0 Percentage Figure 22 Percentage of people across ESS countries who had experienced unfair treatment because of their age, sex and race or ethnic background by age groups (includes individuals who did not indicate 0 on a scale that ranged from 0: never to 4: very often)Figure 23 Percentage of people across ESS countries who thought that someone showed a lack of respect or treated them badly because of their age (includes individuals who did not indicate 0 on the scale that ranged from 0: never to 4: very often) 39 Ageism in Europe and the UKFigure 24 Percentage of people in ESS countries who thought someone showed a lack of respect or treated them badly because of their age (includes individuals who did not indicate 0 on a scale that ranged from 0: never to 4: very often) 70 All ESS Turkey United Kingdom Croatia Czech Republic Slovakia Finland Estonia Hungary Germany Greece Romania Spain Sweden Norway Latvia Netherlands Bulgaria France Ukraine Russia Slovenia Poland Belgium Denmark Switzerland Israel Portugal Cyprus Lack of respect(e.g. ignored and patronised) Treated badly(e.g. insulted and abused)Percentage 40 Ageism in Europe and the UKFigure 25 Percentage of people who thought someone showed a lack of respect or treated them badly because of their age … comparing age groups (includes individuals who did not indicate 0 on a scale that ranged from 0: never to 4: very often) 60 Percentage15…2425…4950…6465…7475+ Lack of respect(e.g. ignored and patronised) Treated badly(e.g. insulted and abused) Age group55.441.135.125.834.826.640.130.537.529.3 41 Ageism in Europe and the UK 5.2.1.1 Main conclusions € Age discrimination is most often seen as a quite serious problem across the ESS countries. Only 11percent of people thought of perceived age discrimination as not at all serious. € There was a large range of opinion across the ESS countries as to whether age discrimination was a very or a quite serious problem. The UK had the second-highest level of perception of the seriousness of age discrimination (64percent). € Within most countries respondents perceived that there was at least some form of age discrimination. Within eight countries (the UK, Belgium, Netherlands, France, Hungary, Finland, Germany, and the Czech Republic) less than 1percent of the respondents thought that age discrimination did not exist. € Across the age groups, most respondents indicated that age discrimination was a very or a quite serious problem. Individuals between the ages of 50 and 64 were slightly more likely to think of age discrimination in this manner than other age groups. € Respondents reported more age discrimination than gender-based or race/ethnicity-based discrimination. This relationship remains across the age groups. € There was a large range of reported unfair treatment because of age across the ESS countries, ranging from 17 to 54percent. On average one in four respondents across all age groups and all countries reported having been insulted, abused or denied services as a result of their age. € People were more likely to feel that they had been ignored and patronised, in comparison to being insulted, abused or denied services. Czech Republic respondents were most likely to report both forms of discrimination because of age. For both forms of age discrimination there was a steep decline between the age groups of 15…24 and 25…49, afterwards there is a gradual increase up until the 65…74 age group. 42 Ageism in Europe and the UKFigure 26 Percentage indicating perceptions of seriousness of age discrimination in the UK 60 QuiteseriousVeryserious 29.8 4.3 0.3 1.9 PercentagedependsNot veryseriousNot atall seriousdiscrimination51.112.6Rating 5.2.2 United Kingdom Figure 26 demonstrates that over 60percent of respondents in the UK thought that age discrimination was a very or a quite serious problem. In comparison, less than 1percent thought that age discrimination did not exist in the UK. Figure 27 demonstrates that across the age groups a large majority thought that age discrimination was a very or a quite serious problem (44percent or more). For each age group the percentage was higher than the ESS average. Figure 28 suggests that in the UK unfair treatment because of age is the most prevalent type of discrimination. However, the UK reported less unfair treatment because of age than the average across all ESS countries (UK = 30percent; ESS average = 35percent). Referring back to Figure 22 the UK differed from the ESS pattern of findings, in that there was no increase in perceived unfair treatment because of age after 50 years of age (see Figure 29). Also, respondents between the ages of 25 and 49 reported similar amounts of unfair treatment because of age and sex. In the UK, respondents reported being shown more lack of respect because of their age, than other forms of bad treatment (see Figure 30). This may suggest that people in the UK are more vulnerable to subtle forms of prejudice than hostile forms of prejudice because of their age.The UK showed a similar pattern of findings to the ESS average; however, there also appears to be a sharp decline between the 65…74 and 75+ age groups for both forms of age discrimination (Figure 31). 43 Ageism in Europe and the UKFigure 27 Percentage of people in the UK who indicated age discrimination as a very serious or a quite serious problem by age groups 100 Percentage15…2425…4950…6465…7475+ 67.4 66.7 44.7 51.7 Age group Percentage 29.716.525.0SexAgeRace/ethnicity Figure 28 Percentage of people in the UK who had experienced unfair treatment because of their age, sex and race or ethnic background (includes individuals who did not indicate 0 on a scale that ranged from 0: never to 4: very often) 44 Ageism in Europe and the UK Percentage 15…2425…4950…64 Age Sex Race/ethnicity65…7475+ Age group63.544.625.127.627.318.523.718.613.318.314.210.316.210.15.7 Percentage 23.0Treated badly(e.g. insulted and abused) 41.5Lack of respect(e.g. ignored and patronised) Type of discrimination Figure 29 Percentage of people in the UK who had experienced unfair treatment because of their age, sex and race or ethnic background by age groups (includes individuals who did not indicate 0 on a scale that ranged from 0: never to 4: very often)Figure 30 Percentage of people in the UK who thought someone showed a lack of respect or treated them badly because of their age (includes individuals who did not indicate 0 on the scale that ranged from 0: never to 4: very often) 45 Ageism in Europe and the UK 100 Percentage15…2425…4950…6465…7475+ Lack of respect(e.g. ignored and patronised) Treated badly(e.g. insulted and abused) Age group73.240.848.021.032.917.935.618.325.212.9 Figure 31 Percentage of people in the UK who thought someone showed a lack of respect or treated them badly because of their age … comparing the different age groups (includes individuals who did not indicate 0 on the scale that ranged from 0: never to 4: very often) 5.2.2.1 Main conclusions € Over 60percent of respondents in the UK thought that age discrimination was a very or a quite serious problem. In comparison, less than 1percent thought that age discrimination did not exist in the UK. The perceived seriousness of age discrimination in the UK was statistically higher than the average of all other countries. € Across the age groups, a large majority thought that age discrimination was a very or a quite serious problem (44percent or more across age groups). € The UK reported less unfair treatment because of age than the ESS average (UK = 30percent; ESS = 35percent). There was no increase in perceived unfair treatment because of age after 50 years of age. € In the UK, respondents reported being shown a higher incidence of lack of respect rather than bad treatment because of their age. The UK average for lack of respect was significantly higher than the average for other countries, while the average for bad treatment was significantly lower. 46 Ageism in Europe and the UK 5.3 Stereotype content: benevolent and hostile forms of prejudice This section investigates the characteristics and emotions that respondents associate with people in their 20s and people aged over 70. 5.3.1 All ESS countries Respondents were asked to rate the likelihood that most people perceive those in their 20s and people aged over 70 as friendly, competent, having high moral standards and being viewed with respect. Figure 32 shows that older people are least likely to be perceived as competent in comparison to the other characteristics (as friendly, as having high moral standards, viewed with respect). Younger people had lower ratings on all of the characteristics in comparison to older people. Figure 33 indicates that respondents under the age of 25 perceive people in their 20s slightly more positively than respondents in other age categories. This illustrates a small degree of inter-group bias between age groups. Figure 34 shows that with the exception of being viewed with respect, there is a continuous increase in the likelihood of perceiving people aged over 70 with these characteristics. For example, people aged over 70 are more likely to be viewed as competent if the respondent was over 65 years old. Thus, these findings replicate what was shown for people in their 20s; people are more likely to think of their own age group as possessing these positive characteristics. However, it is noticeable that, for people aged over 70, perceived competence is lower than perceived friendliness which is not the case for people in their 20s. 4 Mean score20sOver 70Friendly 2.8Competent 2.4High moralstandards 3.1Respect 3.0Friendly 2.3Competent 2.3High moralstandards 1.9Respect 2.1 Figure 32 Likelihood that most people view those in their 20s and over 70 as possessing certain characteristics (across ESS countries mean scores, scale ranged from 0: not at all likely to 4: very likely) 47 Ageism in Europe and the UK 3 Mean score 15…2425…4950…64FriendlyCompetentHigh moral standardsRespect65…7475+ Age group Figure 33 Likelihood that most people view those in their 20s as possessing certain characteristics … comparing age groups (mean scores, scale ranged from 0: not at all likely to 4: very likely)Figure 34 Likelihood that most people view those over 70 as possessing certain characteristics … comparing age groups (mean scores, scale ranged from 0: not at all likely to 4: very likely) 4 Mean score 15…2425…4950…64FriendlyCompetentHigh moral standardsRespect65…7475+ Age group 48 Ageism in Europe and the UKFigure 35 indicates that people over 70 are most likely to be viewed as friendly within Norway =3.18), while least likely within Romania =2.47). The UK average on friendliness was higher than the ESS average (UK =2.98; ESS =2.83). People aged over 70 were viewed as most competent in Hungary (=3.02), and least competent in Poland (=1.87).The UK average on competence of the over 70s was below the ESS average (UK =2.35; ESS =2.44). From these findings, it can be concluded that in the UK older people are associated with the mixed stereotype of warm but incompetent, more so than the European average. It can be seen in Figure 36 that people in the Russian Federation view those in their 20s as least friendly (=2.0), and people in Greece view those in their 20s as the most friendly =3.08). The UK had the second lowest mean on friendliness (=2.02). Perceptions of competence of people in their 20s are highest in Greece (=2.97), and lowest in Ukraine =1.73). Participants were also asked to rate the likelihood that most people view those in their 20s and over 70 with certain emotions. Figure 37 demonstrates that across the ESS countries people aged over 70 are more often viewed with pity and admiration. From this it can be inferred that individuals are likely to feel benevolent about older people. In comparison, people in their 20s are likely to be viewed with envy and admiration. Figure 38 suggests that as they get older people feel less envy and contempt towards those in their 20s; however, the reverse effect occurs for pity. Figure 39 indicates that people feel the least admiration towards people in their 20s in Hungary (=1.41), and the most in Turkey =2.49). Respondents in the UK (=1.74) felt less admiration than the ESS average (=1.99). On the other hand, people are least likely to view 20-year-olds with envy in Portugal (=1.35), and the most likely in Poland (=2.40). 49 Ageism in Europe and the UKFigure 35 Likelihood that most people view those over 70 as friendly and competent (in ESS countries mean scores, scale ranged from 0: not at all likely to 4: very likely) 4 All ESS Turkey United Kingdom Croatia Czech Republic Slovakia Finland Estonia Hungary Germany Greece Romania Spain Sweden Norway Latvia Netherlands Bulgaria France Ukraine Russia Slovenia Poland Belgium Denmark Switzerland Israel Portugal Cyprus Friendly CompetentMean score 50 Ageism in Europe and the UKFigure 36 Likelihood that most people view those in their 20s as friendly and competent (in ESS countries mean scores, scale ranged from 0: not at all likely to 4: very likely) 4 All ESS Turkey United Kingdom Croatia Czech Republic Slovakia Finland Estonia Hungary Germany Greece Romania Spain Sweden Norway Latvia Netherlands Bulgaria France Ukraine Russia Slovenia Poland Belgium Denmark Switzerland Israel Portugal Cyprus Friendly CompetentMean score 51 Ageism in Europe and the UK 3 Mean score20sOver 70Envy 1.2Pity 2.2Admiration 2.1Contempt 1.2Envy 2.0Pity 1.3Admiration 2.0Contempt 1.3 Mean score 15…2425…4950…6465…7475+ EnvyPityAdmirationContempt Age group Figure 37 Likelihood that most people view those in their 20s and over 70 with certain emotions (in ESS countries mean scores, scale ranged from 0: not at all likely to 4: very likely)Figure 38 Likelihood that most people view those in their 20s with certain emotions … comparing age groups (mean scores, scale ranged from 0: not at all likely to 4: very likely 52 Ageism in Europe and the UK 3 All ESS Turkey United Kingdom Croatia Czech Republic Slovakia Finland Estonia Hungary Germany Greece Romania Spain Sweden Norway Latvia Netherlands Bulgaria France Ukraine Russia Slovenia Poland Belgium Denmark Switzerland Israel Portugal Cyprus Envy AdmirationMean score Figure 39 Likelihood that most people view those in their 20s with envy and admiration (in ESS countries mean scores, scale ranged from 0: not at all likely to 4: very likely) 53 Ageism in Europe and the UKFigure 40 Likelihood that most people view those over 70 with certain emotions … comparing age groups (mean scores, scale ranged from 0: not at all likely to 4: very likely) 3 Mean score 15…2425…4950…6465…7475+ Age groupEnvyPityAdmiration Contempt There appear to be two distinct clusters of emotions associated with people aged over 70: envy and contempt map onto the lower end of the scale, while admiration and pity map onto the higher end of the scale. In general, Figure 40 suggests that there was a decline in the amount of pity and admiration felt towards people over 70 within older age groups. Figure 41 demonstrates that people aged over 70 were most likely to be viewed with pity in Ukraine (=2.75), while least likely in Turkey =1.62). The UK average on being viewed with pity was similar to the ESS average (UK =2.19; Europe =2.18). In the Ukraine, people aged over 70 were also least likely to be viewed with admiration (=1.49), but most likely in Portugal =2.77). People aged over 70 were more likely to be viewed with admiration (=2.43) in the UK in comparison to the ESS average (=2.13). 54 Ageism in Europe and the UKFigure 41 Likelihood that most people view those over 70 with pity and admiration (in ESS countries mean scores, scale ranged from 0: not at all likely to 4: very likely) 3 All ESS Turkey United Kingdom Croatia Czech Republic Slovakia Finland Estonia Hungary Germany Greece Romania Spain Sweden Norway Latvia Netherlands Bulgaria France Ukraine Russia Slovenia Poland Belgium Denmark Switzerland Israel Portugal Cyprus Pity AdmirationMean score 55 Ageism in Europe and the UK 5.3.1.1 Main conclusions € Across the four characteristics … friendliness, competence, having high moral standards, being viewed with respect … people aged over 70 were least likely to be attributed competence. € Younger respondents, under the age of 25, perceived people in their 20s slightly more positively than respondents in all other age categories.€ There was a continuous increase across the age groups of perceiving people aged over 70 as friendly, competent and having high moral standards. € Perhaps predictably, people in their 20s and people over 70 were both more likely to attribute these positive characteristics to their own age groups.€ People aged over 70 were most likely to be viewed as friendly by Norwegian respondents, while least likely by Romanian respondents. Those over 70 were viewed as most competent in Hungary, and least competent in Poland. € In Russia people view those in their 20s as least friendly, and in Greece they are seen as the most friendly. Those in their 20s are also most likely to be viewed as competent in Greece, and least likely in the Ukraine. € People aged over 70 are most likely to be viewed with pity and admiration, representing a benevolent form of prejudice. € People feel the least admiration towards those in their 20s in Hungary, and the most in Turkey. On the other hand, people are least likely to view 20-year-olds with envy in Portugal, and are most likely to do so in Poland. € There was a decline in the amount of pity and admiration felt towards people aged over 70 within older age groups. People aged over 70 are most likely to be viewed with pity in the Ukraine, and least likely in Turkey. In the Ukraine, people over 70 were also least likely to be viewed with admiration, and most likely in Portugal. 56 Ageism in Europe and the UK 4 20sOver 70Friendly 3.0Competent 2.3High moralstandards 3.3 Respect 3.0Friendly 2.0Competent 2.1High moralstandards 1.6Respect 1.7 Mean score Figure 42 Likelihood that most people view those in their 20s and over 70 as possessing certain characteristics in the UK (mean scores, scale ranged from 0: not at all likely to 4: very likely) 5.3.2 United Kingdom In the UK, as for findings across all ESS countries, people aged over 70 were perceived to be low in competence, but friendly (see Figure 42). Those in their 20s were less likely to be viewed as possessing all the characteristics measured. Figure 43 shows less differentiation by different-aged respondents on the various characteristics for people in their 20s. However, it is noteworthy that competence is the most highly rated characteristic for people in their 20s by respondents of all ages. Figure 44 shows that perceived friendliness and respect have similar patterns with little change across the age groups. Older respondents are more likely to perceive the over-70s as competent and as having high moral standards. Figure 45 suggests that people aged over 70 are more likely to be viewed with pity and admiration than people in their 20s in the UK. On the other hand, people in their 20s are more likely to be viewed with envy and contempt. This suggests that the two age categories are likely to experience different forms of prejudice. In general, older respondents are less likely to view people in their 20s with envy and contempt; however, pity and admiration towards those in their 20s increase among older respondents.Findings across all ESS countries appear to show two distinct clusters of emotions (envy…contempt, pity…admiration). Figure 47 shows that older respondents are less likely to view people over 70 with pity. On the other hand, admiration takes more of a curvilinear relationship across the age groups, peaking within the middle age groups. 57 Ageism in Europe and the UK 4 Mean score 15…2425…4950…6465…7475+ FriendlyCompetentHigh moral standardsRespect Age group Figure 44 Likelihood that most people in the UK view those over 70 as possessing certain characteristics, comparing age groups (mean scores, scale ranged from 0: not at all likely to 4: very likely) 3 Mean score 15…2425…4950…6465…7475+ FriendlyCompetentHigh moral standardsRespect Age group Figure 43 Likelihood that most people in the UK view those in their 20s as possessing certain characteristics, comparing age groups (mean scores, scale ranged from 0: not at all likely to 4: very likely) 58 Ageism in Europe and the UK 3 15…2425…4950…6465…7475+ EnvyPityAdmirationContempt Age groupMean score Figure 46 Likelihood that most people in the UK view those in their 20s with certain emotions, comparing age groups (mean scores, scale ranged from 0: not at all likely to 4: very likely) 3 Mean score20sOver 70Envy 1.3Pity 2.2Admiration 2.4Contempt 1.5Envy 2.1Pity 1.5Admiration 1.7Contempt 1.8 Figure 45 Likelihood that most people in the UK view those in their 20s and over 70 with certain emotions (mean scores, scale ranged from 0: not at all likely to 4: very likely) 59 Ageism in Europe and the UK 3 15…2425…4950…6465…7475+ Age groupEnvyPityAdmiration ContemptMean score Figure 47 Likelihood that most people in the UK view those over 70 with certain emotions, comparing age groups (mean scores, scale ranged from 0: not at all likely to 4: very likely) 5.3.2.1 Main conclusions € In the UK, older people are viewed as low in competence and high in warmth. This effect is similar to that found across all ESS countries, however it is stronger in the UK and the difference is statistically significant. In contrast, people in their 20s are most likely to be viewed as competent in comparison to other characteristics.€ People aged over 70 are more likely to be perceived as competent and having high moral standards by older respondents. € People aged over 70 are more likely to be viewed with pity and admiration than those in their 20s. On the other hand, people in their 20s are more likely to be viewed with envy and contempt than those over 70. € In general, envy and contempt towards people in their 20s decreases among older respondents; however, the pity and admiration increases among older respondents. € There is a decline in pity towards people aged over 70 among older respondents. On the other hand, admiration takes more of a variable relationship across the age groups, peaking within the middle age groups. 60 Ageism in Europe and the UK 5.4 Prejudice against younger and older people This section explores negative and positive feelings towards younger and older people and the desire to control prejudice. 5.4.1 All ESS countries Participants were asked to rate how negatively or positively they felt towards people in their 20s and people aged over 70. As demonstrated in Figure 48, people felt more positively towards people aged over 70 in comparison to 20-year-olds across the ESS countries. As expected, people felt more positively towards age groups closer to their own (see Figure 49). For example, people aged over 75 felt more positively towards people aged over 70 in comparison to 20-year-olds. On the other hand, people between the ages of 15 and 24 felt more positively towards 20-year-olds than towards people aged over 70. Figure 50 shows that respondents felt most positively towards people aged over 70 in Latvia (=8.31), and least positively in Turkey =6.75). The UK average was below the ESS average (M UK = 7.39; M ESS = 7.48). The UK felt the most negatively towards people in their 20s (=6.19), while Greece felt the most positively (=8.38). When examining the percentage of respondents who indicated that they had negative feelings (between 0 and 4 on the scale) towards people aged over 70, the largest percentage was found in Turkey (16percent), while Finland had the smallest percentage (1percent) … as shown in Figure 51. Turkey was the only country in which over 10percent of the population expressed negative feelings towards people aged over 70. The UK had a smaller percentage than the ESS average (UK = 3.4percent, ESS = 4.8percent). Finland had the smallest percentage of individuals expressing negative feelings towards people in their 20s (2percent) and the UK had the largest percentage (17percent). Figure 52 indicates that across the ESS countries, people appeared to be concerned with both being unprejudiced and being seen as unprejudiced towards other age groups. The mean for both variables was above the midpoint of the scale; thus, people are both extrinsically and intrinsically motivated to be unprejudiced towards other age groups.Figure 53 demonstrates that individuals are most likely to be intrinsically and extrinsically motivated to control their prejudice toward other age groups if they are between 50 and 64 years old; however, the pattern of means is very similar across the age groups.Respondents in Finland (see Figure 54) felt that it was most important to control prejudice towards other age groups, and people in the Ukraine felt it was least important to control prejudice. Respondents in the UK felt that it was more important to control prejudice in comparison to the European average. 61 Ageism in Europe and the UKFigure 48 Negative…positive feelings towards people in their 20s and people aged over 70 (across ESS countries mean scores, scale ranged from 0: extremely negative to 10: extremely positive)Figure 49 Negative…positive feelings towards people in their 20s and people aged over 70 by age groups (across ESS countries mean scores, scale ranged from 0: extremely negative to 10: extremely positive) 10 Mean score 7.5Over 70 7.120s Mean score 15…2425…4950…64 20s Over 7065…74Total75+ Age group7.237.697.147.447.027.616.867.596.837.747.157.48 62 Ageism in Europe and the UKFigure 50 Negative…positive feelings towards people in their 20s and people aged over 70 (in ESS countries mean scores, scale ranged from 0: extremely negative to 10: extremely positive) 9 All ESS Turkey United Kingdom Croatia Czech Republic Slovakia Finland Estonia Hungary Germany Greece Romania Spain Sweden Norway Latvia Netherlands Bulgaria France Ukraine Russia Slovenia Poland Belgium Denmark Switzerland Israel Portugal Cyprus 20s Over 70Mean score 63 Ageism in Europe and the UK 20 All ESS Turkey United Kingdom Croatia Czech Republic Slovakia Finland Estonia Hungary Germany Greece Romania Spain Sweden Norway Latvia Netherlands Bulgaria France Ukraine Russia Slovenia Poland Belgium Denmark Switzerland Israel Portugal Cyprus 20s Over 70Percentage of negative “ndings Figure 51 Percentage of negative feelings towards people in their 20s and people aged over 70 (includes scores between 0 and 4 on a scale that ranged from 0: extremely negative to 10: extremely positive) 64 Ageism in Europe and the UK 10 Mean score 6.9 7.2 Important to be unprejudicedagainst other age groups Important to be seen as beingunprejudiced against other age groups 10 15…2425…4950…6465…7475+ Important to be unprejudicedagainst other age groups Important to be seen as beingunprejudiced against other age groups 7.0 6.8 7.1 7.0 6.8 7.3 7.0 7.2 Age groupMean score Figure 52 Importance placed on being unprejudiced and being seen as unprejudiced against other age groups (across ESS countries mean scores, scale ranged from 0: not at all important to 10: extremely important)Figure 53 Importance placed on being unprejudiced and being seen as unprejudiced against other age groups-comparing respondents age groups (across ESS countries mean scores, scale ranged from 0: not at all important to 10: extremely important) 65 Ageism in Europe and the UKFigure 54 Importance placed on controlling prejudice, using the average of being unprejudiced and being seen as unprejudiced against other age group variables (in ESS countries average scores, scale ranged from 0: not at all important to 10: extremely important) 10 8.2 8.1 8.1 7.9 7.9 7.8 7.8 7.8 7.7 7.7 7.4 7.4 7.3 7.2 7.1 7.1 7.0 6.8 6.8 6.8 6.6 6.2 5.7 7.0 All ESS UkraineRussiaSlovakiaSpainEstoniaBulgariaCzech RepublicLatviaCroatiaRomaniaSloveniaBelgiumTurkeyFranceIsraelNetherlandsPolandSwitzerlandGermanyUnited KingdomHungaryPortugalCyprusSwedenNorwayGreeceDenmarkFinlandMean score 66 Ageism in Europe and the UK 5.4.1.1 Main conclusions € Across the ESS countries, respondents felt more positively towards people aged over 70 in comparison to 20-year-olds. As might be expected, people felt more positively towards age groups closer to their own. For example, people aged over 75 felt more positively towards people aged over 70 in comparison to people in their 20s. € Respondents in Latvia felt most positively towards people aged over 70, and in Turkey most negatively to that age group. Those in the UK felt most negatively towards those in their 20s, while Greece felt most positively towards that age group. € Across the ESS countries, people appeared to be concerned with both being unprejudiced and being seen as unprejudiced towards other age groups. Individuals are most likely to be motivated to control their prejudice towards other age groups if they are between 50 and 64 years old.€ Respondents in Finland felt it was most important to control prejudice towards other age groups, on the other hand, respondents in the Ukraine felt it was least important to control prejudice towards other age groups. 5.4.2 United Kingdom Figure 55 indicates that in the UK people felt more positively towards people aged over 70 than people in their 20s, which is similar to the findings across the ESS countries. In the UK, older respondents felt less negatively towards people aged over 70 and more negatively towards people in their 20s than did younger respondents (see Figure 57). The reverse was true for attitudes towards people in their 20s, where the younger the respondent the more positive the attitude. However, all age groups tended to view older people more positively. Referring back to Figure 51, the 15…24 age group in the UK showed a relatively high proportion of respondents who reported negative feelings towards people aged over 70 (see Figure 57). However, the other age groups were below the European average. Thus, the youngest age group harboured the most negative feelings towards older people. Figure 58 shows that in the UK, individuals want to control their prejudice; for both variables the mean was above the European average. Figure 59 indicates that the UK shows a similar pattern of findings in the desire to control prejudice across the age groups. Individuals appeared to be slightly more concerned in the 25…49 and 50…64 age groups. 67 Ageism in Europe and the UK 10 Mean score 7.4Over 70 6.220s Figure 55 Negative…positive feelings towards people in their 20s and people aged over 70 in the UK (mean scores, scale ranged from 0: extremely negative to 10: extremely positive)Figure 56 Negative…positive feelings towards people in their 20s and people aged over 70 in the UK, comparing age groups (mean scores, scale ranged from 0: extremely negative to 10: extremely positive) 10 15…2425…4950…6465…7475+ Mean score 20s Over 70Age group6.77.26.27.47.57.45.97.5 68 Ageism in Europe and the UKFigure 57 Percentage of respondents indicating negative feelings towards people in their 20s and people aged over 70 in the UK … comparing age groups (includes scores between 0 and 4 on a scale that ranged from 0: extremely negative to 10: extremely positiveFigure 58 Importance placed on being unprejudiced and being seen as unprejudiced against other age groups in the UK (mean scores, scale ranged from 0: not at all important to 10: extremely important) 12 15…2425…4950…6465…7475+Percentage 20s Over 70 5.38.8 8.34.9 9.04.1 9.33.6 4.0 Age group 10 Mean score 7.5 8.1 Important to be unprejudiced against other age groups Important to be seen as being unprejudiced against other age groups 69 Ageism in Europe and the UKFigure 59 Importance placed on being unprejudiced and being seen as unprejudiced against other age groups in the UK … comparing respondents age groups (mean scores, scale ranged from 0: not at all important to 10: extremely important) 10 Mean score15…2425…4950…6465…7475+ Important to be unprejudiced against other age groups Important to be seen as being unprejudiced against other age groups 7.8 7.2 7.8 7.2 7.9 7.3 8.3 7.5 8.2 7.6 Age group 5.4.2.1 Main conclusions € In the UK, individuals felt more positively towards people aged over 70 than people in their 20s, which is similar to the findings across all ESS countries. € It was found that the older age groups felt more positively towards those aged over 70. On the other hand, it was found that individuals in the older age groups felt less positively towards those in their 20s. € Individuals in the UK want to control their prejudice. The averages on these variables were statistically higher in the UK compared to other countries, thus, the UK is particularly concerned about being unprejudiced toward other age groups. Individuals appear to be particularly concerned in the 25…49 and 50…64 age groups. 70 Ageism in Europe and the UK 5.5 Perceived threat This section provides findings on realistic, symbolic and economic threats that are associated with younger people in their 20s and older people aged over 70. Respondents were asked to rate how much people in their 20s and people aged over 70 posed specific threats. 5.5.1 All ESS countries Figure 60 shows that across the ESS countries, realistic threat (measured by asking respondents how worried they felt about the level of crime committed) was the type of threat most strongly associated with younger people. Following this, 51percent were worried that employers might prefer people in their 20s over older individuals. Respondents were least concerned with symbolic threats, 29percent perceived people in their 20s as having a bad effect on customs and way of life. Individuals were most likely to perceive people aged over 70 as contributing very little to the economy (57percent), followed by being a burden on health care services (49percent). Very few respondents perceived those over 70 as having a negative effect on customs and way of life (8percent).Figure 62 indicates that the younger age groups were more likely to think that people aged over 70 make little economic contribution. Within the 25…49 age group, 62percent believe that people aged over 70 contribute very little economically. In contrast to the findings for economic contribution, Figure 63 demonstrates that within the younger age groups individuals are less likely to see people over 70 as a burden on healthcare services. The reason for this difference may be that older people are more concerned with their own health, feeling more insecure as they get older. Figure 64 demonstrates that in Spain, the UK, Norway, Portugal, Finland, Turkey, Bulgaria and Denmark, less than 40percent of respondents thought that people aged over 70 were a burden on healthcare services. For some of these countries these low percentages may occur because of the structure of healthcare services within that country. In contrast, more than 80percent of Czech Republic respondents felt that people aged over 70 were a burden on their countrys health services. 71 Ageism in Europe and the UKFigure 61 Perceived threats to people over 70 (1: scores 6 to 10 on a scale of 0: no burden to 10: a great burden; 2: scores 0 to 4 on a scale of 0: extremely bad effect to 10: extremely good effect; 3: scores 0 to 4 on a scale of 0: contribute very little economically to 10: contribute a great deal economically) Percentage 1) People over 70 …a burden on health service3) People over 70 …contribution tothe economy2) People over 70 …effect on customsand way of life Figure 60 Perceived threats to people in their 20s (1…2: scores 6 to 10 on scale of 0: not at all worried to 10: extremely worried; 3: scores 0 to 4 on scale of 0: extremely bad effect to 10: extremely good effect; 4: scores 0 to 4 on scale of 0: contribute very little economically to 10: contribute a great deal economically) 100 Percentage1) Worried aboutlevel of crimecommitted bypeople in their 20s2) Worried that employers preferpeople in 20s ratherthan 40 or older3) People in their20s … effect on customs andway of life4) People in their20s … contributionto the economythese days 51 72 Ageism in Europe and the UKFigure 62 Percentage of perceived threat to the economy of people over 70, comparing age groups (includes scores between 0 and 4 on a scale that ranged from 0: contribute very little economically to 10: contribute a great deal economically) Figure 63 Percentage of respondents who see people over 70 as a burden on healthcare services, comparing age groups (includes scores between 6 and 10 on a scale that ranged from 0: no burden to 10: a great burden) 70 Percentage15…2425…4950…6465…74Total75+Age group 62 Percentage15…2425…4950…6465…74Total75+ Age group 73 Ageism in Europe and the UKFigure 64 Percentage of respondents who see those over 70 as a burden on health services in ESS countries (includes scores between 8 and 10 on a scale that ranged from 0: no burden to 10: a great burden) 40 All ESS Spain United Kingdom Norway Portugal Finland Turkey Bulgaria Denmark Netherlands Belgium Romania Sweden Slovenia Israel Croatia Russia Estonia Poland France Latvia Ukraine Switzerland Germany Slovakia Greece Hungary Cyprus Czech RepublicPercentage 74 Ageism in Europe and the UKFigure 65 shows that people in the 50…64 age group are most worried that employers will show preference to those in their 20s. Figure 66 indicates that people across all age groups within Finland are most concerned that employers will show preference to those in their 20s over older individuals (68percent), and least concerned within Norway (29percent). In the UK 50percent were worried that employers would show preference to those in their 20s. Figure 67 shows that in general people aged over 70 are perceived as having a good effect on customs and way of life. All of the ESS countries had an average score in the upper half of the scale. French people were least likely to perceive older people in this manner =6.03), while Greek respondents were most likely to (=8.02). For people in their 20s, several countries did not score within the upper half of the scale (Bulgaria, Germany, Ukraine, Slovakia) indicating that this age group is not seen as having a positive effect on customs and way of life within these countries. Figure 68 shows that across the ESS countries people aged over 70 are less likely to be perceived as making an economic contribution than people in their 20s. Within Slovakia people over 70 are least likely to be seen as making a significant economic contribution (=2.45), but the most likely within France (=5.43). People in Slovakia also thought that people in their 20s made the smallest contribution =3.61), while in Latvia they were seen as making the largest contribution (=6.47). Within France people over 70 and people in their 20s were perceived to make almost identical contributions (20s: =5.45; over 70: =5.43). Percentage15…2425…4950…6465…74Total75+ 40.2 51.0 48.4 53.7 56.6 52.0 Age group Figure 65 Percentage of respondents who are worried that employers will show preference to those in their 20s, comparing age groups (includes scores between 8 and 10 on a scale that ranged from 0: not at all worried to 10: extremely worried) 75 Ageism in Europe and the UKFigure 66 Percentage of respondents who are worried that employers will show preference to those in their 20s (includes scores between 6 and 10 on a scale that ranged from 0: not at all worried to 10: extremely worried)There is no valid data for Latvia. 60 PercentageNorway Cyprus Denmark Turkey Sweden Czech Republic Bulgaria Estonia Slovakia Croatia Hungary Switzerland United Kingdom Romania France Slovenia Belgium Spain Ukraine Russia Germany Poland Portugal Israel Greece Netherlands Finland All ESS 76 Ageism in Europe and the UK 10 All ESS Turkey United Kingdom Croatia Czech Republic Slovakia Finland Estonia Hungary Germany Greece Romania Spain Sweden Norway Latvia Netherlands Bulgaria France Ukraine Russia Slovenia Poland Belgium Denmark Switzerland Israel Portugal Cyprus 20s Over 70Mean score Figure 67 Perceived effect on customs and way of life of people over 70 and people in their 20s (in ESS countries mean scores, scale ranged from 0: extremely bad effect to 10: extremely good effect) 77 Ageism in Europe and the UK 7 All ESS Turkey United Kingdom Croatia Czech Republic Slovakia Finland Estonia Hungary Germany Greece Romania Spain Sweden Norway Latvia Netherlands Bulgaria France Ukraine Russia Slovenia Poland Belgium Denmark Switzerland Israel Portugal Cyprus 20s Over 70Mean score Figure 68 Perceived economic contribution by people over 70 and people in their 20s (in ESS countries mean scores, scale that ranged from 0: contribute very little economically to 10: contribute a great deal economically) 78 Ageism in Europe and the UK 5.5.1.1 Main conclusions € The majority of individuals was most likely to perceive people aged over 70 as contributing little economically (57percent), followed by being seen as a burden on healthcare services (49percent). € The younger age groups were more likely to perceive people over 70 as contributing very little economically. In contrast, within the younger age groups individuals were slightly less likely to see people over 70 as a burden on healthcare services. € Across the ESS countries the 50…64 age group were most worried that employers will show preference to those in their 20s. € In the Czech Republic over 80percent of the population thought that people aged over 70 were a burden on their countrys health services. € In Finland individuals were most concerned that employers will show preference to people in their 20s over older individuals. On the other hand, in Norway individuals were least concerned that employers will show this preference. € Throughout the ESS countries people over 70 were perceived as having a good effect on customs and way of life. 5.5.2 United Kingdom Figure 69 demonstrates that in the UK 68percent of respondents were worried about the level of crime committed by people in their 20s. They were also concerned that employers will show preference to 20-year-olds, with 50percent of respondents expressing some concern. In the UK 41percent of the population thought that people over 70 were making little economic contribution. Following this 36percent thought that people over 70 were a burden on healthcare services (see Figure 70). In comparison, only 5percent of this population perceived those over 70 as having a negative effect on customs and way of life. As shown in Figure 71, in the UK people aged over 70 are most likely to be seen as making little economic contribution by respondents in younger age groups (15…24 and 25…49). However, approximately 30percent of respondents in older age groups also perceive people aged over 70 as contributing little economically. People over 70 were more likely to be seen as a burden on health services by respondents in older age groups in the UK (see Figure 72). In particular, within the 65…74 age group, 46percent of people thought that those over 70 were a burden on health services. Figure 73 demonstrates that in the UK respondents of between 50 and 74 years of age were particularly concerned that employers would show preference towards people in their 20s. In general, the difference between the perceived effect on customs and way of life of people in their 20s and people over 70 increased with the age of the respondent as seen in Figure 74. Thus, people aged over 70 are more likely to be seen as having a positive effect by older respondents. People in their 20s are more likely to be thought to have a negative effect by respondents in older age groups. Among younger respondents there was found to be a larger difference in perceived economic contribution by people in their 20s in comparison to people over 70, as shown in Figure 75. Between the ages of 15 and 64, respondents were more likely to perceive those in their 20s as making a greater economic contribution. 79 Ageism in Europe and the UKFigure 69 Perceived threats to people in their 20s in the UK (1…2: scores 6 to 10 on scale of 0: not at all worried to 10: extremely worried; 3: scores 0 to 4 on scale of 0: extremely bad effect to 10: extremely good effect; 4: scores 0 to 4 on scale of 0: contribute very little economically to 10: contribute a great deal economically) 100 Percentage 1) Worried aboutlevel of crimecommitted bypeople in their 20s2) Worried that employers preferpeople in 20s ratherthan 40 or older3) People in their20s … effect on customs and way of life4) People in their20s … contributionto the economy Figure 70 Perceived threats to people over 70 in the UK (1: scores between 6 to 10 on a scale of 0: no burden to 10: a great burden; 2: scores between 0 to 4 on a scale of 0: extremely bad effect to 10: extremely good effect; 3: scores between 0 to 4 on a scale of 0: contribute very little economically to 10: contribute a great deal economically) Percentage 1) People over 70 … a burden on health service2) People over 70 … effect oncustoms and way of life3) People over 70 …contribution to the economy 80 Ageism in Europe and the UK 60 Percentage15…2425…4950…6465…7475+ 47.2 31.8 53.3 30.6 30.3 Age group 50 Percentage15…2425…4950…6465…7475+ 38.9 31.8 37.3 42.1 Age group Figure 71 Percentage of respondents who see people over 70 as a burden on the economy in the UK, comparing age groups (includes scores between 0 and 4 on a scale that ranged from 0: contribute very little economically to 10: contribute a great deal economically) Figure 72 Percentage of respondents who see people over 70 as a burden on healthcare services in the UK, comparing age groups (includes scores between 0 and 4 on a scale that ranged from 0: no burden to 10: a great burden) 81 Ageism in Europe and the UKFigure 73 Percentage of respondents who are worried that employers will show preference to those in their 20s in the UK, comparing age groups (includes scores between 6 and 10 on a scale that ranged from 0: not at all worried to 10: extremely worried)Figure 74 Perceived effect on customs and way of life of people over 70 and people in their 20s by age groups (mean scores on a scale that ranged from 0: extremely bad effect to 10: extremely good effect) 60 Percentage15…2425…4950…6465…7475+ 49.0 56.0 38.9 56.5 Age group 8 15…2425…4950…6465…7475+Mean score People in their 20s … effect oncustoms and way of life People over 70 … effect oncustoms and way of life 5.56.43 5.07.0 5.07.34 4.77.62 4.57.47 Age group 82 Ageism in Europe and the UK 5.5.2.1 Main conclusions € 50percent of individuals were concerned that employers would show preference to people in their 20s. € In the UK 41percent of the population thought that people over 70 contribute little economically. In addition 36percent thought that people over 70 were a burden on healthcare services. € In the UK people aged over 70 were more likely than people in their 20s to be seen as contributing little economically by younger respondents (aged 15…24 and 25…49). Conversely, older respondents were more likely to see those over 70 as a burden on health services in the UK. € Respondents of between 50 and 74 years were particularly concerned that employers would show preference towards people in their 20s. € Among the younger respondents there was found to be a larger difference in perceived economic contribution of people in their 20s in comparison to people over 70. Between the ages of 15 and 64, people are more likely to perceive people in their 20s as making a greater economic contribution. 7 15…2425…4950…6465…7475+Mean score People in their 20s … contribution to the economy People over 70 …contribution to the economy 5.6 5.55.3 5.25.5 5.05.2 Age group Figure 75 Perceived economic contribution for people aged over 70 and people in their 20s by age groups (mean scores, scale that ranged from 0: contribute very little economically to 10: contribute a great deal economically) 83 Ageism in Europe and the UK 5.6 Perceived status This section explores the perceived social status of the young, middle and old age categories. In order to examine the suitability of job or societal roles for different age categories, we also consider the perceived acceptability of a 30-year-old or a 70-year-old being appointed as a boss. 5.6.1 All ESS countries Figure 76 demonstrates that people in their 40s were perceived to have the highest status, followed by people in their 20s, and people over 70 are perceived to have the lowest status (scoring in the lower half of the scale). As shown in Figure 77, the statuses of the age categories were stable across the age groups. In particular, the status of the middle age category remained virtually the same across the age groups. From this figure it can be inferred that the status of the age categories are not very fluid. There is a large range in the perceived status of people over 70 across the ESS countries (see Figure 78). Within Cyprus people over 70 had the highest status, and the lowest status within Bulgaria. Similar to other countries, the UK had a mean at the midpoint of the scale, thus, people over 70 were not perceived to have a particularly high status. The range of perceived status of people in their 20s was smaller than the range for the perceived status of people over 70. Finland had the highest average on perceived status, while Bulgaria had the lowest average. Figure 80 indicates that across the ESS countries people thought that it was much more acceptable for a qualified 30-year-old to be appointed as a boss than a qualified 70-year-old. The perceived acceptability of a 70-year-old being appointed as a boss is below the midpoint of the scale. These two age categories were used because our previous research (ACE, 2004; Abrams, Eilola and Swift, 2009) showed that they were unambiguously regarded as young and old by most people. We chose 70, rather than 55, 60 or 65 because for some questions it was important to be sure that it was an age that was clearly beyond statutory, default or typical retirement age for all countries. For example, had we selected 60, this would have been below the typical male retirement age in the UK but at the retirement age in France. 84 Ageism in Europe and the UKFigure 76 Perceived status of people in their 20s, 40s and those over 70, comparing age groups (across ESS countries mean scores, scale ranged from 0: extremely low status to 10: extremely high status) Mean score 80 5.26.7 20s40sOver 70Age group Figure 77 Perceived status of people in their 20s, 40s and over 70 (across ESS countries mean scores, scale ranged from 0: extremely low status to 10: extremely high status) Mean score 100 15…2425…4950…6465…7475+ 5.75.15.15.15.26.86.76.76.76.74.74.54.24.34.5 20s Over 70Age group 85 Ageism in Europe and the UKFigure 78 Perceived status of people over 70 (in ESS countries mean scores, scale ranged from 0: extremely low status to 10: extremely high status) 80 7.2 5.9 5.7 5.6 5.6 5.6 5.2 5.2 5.2 5.1 5.1 5.1 5.1 4.8 4.7 4.3 4.2 3.9 3.8 3.7 3.7 3.1 2.4 All ESSTurkeyUnited KingdomCroatiaCzech RepublicSlovakiaFinlandEstoniaHungaryGermanyRomaniaSpainSwedenNorwayLatviaNetherlandsBulgariaFranceUkraineRussiaSloveniaPolandBelgiumDenmarkSwitzerlandIsraelPortugalCyprusGreece Mean score 86 Ageism in Europe and the UKFigure 79 Perceived status of people in their 20s (in ESS countries mean scores, scale ranged from 0: extremely low status to 10: extremely high status) 8 6.7 6.3 5.9 5.9 5.9 5.8 5.8 5.7 5.7 5.7 5.5 5.3 5.3 5.2 5.0 4.9 4.7 4.7 4.5 4.3 4.3 4.3 4.3 4.1 3.7 5.2 All ESSTurkeyUnited KingdomCroatiaCzech RepublicSlovakiaFinlandEstoniaHungaryGermanyRomaniaSpainSwedenNorwayLatviaNetherlandsBulgariaFranceUkraineRussiaSloveniaPolandBelgiumDenmarkSwitzerlandIsraelPortugalCyprusGreece Mean score 87 Ageism in Europe and the UKIn Bulgaria it was least acceptable for a 70-year-old to be appointed as a boss (=3.10), and it is most acceptable in Portugal (=6.74). Romania had the lowest average of perceived acceptability of a 30-year-old being appointed as a boss (=4.99), and Latvia had the highest average (=8.03). Thus, the acceptability of a 30-year-old and a 70-year-old being appointed as a boss fell within different ranges of the scale as shown in Figure 81, with the 30-year-old ranging in the upper half of the scale and the 70-year-old ranging from the lower to the upper half of the scale, overall being viewed as less acceptable for the role. The acceptability of a 30-year-old versus a 70-year-old being appointed as a boss was very similar across the age groups, showing very little change: people thought it was more acceptable to appoint a 30-year-old versus over a 70-year-old as a boss. Figure 80 Acceptability of a qualified 30-year-old or a 70-year-old being appointed as a boss (across ESS countries mean scores, scale ranged from 0: completely unacceptable to 10: completely acceptable) 8 4.8 6.8 Quali“ed 30-year-oldappointed as bossQuali“ed 70-year-oldappointed as bossMean score 88 Ageism in Europe and the UK 9 All ESS Turkey United Kingdom Croatia Czech Republic Slovakia Finland Estonia Hungary Germany Greece Romania Spain Sweden Norway Latvia Netherlands Bulgaria France Ukraine Russia Slovenia Poland Belgium Denmark Switzerland Israel Portugal Cyprus Quali“ed 30-year-oldappointed as boss Quali“ed 70-year-oldappointed as bossMean score Figure 81 Acceptability of a qualified 30-year-old or a 70-year-old being appointed as a boss (across ESS countries mean scores, scale ranged from 0: completely unacceptable to 10: completely acceptable) 89 Ageism in Europe and the UK 5.6.1.1 Main conclusions € People in their 40s were perceived to have the highest social status, followed by people in their 20s, and people over 70 had the lowest social status. € The relative perceived status of each age category does not vary by age group of respondent. € There was a large range in the perceived status of people over 70 across the ESS countries. The range of perceived status of people in their 20s was smaller than the range for the perceived status of people over 70. € Across the ESS countries people thought that it was more acceptable for a 30-year-old than a 70-year-old to be appointed as a boss. € The acceptability of a 30-year-old or a 70-year-old being appointed as a boss fell within different ranges of the scale, with the 30-year-old in the upper half of the scale and the 70-year-old ranging from the lower to the upper half of the scale across the countries. € The relative acceptability of a 30-year-old versus a 70-year-old being appointed as a boss was very similar across the age groups. Figure 82 Acceptability of a qualified 30-year-old or a 70-year-old being appointed as a boss by age groups (mean scores, scale ranged from 0: completely unacceptable to 10: completely acceptable) 10 15…2425…4950…6465…7475+Mean score Quali“ed 30-year-oldappointed as boss Quali“ed 70-year-oldappointed as boss 4.9 6.84.8 6.84.8 6.84.9 6.85.1 Age group 90 Ageism in Europe and the UK 5.6.2 United Kingdom As for all ESS countries, the middle age group is perceived to have the highest social status; however, the young and old age categories are perceived as being similar in status (see Figure 83).Figure 84 demonstrates that the middle age group was perceived as having the highest status across the age categories. In the 15…24 age group, the youngest category had the second-highest status and the oldest category had the lowest status; however, this difference was smaller in the other age groups.The pattern of findings for the acceptability of hiring a 30-year-old versus a 70-year-old as a boss is similar to findings across all ESS countries; however, there was a smaller difference in the acceptability of hiring someone from the two age groups (see Figure 85). From Figure 86 it can be seen that it was more acceptable to appoint a 30-year-old as a boss across the age groups. The largest difference in these ratings occurred in the 15…24 age group. Figure 83 Perceived status of people in their 20s, 40s and over 70 in the UK (mean scores, scale ranged from 0: extremely low status to 10: extremely high status) 10 5.35.27.1 20s40sOver 70Mean score 91 Ageism in Europe and the UKFigure 84 Perceived status of people in their 20s, 40s and over 70 in the UK by age group(mean scores, scale ranged from 0: extremely low status to 10: extremely high status)Figure 85 Acceptability of a qualified 30-year-old or a 70-year-old being appointed as a boss in the UK (mean scores, scale ranged from 0: completely unacceptable to 10: completely acceptable) Mean score 10 15…2425…4950…6465…7475+ 5.75.15.35.55.77.37.17.07.07.15.25.15.15.8 20s Over 70Age group 10 5.3 6.3 Quali“ed 30-year-oldappointed as bossQuali“ed 70-year-oldappointed as bossMean score 92 Ageism in Europe and the UKFigure 86 Acceptability of a qualified 30-year-old or a 70-year-old being appointed as a boss in the UK by age groups (mean scores, scale ranged from 0: completely unacceptable to 10: completely acceptable) 7 15…2425…4950…6465…7475+Mean score Quali“ed 30-year-oldappointed as boss Quali“ed 70-year-oldappointed as boss 5.0 6.25.3 6.2 6.4 6.15.3 Age group 5.6.2.1 Main conclusions € As for the findings from all ESS countries, the middle age category in the UK was thought to have the highest status; however, the young and old age categories were thought to be similar in status.€ The middle age category was perceived as having the highest status across the age groups. € The pattern of findings for the acceptability of hiring a 30-year-old versus a 70-year-old as a boss was similar across all ESS countries; however, there was a smaller difference in the acceptability of hiring someone from the two age groups. 93 Ageism in Europe and the UK 5.7 Intergenerational contact and similarity This section investigates the amount of contact between different age groups, as well as the quality of this contact. The type of contact is investigated within three contexts: friends, family and work. 5.7.1 All ESS countries5.7.1.1 Friends As shown in Figure 87, in the 15…24 age group individuals reported the highest number of friends who are younger than 30 (78percent of respondents aged 15…24 had six or more friends younger than 30). By contrast, within the 75+ age group people were most likely to report having no friends younger than 30 (70percent), while in the 15…24 age group respondents were least likely to have no friends younger than 30 (4percent). To summarise, people became more likely to have no friends younger than 30 as they got older.Figure 87 Percentage of respondents with friends under 30 across ESS countries by age groups 100 15…2425…4950…6465…7475+ 1 to 5 3.977.5 19.818.640.2 46.133.120.8 61.024.214.9 70.319.110.6Percentage Age group 94 Ageism in Europe and the UKFigure 88 Percentage of respondents with friends over 70 across ESS countries by age groups 100 Percentage15…2425…4950…6465…7475+ 1 to 5 80.116.93.0 63.428.97.7 40.641.717.7 15.347.237.5 14.545.739.8 Age group Figure 88 demonstrates that across the ESS countries, respondents in younger age groups were less likely to have friends aged over 70. For example, in the 15…24 age group 80percent did not have friends aged over 70 in comparison to 15percent for the 75+ age group. In contrast, it became more likely that individuals would have one or more friends over 70 in the older age groups.In Switzerland 54percent of the population have six or more friends in their 30s. Across the ESS countries between 25 and 54percent of people indicated that they had six or more friends in their 30s. In the Czech Republic people were most likely to have one to five friends within their 30s. The range across countries was from 20percent to 44percent. 95 Ageism in Europe and the UKFigure 89 Percentage of respondents with friends under 30 in ESS countries 60 All ESSTurkeyUnited KingdomCroatiaCzech RepublicSlovakiaFinlandEstoniaHungaryGermanyGreeceRomaniaSpainSwedenNorwayLatviaNetherlandsBulgariaFranceUkraineRussiaSloveniaPolandBelgiumDenmarkSwitzerlandIsraelPortugalCyprus 1 to 5 Percentage 96 Ageism in Europe and the UKFigure 90 Percentage with friends over 70 in ESS countries 70 All ESSTurkeyUnited KingdomCroatiaCzech RepublicSlovakiaFinlandEstoniaHungaryGermanyGreeceRomaniaSpainSwedenNorwayLatviaNetherlandsBulgariaFranceUkraineRussiaSloveniaPolandBelgiumDenmarkSwitzerlandIsraelPortugalCyprus 1 to 5 Percentage 97 Ageism in Europe and the UK 100 Percentage15…2425…4950…6465…74Total75+ Younger than 30 Older than 70 97.281.9 94.191.1 91.292.5 87.794.0 90.394.7 Age group Figure 91 Can discuss personal issues with friends younger than 30 and older than 70 (percentage across ESS countries, only considering those who have at least one friend at each age level) Figure 90 shows that across all countries and age groups, 52percent of respondents had no friends over 70. In Turkey and Israel nearly 70percent of the population reported no friends over 70. In the UK 43percent of the respondents reported that they did not have friends over 70. Overall, individuals were not likely to report that they had many friends over 70; across the countries the percentage having six or more friends over 70 ranged from 4percent to 31percent. Figure 91 shows that within the 15…24 and 25…49 age groups people were slightly more likely to discuss personal issues with friends under 30 in comparison to friends over 70. However, in the 50…64 age group a transition begins in which it becomes more likely that people can discuss personal issues with friends over 70. Figure 92 indicates that the majority of people felt that they could discuss personal issues with friends younger than 30 and older than 70. For those over 70 the percentages ranged from 76percent to 97percent, while for the under-30s the percentages ranged from 85percent to 98percent. 98 Ageism in Europe and the UK 70 All ESSTurkeyUnited KingdomCroatiaCzech RepublicSlovakiaFinlandEstoniaHungaryGermanyRomaniaSpainSwedenNorwayLatviaNetherlandsBulgariaFranceUkraineRussiaSloveniaPolandBelgiumDenmarkSwitzerlandIsraelPortugalCyprusPercentage Greece Younger than 30 Older than 70100 Figure 92 Can discuss personal issues with friends younger than 30 and older than 70 in ESS countries (only considering those who have at least one friend at each age level) 99 Ageism in Europe and the UK 100 Children or grandchildrenbetween the ages of 15 and 30 Family members over 70YesNo Percentage 5.7.1.2 Family Figure 93 shows that across the ESS countries the same number of people had children or grandchildren as had family members over 70. As shown in Figure 94, within Russia, Latvia, Ukraine, Turkey, Greece, Slovenia, Czech Republic, Romania, Slovakia and Hungary more respondents had children/grandchildren than family members over 70. Within the other countries more people had family members over 70 than children/grandchildren.Figure 93 Individuals who have children or grandchildren between the ages of 15 and 30 (respondents must be over 30 themselves), and family members aged over 70 (respondents all ages), across ESS countries 100 Ageism in Europe and the UK 80 100 All ESS Turkey United Kingdom Croatia Czech Republic Slovakia Finland Estonia Hungary Germany Greece Romania Spain Sweden Norway Latvia Netherlands Bulgaria France Ukraine Russia Slovenia Poland Belgium Denmark Switzerland Israel Portugal Cyprus Children or grandchildrenbetween the ages of 15 and 30 Family members over 70Percentage Figure 94 Individuals who have children or grandchildren between the ages of 15 and 30 (respondents over 30), and family members aged over 70 (respondents all ages), in ESS countries 101 Ageism in Europe and the UKFigure 95 shows that over 85percent of people across Europe felt that they could discuss personal issues either with family members over 70, or with children and grandchildren aged 15…30. This suggests that intergenerational family relationships are generally close. In the 25…49 and 50…64 age groups more people felt that they could discuss issues with their children/grandchildren than with family members over 70. In the 65…74 and 75+ age groups more people felt that they could discuss issues with family members over 70 than with their children/grandchildren. As shown in Figure 96 in each country it was found that most individuals could discuss personal issues with family members. The percentage of people who felt that they can discuss issues with family members over 70 ranged from 76percent to 97percent. In contrast, the range of people who could discuss issues with children/grandchildren ranged from 88percent to 98percent. Figure 95 Can discuss personal issues with children/grandchildren and family members over 70 by age group (percentage across ESS countries) 100 Percentage15…2425…4950…6465…7475+ 93.689.1 94.590.1 92.293.1 88.893.5 Age group Children or grandchildrenbetween the ages of 15 and 30 Family members over 70 102 Ageism in Europe and the UKFigure 96 Can discuss personal issues with children/grandchildren and family members over 70 in ESS countries 80 20100 All ESS Turkey United KingdomCroatia Czech Republic Slovakia Finland Estonia Hungary Germany Greece Romania Spain Sweden Norway Latvia Netherlands Bulgaria France Ukraine Russia Slovenia Poland Belgium Denmark Switzerland Israel Portugal Cyprus Children or grandchildrenbetween the ages of 15 and 30 Family members over 70Percentage 103 Ageism in Europe and the UK 5.7.1.3 Work Figure 97 indicates that across all ESS countries most respondents were either engaged in paid work (45percent) or had carried out no work activities (44percent) within one month prior to the interview. Few respondents had engaged in voluntary work alone (4percent) or in combination with paid work (7percent). Figure 98 shows that for paid work and the combination of paid and voluntary work, individuals were more likely to spend time with people in their 20s than with people over 70. In voluntary work, there was a smaller difference in the amount of time spent with people in their 20s than over 70, probably because older people are more likely to engage in voluntary work. Figure 99 indicates that older respondents are more likely to spend time with people over 70 and less likely to spend time with those in their 20s. Within the 65…74 age group there is the least difference in the time spent with people in their 20s than people over 70 in comparison to other age groups. Figure 100 shows that in Israel people reported spending the most time with people over 70 (33percent), and in Bulgaria the least (9.8percent). Individuals in Russia spent the most time with people in their 20s (89percent), and in Greece the least time (49percent). The largest difference between time spent with people in their 20s and over 70 occurs in Russia, and the smallest difference occurs in Israel. 50 Percentage Paid work onlyVoluntary work onlyPaid and voluntary work Figure 97 Percentages of respondents work activities during the month prior to interview, across ESS countries 104 Ageism in Europe and the UK 90 Percentage Paid work onlyVoluntary work onlyPaid and voluntary work 20s Over 70 100 15…2425…4950…6465…7475+Percentage 20s Over 70Age group Figure 98 Percentage of individuals across ESS countries who have spent time (some of the time, most of the time and all/almost all of the time) working with colleagues or volunteers in their 20s or over 70Figure 99 Percentage of individuals in different age groups who have spent time (some of the time, most of the time and all/almost all of the time) working with colleagues or volunteers in their 20s and over 70 105 Ageism in Europe and the UK 80 20100 All ESS Turkey United Kingdom Croatia Czech Republic Slovakia Finland Estonia Hungary Germany Greece Romania Spain Sweden Norway Latvia Netherlands Bulgaria France Ukraine Russia Slovenia Poland Belgium Denmark Switzerland Israel Portugal Cyprus 20s Over 70 Figure 100 Percentage of individuals across ESS countries who have spent time (some of the time, most of the time and all/almost all of the time) working with colleagues or volunteers in their 20s or over 70 106 Ageism in Europe and the UK 5.7.1.4 Perceived similarity Figure 101 indicates that respondents most often viewed people in their 20s and people aged over 70 as two separate groups within the same community (48percent). Respondents were also more likely to see people in the two age groups as individuals (29percent) rather than completely separate groups (13percent). In comparison, only 10percent of people see people in their 20s and people over 70 as one group. In Cyprus, France and Slovakia less than 40percent of the respondents thought of the two age groups as separate groups within the same community (see Figure 102). In comparison, in the Czech Republic and Poland over 60percent of the population thought of the age groups as being separate groups within the same community. Only in Croatia, France, and Cyprus did respondents more often think of those in the age groups as individuals than two separate groups in the same community. In all of the other countries participants more often thought of the age groups as two separate groups within the same community rather than individuals. Figure 101 How individuals see people in their 20s and people over 70 across ESS countries (percentages by perception) 100 PercentageOne groupTwo separate groupssame communityTwo separate groupsnot same communityIndividuals ratherthan groups 10 107 Ageism in Europe and the UK 70 All ESS Turkey United Kingdom Croatia Czech Republic Slovakia Finland Estonia Hungary Germany Greece Romania Spain Sweden Norway Latvia Netherlands Bulgaria France Ukraine Russia Slovenia Poland Belgium Denmark Switzerland Israel Portugal Cyprus Individuals ratherthan groups Two separate groupssame communityPercentage Figure 102 How individuals see people in their 20s and people over 70 in ESS countries (percentages by perception) 108 Ageism in Europe and the UK 5.7.1.5 Main conclusions € Across the ESS countries it was found that friendships were age-segregated, people were more likely to have friends of a similar age to themselves. € Across all countries and age groups, 52percent of people indicated they had no friends over 70. Individuals in younger age groups were less likely to have friends over 70. Few people (3percent to 18percent) reported that they had many friends over 70 (6 or more) across the ESS countries. € Over 85percent of people across Europe felt they could discuss personal issues either with family members over 70, or with children and grandchildren aged 15…30. This suggests that intergenerational family relationships are generally close. Within the 15…24 and 25…49 age groups people more often discussed personal issues with friends younger than 30 in comparison to friends over 70. However, within the 50…64 age group a transition begins in which it becomes more likely that people can discuss personal issues with friends who are older than 70. The majority of people felt that they could discuss personal issues with friends either younger than 30 or older than 70 across the ESS countries, the lowest percentage was 76percent. € Only in Russia, Latvia, Ukraine, Turkey, Greece, Slovenia, Czech Republic, Romania, Slovakia and Hungary did more respondents have children/grandchildren than family members over 70. In all of the other countries more people have family members over 70 than have children/grandchildren. € Most people either were engaged in paid work or had carried out no work activities within one month prior to the interview. For paid work and the combination of paid and voluntary work, individuals were more likely to spend time with people in their 20s rather than people over 70. Respondents in older age groups were less likely to spend time with people in their 20s while at work. The largest difference between time spent with people in their 20s and over 70 at work occurs in Russia, while the smallest difference occurs in Israel. € Respondents most often viewed people in their 20s and over 70 as two separate groups within the same community (48percent). Following this, people were also very likely to see people in the two age groups as individuals rather than in two groups (29percent). However, in most countries participants more often thought of the age groups as two separate groups within the same community. 109 Ageism in Europe and the UK 5.7.2 United Kingdom5.7.2.1 Friends Figure 103 demonstrates that respondents in older age groups were less likely to have friends in their 30s. Specifically, in the 25…49 age group, less than 1percent reported having no friends younger than 30. However, in the 75+ age group, 60percent reported that they have no friends younger than 30. Figures 103 and 104 suggest that people are age-segregated in their friendships, being more likely to have friends who are around the same age as themselves (Figure 104). For example, only 7percent of respondents aged 15…24 reported having six or more friends over 70, whereas 58percent of respondents aged 75+ reported six or more older friends. Similar to the findings across all ESS countries, people between 15 and 49 years of age discuss personal issues more often with a friend younger than 30 than a friend of over 70 as shown in Figure 105. However, in the 50…64 age group there is a transition in which respondents more often discuss their personal issues with friends older than 70 rather than with friends younger than 30. 100 15…2425…4950…6465…7475+ 1 to 5 0.39.190.5 17.239.543.3 35.729.9 48.524.327.2 59.924.116.0Percentage Age group Figure 103 Number of friends younger than 30 in the UK by age group (percentages) 110 Ageism in Europe and the UK 100 15…2425…4950…6465…7475+ 1 to 5 63.629.5 55.035.89.2 33.639.926.5 12.528.659.0 10.331.758.0Percentage Age group Figure 104 Percentage of number of friends over 70 in the UK Figure 105 Percentage who can discuss personal issues with friends younger than 30 and older than 70 in the UK by age group (only considering those who have at least one friend at age level) 100 15…2425…4950…6465…7475+Percentage 96.382.3 91.487.1 84.586.9 82.991.7 81.087.0 Younger than 30 Older than 70Age group 111 Ageism in Europe and the UK 100 49.4 Children or grandchildrenbetween the ages of 15 and 30 Family members over 70YesNo Percentage Figure 106 Percentage of individuals who have children or grandchildren between the ages of 15 and 30 (respondents must be over 30 themselves), and family members aged over 70 (respondents all ages), in the UK 112 Ageism in Europe and the UK 100 15…2425…4950…6465…7475+Percentage 89.8 92.689.6 90.485.0 83.690.0 75.587.1 Children or grandchildrenbetween the ages of 15 and 30 Family members over 70Age group Figure 107 Can discuss personal issues with children/grandchildren and family members over 70 in the UK by age group 5.7.2.2 Family In the UK, respondents were more likely to have family members over 70 than grandchildren/children between the ages of 15 to 30 as represented in Figure 106. This contrasts with the finding across all ESS countries that respondents are equally likely to have family members from the different generations. Figure 107 indicates that individuals between 25 and 64 years of age discuss their personal issues with children/grandchildren more often than with family members over 70, but in the older age categories respondents discuss personal issues more often with family members over 70. 113 Ageism in Europe and the UK 60 Percentage 8.7 36.9 6.4Paid work onlyVoluntary work onlyPaid andvoluntary work Figure 108 Percentage of individuals who have done certain work activities one month prior to the interview in the UK 5.7.2.3 Work Figure 108 demonstrates that people in the UK were more likely to have participated in paid work or no work activities at all prior to the interview, compared to voluntary, or a combination of paid and voluntary work. This finding is similar to that for all ESS countries. When it comes to paid work, respondents reported spending more time with people in their 20s than people aged over 70. However, for voluntary work and the combination of paid and voluntary work individuals spent more time with people over 70 than people in their 20s as indicated in Figure 109. When comparing the age groups it was found that older respondents spent more time with people over 70 than did younger respondents (see Figure 110); the range from younger to older age groups is 14percent to 75percent. On the other hand, the reverse pattern occurred for people in their 20s, with older respondents less likely to report spending time with people in their 20s. 114 Ageism in Europe and the UK 100 15…2425…4950…6465…7475+Percentage 91.114.2 79.517.6 70.825.9 37.457.1 25.3 20s Over 70Age group Figure 110 Percentage of individuals who have spent time (some of the time, most of the time and all/almost all of the time) working with colleagues or volunteers in the UK, comparing age groups 100 20sOver 70Paid workonlyVoluntarywork onlyPaid andvoluntary workPaid workonlyVoluntarywork onlyPaid andvoluntary work 25.5 27.3 47.2 78.9 15.3 5.8 Percentage Figure 109 Percentage of individuals who have spent time (some of the time, most of the time and all/almost all of the time) working with colleagues or volunteers from either age group, in the UK 115 Ageism in Europe and the UK 100 PercentageOne groupTwo separate groupssame communityTwo separate groupsnot same communityIndividuals ratherthan groups 11.8 30.0 11.2 Figure 111 How individuals see people in their 20s and people over 70 in the UK (percentages by perception) 5.7.2.4 Perceived similarity Figure 111 indicates that younger people in their 20s and older people in their 70s are most often seen as two separate groups within the same community (47percent). In comparison, only 12percent perceived people in their 20s and people over 70 as one group. Following this 30percent of respondents thought of those in their 20s and those over 70 as individuals rather than groups. In contrast only 11percent thought of these age groups as belonging to separate communities. 116 Ageism in Europe and the UK 5.7.2.5 Main conclusions € Similar to the findings across ESS countries, individuals in the UK were more likely to be friends with people who are of a similar age to themselves. € Individuals between 25 and 64 years of age discussed their personal issues more often with children/grandchildren than they did with family members over 70. From 65 onwards, however, people discussed personal issues more often with older generation family members over 70. € In the context of paid work, people reported spending more time with those in their 20s than with people of over 70. However, for voluntary work and the combination of paid and voluntary work, individuals spent more time with people over 70. € When comparing the age groups it was found that older respondents spent more time with those over 70 at work. However, the younger respondents spent more time with people in their 20s at work. € People in their 20s and people over 70 were most often seen as two separate groups in the same community (47percent). By comparison, only 12percent thought of people in their 20s and people over 70 as one group. 117 Ageism in Europe and the UK 6.1 Age categorisation and identification Across the 28 countries participating in the ESS, youth is, on average, perceived to end at 40, and old age is perceived to start at 62. There was less consensus about the end of youth than the onset of old age … the range of average responses was 18 years in the former and 13 years in the latter case. Consequently, the perceived duration of middle age varies considerably across ESS countries. The average duration of middle age is 22 years, but perceptions range from 15 years in Romania to 30 years in Portugal. Compared with the majority of other ESS countries, people in the UK perceived, on average, that the end of youth and the onset of old age are both earlier. In the UK, the perceived end of youth was 35 years (compared to the ESS average of 40), while the perceived start of old age was 59 compared to the ESS average of 60. Together, this means that on average individuals in the UK perceive the duration of middle age to be relatively longer (24 years) in comparison to the average of all other ESS countries (22 years). Reflecting the actual population distribution of ages, most respondents in the ESS categorised themselves as middle aged. Surprisingly, however, those who self-categorised as middle aged had the weakest sense of belonging to their age group. Those who self-categorised as young had the strongest sense of belonging to their age group, followed by those who self-categorised as old. In comparison to the ESS countries, individuals in the UK reported a weaker sense of belonging to all age groups (young, middle and old).Age categorisation is highly relevant to the issue of age-based discrimination. Ageism arises in relation to specific age points, particular age ranges, and also in terms of general category labels such as young or old. Interestingly, people also apply ageist stereotypes to themselves by self-categorising into age groups, sometimes without being aware that they are doing so (Levy and Banaji, 2002). The use of age categorisation can be highly problematic because it may cause people to restrict their own horizons based on ageist assumptions (e.g. they see themselves as too young or too old to pursue particular activities or roles). For this reason, the very act of categorising oneself and others into different bands and the way people define those bands has significant implications for peoples choices and actions. Although age categories are based on natural and physical attributes (such as health status, physical appearance, fitness and functional ability), the boundaries between the categories are fuzzy and the categories represent the perceived typical member of the category. This report provides evidence that age categorisation differs across nations and that the perceived duration of middle age was somewhat longer for people in the UK than compared to all other ESS countries. Of particular interest is that the perceived onset of old age was around 60 years of age, which is five years earlier than the statutory retirement age (for men). Currently there is political emphasis in the UK on prolonging working life and deferring retirement in order to cope financially with the increased longevity of citizens. An important question, however, is whether people are prepared to accept co-workers or superiors whom they perceive as old. It is likely that categorisation of someone as old goes hand in hand with perceiving someone as too old, especially for work-related tasks that require a high level of physical or intellectual abilities. Finally, the UKs lower sense of belongingness to age groups is interesting in the sense that people in the UK may not feel as much benefit from belonging to these groups as people in other countries. 6 Conclusions 118 Ageism in Europe and the UK 6.2 Experiences of age discrimination Across ESS countries just under half of the respondents (44.4percent) perceived age discrimination as a very serious or a quite serious issue. However, the UK was among five countries (with France, Romania, Portugal and Norway) where more than half of respondents thought that ageism was a problem. Respondents from Turkey and Denmark showed the least recognition of ageism as a serious problem. Moreover, in Turkey the proportion of respondents who said that there was no ageism at all in their country was larger than the proportion who thought that it was a serious problem. Across the ESS countries those aged 50 to 64 were most likely to perceive age discrimination as a serious problem, perhaps because of heightened concern over approaching retirement. Experiences of ageism were also very prevalent, and among people of all ages, ageism was experienced by more people than either sexism or racism/ethnic prejudice. In line with previous research monitoring ageism in the UK (e.g. ACE, 2004; Abrams, Eilola and Swift, 2009), age discrimination was the most frequently experienced form of discrimination for every age group. Among the ESS countries, reports of unfair treatment ranged from 17percent (in Portugal and Cyprus) to 54percent (in the Czech Republic) with an average of 35percent. The most commonly reported experiences of age discrimination were reports of people who felt they had been ignored or patronised. Compared to the ESS averages, more people in the UK reported experiencing subtle forms of prejudice such as lack of respect, and fewer experienced blatant forms of prejudice such as being insulted. Negative discrimination is the behavioural denial of a benefit or right to something, based on the classification of a person as a member of a social category. The findings presented in this report show considerable variation of different forms of experiences of age discrimination across the ESS countries. It is intriguing to consider why these differences exist across countries and what kind of country characteristics lead to higher or lower reports of age discrimination. Yet a more basic point is that the wide differences in the prevalence of experience of ageism in different countries shows that this type of experience is clearly amenable to influence from cultural, social and political sources, and is not an evitable consequence of biological and maturational differences between people of different ages.What we do know from this research is that about one in four respondents across all age groups reported having been insulted, abused or denied services as a result of their age. Subtle forms of age discrimination are even more commonly reported, across all ESS countries. This may have important consequences for older people, because it is the subtle form of prejudice that may make it so difficult for them to feel empowered and be taken seriously. Constant exposure to subtle forms of age discrimination may have a negative impact on older peoples age identification, their self-esteem and their performance (e.g. in a work setting) with wide-reaching implications. For instance, Levy and colleagues (Levy et al., 2002) showed in a longitudinal study that older people with more positive self-perceptions of ageing lived 7.5 years longer than those with less positive self-perceptions after controlling for gender, socio-economic status, functional health, and loneliness. 119 Ageism in Europe and the UK 6.3 Stereotype content: benevolent and hostile forms of prejudice In all ESS countries (with the exception of Latvia and Russia), older people were seen more as friendly than competent. The combination of perceptions along dimensions of competence and warmth (friendliness) and emotions directed towards groups can inform us about what kinds of prejudice are likely to be experienced. Although both target groups, those aged under 20 and over 70, were viewed with equal admiration, people under 20 were also viewed with envy, while those over 70 were pitied. Evaluations of pity and admiration towards those over 70 represent a benevolent form of prejudice which is consistent with previous research (e.g. Cuddy, Norton and Fiske, 2005). There was more variation in perceived characteristics attributed to those over 70 by older respondents. For example, those over 65 were more likely to perceive people over 70 as competent and were more likely to attribute pity and admiration to their group. In the UK older people were more likely to be perceived as friendly and less as competent in comparison to the average of other countries; these differences were statistically significant. Respondents felt less admiration and more envy for those under 20 compared to the ESS average. Respondents felt more admiration for those over 70 compared to the ESS average, but evaluations of pity did not differ from the other ESS countries. Older people were seen more positively by older respondents. The findings are largely consistent with previous research from the UK indicating that older and younger people are victims of different stereotypes, and therefore prejudice. Older people tend to be perceived paternalistically and these perceptions are associated with benevolent feelings such as pity and sympathy. Although these are positive in tone, they have serious implications (e.g. for employment) if identical failures in performance are explained in terms of lack of competence in the old, but lack of effort among the young. Moreover, prejudice cuts both ways … younger people are often judged to be relatively cold, which is likely to result in their being excluded from activities and opportunities. The findings provide an in-depth insight into the stereotypes of young and old across countries and therefore into the likely differences in opportunities that these groups will be afforded. Another important implication of age stereotypes is that they serve as self-fulfilling prophecies for older people. Although the findings in this report show that the over-70s are more likely to be perceived as competent and having high moral standards if respondents themselves are older, there is a growing body of research suggesting that widely shared societal stereotypes about old age can be endorsed by older people themselves in the form of auto-stereotypes (Kruse and Schmitt, 2006).Furthermore, exposure to negative societal age stereotypes can have a significant impact on older peoples behaviour and even their cognitive physiological functioning (for a review, see Levy, 2003). For instance, Abrams and colleagues (Abrams et al., 2008) demonstrated that when older people believe that their competence is being compared with that of younger people they show dramatic decrements in cognitive and mathematical performance a powerful demonstration of stereotype threat. This suggests that older people may perceive the 70+ age group more positively than younger people do, nevertheless, they are still susceptible to negative age stereotypes if they are confronted with them. 120 Ageism in Europe and the UK 6.4 Prejudice against younger and older people In comparison to younger people, those over 70 are viewed more positively. Not surprisingly, people also feel more positive towards their own age groups. In many participating countries feelings towards people over 70 are more positive than those towards people under 20. A few exceptions are Turkey, Croatia and Greece, as well as respondents who belong to the youngest age group (15…24 years).In line with other countries in the ESS, the UK respondents showed more positive feelings towards older people than younger people, and this pattern was consistent in every age group. Notably the UK had the largest percentage of individuals who expressed negative feelings towards younger people. With regard to controlling prejudice, the findings showed that people were motivated to control their prejudice and to be seen as unprejudiced. Respondents from Finland, Denmark and Greece showed greater self-control over expressing prejudice, whereas respondents from the Ukraine, Russia and Slovakia showed lower levels of self-control. Compared to the ESS average, respondents in the UK felt that it was important to control prejudice. This finding is consistent across all age groups.Ageism assumes a different pattern from some other forms of prejudice in the sense that in certain situations, or when thinking of particular contexts, people generally seem to be less cautious about expressing age prejudice explicitly (Nelson, 2002). In this way, ageism is quite distinctive from prejudice based on race or gender. Since ageism seems to be expressed more freely, it is important to understand who feels more (and less) inhibited about expressing ageism and why. The findings show that direct expressions of prejudice vary depending on the country and the target age group. It seems that direct prejudice towards younger people is a more pronounced issue in the UK than it is towards older people. However, this does not mean that direct prejudice towards older people does not exist in the UK. It may just be that this form of prejudice is more evident if people are asked about their feelings towards older people in specific situations, rather than if asked about their general feelings towards older people. 121 Ageism in Europe and the UK 6.5 Perceived threat Perceived threat is an important contributor to prejudice and is measured in terms of realistic threat, symbolic threat and economic threat. Based on previous research (Stephan and Stephan, 2000), economic conflicts should be the most salient concern as they provide a basis for resentment and prejudice and are therefore likely to underpin ageist attitudes. Our analyses revealed that younger people are perceived to be more of a realistic threat (measured by concern about crime committed by younger people). In contrast older people are seen primarily as an economic threat and as a burden on health services. The belief that those over 70 present a greater economic threat is particularly felt among the younger respondents (15…24 years), but younger respondents are less likely to perceive older people to be a burden on health services. A comparison of the ESS countries shows that the perception that people over 70 are a burden on health services is particularly strong in the Czech Republic (over 80percent of respondents agreed), while less than 40percent of respondents in the UK agreed with this view. It should also be noted that in Norway, Romania, Finland and Portugal younger and older people are perceived as making similar economic contributions. Those under 20 are also perceived to be a threat in terms of competition for employment opportunities. Respondents approaching retirement age and those who are likely to be retired (over 65 years) were more worried about employers favouring younger people.In all ESS countries older people are perceived as having a positive influence on customs and way of life in comparison to those under 20; however the extent to which older people are perceived more favourably differs considerably between ESS countries. In the UK, in line with the general European trend, people are more likely to perceive those under 20 as posing a realistic threat and those over 70 as a burden on health services and an economic threat. Fiftypercent of respondents worried that employers would show a preference for those in their 20s. These intergenerational threat findings corroborate past research (Abrams, Eilola and Swift, 2009) indicating concern in the UK that older people pose an economic threat by not contributing enough to the economy, and an indirect threat by being a burden on health services. This finding might be a consequence of the growing pressures on pension provision. It seems possible that these perceptions of threat might well be accentuated by peoples concerns about their national economy.An increase in retirement age may lead to more positive views of the likely economic contribution made by older people. On the other hand, it is likely that older people who work for longer may be seen as posing a greater threat in terms of limiting employment opportunities for other age groups. High unemployment rates in a country may even lead to more pronounced perceptions of intergenerational threat. Therefore it is important to monitor these perceptions as they may feed age prejudice. 122 Ageism in Europe and the UK 6.6 Perceived status The analyses reveal that the middle age group, those in their 40s, were accorded the highest social status, followed by those in their 20s. Those in their 70s were afforded the lowest status. This pattern is consistent by age of responder. Generally there was more variability in the perceived status of older people than younger people. Across all ESS countries, there was more agreement that a suitably qualified younger person (aged 30) is more acceptable as a boss than a similarly qualified person aged 70; this finding was stable across age groups. These trends also held in the UK. Different age groups are associated with different roles, status, power and social responsibilities. The findings from this report corroborate earlier research on this topic (Garstka et al., 2004). If older people are seen as less acceptable in a position of high status at the workplace, this may lead to problems given the likelihood that a larger proportion of the workforce will be older in future. Future research should monitor what the implications are if older people are seen as less acceptable in the position of boss. What kinds of direct and indirect responses of prejudice may be provoked in employees who have a boss who is relatively old? 6.7 Intergenerational contact and similarity The conclusions for intergroup contact are presented separately in relation to friends, family and work. 6.7.1 Family The family provides an important medium for intergenerational understanding. Across the 28 ESS countries, 60percent of respondents have children or grandchildren aged between 15 and 30 years of age, and 60percent have family members over 70 years of age. In the UK, reflecting its ageing population, the percentage of respondents with family members over 70 years of age is higher than those who have children or grandchildren under 30. Across Europe as a whole, with the exception of Turkey, over 80percent of respondents report feeling comfortable discussing personal issues with family members over 70. The findings indicate that intergenerational relationships within families remain prevalent and strong across Europe. 123 Ageism in Europe and the UK 6.7.2 Work Among the 52percent of ESS respondents who were involved in paid work (some of which also included a combination of paid and voluntary work), over 75percent had work-related contact with people in their 20s, whereas far fewer (e.g. 13percent of people in paid work) had work-related contact with people aged over 70. Among the 7percent of respondents who were involved in unpaid voluntary work, over half had contact with others aged under 20 and with others aged over 70. However, there were stark differences in levels of contact with younger or older colleagues, depending on respondents own age. Contact with people in their 20s remains above 50percent for respondents aged up to 75, whereas contact with people in their 70s is experienced by less than a quarter of respondents aged under 65 and does not reach 50percent until respondents are aged 75. Only those aged 65 to 74 had almost equal levels of contact with colleagues aged under 20 and those over 70. In the UK, this pattern is somewhat stronger. Only 14percent of people aged under 25 work alongside people aged over 70, whereas among those aged over 64, 57percent work with others aged over 70 and only 37percent work with people in their 20s. Therefore, there is a more dramatic switch in the age profile of co-workers around the age of 65 in the UK. It seems that although the working context does provide a place for intergenerational contact, this contact reduces dramatically once people in work move beyond their mid-60s. This signals that age-based segregation may have a stronger and perhaps unexpected impact on peoples lives in that age period as they lose social connections that could be important in terms of social capital and wellbeing. 6.7.3 Friends Across the ESS countries, the number of friendships with people aged under 30 and over 70 depends on respondents own age, with friendships tending to be restricted to others in the same age range. At the extremes, less than 5percent of people under the age of 25 report having a friend aged over 70, and less than 30percent of people over the age of 75 have a friend under 30. This pattern is slightly less extreme in the UK but the trend is the same. Might it be that intergenerational friendships are not as good in some way as same-generation friendships? It seems not. Although across the ESS and in the UK people report feeling a little more comfortable discussing personal issues with friends of their own age, well over three-quarters of respondents said that they felt able to discuss personal issues with their friends, regardless of which age group the friends were from. This suggests that the quality of friendships that do cross age boundaries is high, and that the barriers to such friendships may well be practical and structural (e.g. lack of opportunity), rather than simply that people are necessarily resistant to forming such friendships. Overall, these findings demonstrate a surprising and concerning lack of intergenerational friendship. Friendships provide important access to social networks, resources, skills, facilities and opportunities. To the extent that friendships are age-segregated there are significant implications for the social inclusion and participation of people over 70, particularly those who do not have other relationships with children or other younger relatives. A more age-integrated society may become increasingly important in an ageing society in which fewer older people can rely on family ties and there are increasing financial, social and personal burdens being placed on a relatively decreasing part of the population (i.e. younger people). 124 Ageism in Europe and the UK 6.8 Perceived similarity Finally, the majority of ESS respondents believe that people in their 20s and people over 70 are two separate groups but are part of the same community (48percent). However, a total of 29percent view them as individuals and not groups. The UK is in line with the general trend across the ESS countries. The results suggest that people in their 20s and people aged over 70 are not seen as a unified group. Extensive research shows that prejudice is reduced when people from another group are viewed either as individuals or as all sharing a common group rather than as belonging to distinctive and separate groups (Gaertner and Dovidio, 2000). The findings from this report show that almost one-third of the respondents perceive young and old as individuals, suggesting that they would have less prejudice against these age groups. Nevertheless, almost half of the respondents perceive young and old as separate groups (who are part of the same community). Although this perception of similarity is more positive than if these age groups were seen as two separate groups who are not even part of the same community, it also means that most people do not see younger and older people as part of a common group. An important question to address would be whether positive intergenerational contact enhances shared group identity and perceptions of intergenerational similarity, which in turn lead to less prejudice towards young and old. 6.9 Overall conclusion Discrimination based on age is more prevalent in Europe than other forms of discrimination. Ageism is not an inevitable consequence of real or natural differences between age groups. It is rooted in the way that people categorise and stereotype age, in their perceptions of threat from different age groups, and in lack of shared understanding and positive relationships between people of different ages. All of these sources of ageism are prone to aggravation or amelioration through legislative, cultural and economic differences, so it is vital to understand and influence those elements to tackle ageism effectively. It is striking that more than a quarter of Europeans surveyed have been insulted, abused or denied services on grounds of age. Even more commonly, ageism is experienced subtly and indirectly. Older people are likely to be stereotyped as warm but incompetent, feeding low expectations and lack of inclusion. Age segregation, which is prevalent in work and friendships, is likely to reinforce ageist perceptions. An ageing population poses not just economic and practical but also social and psychological challenges. To tackle all of these it is important to understand the forms and causes of prejudice that are exhibited towards people of different ages, as well as recognising how this affects peoples own experiences of ageing and their social being. 125 Ageism in Europe and the UKAbrams, D. (2010) Processes of Prejudice: Theory, evidence and intervention, Research Report 56, London: EHRC. Available at: www.equalityhumanrights.com/uploaded_files/research/56_processes_of_prejudice.pdfAbrams, D., T. Eilola and H. Swift (2009) Attitudes to Age in Britain 2004…08, Report for the Department of Work and Pensions (Research Report No. 599)Abrams, D. et al. (2008) Threat Inoculation: Experienced and imagined intergenerational contact prevents stereotype threat effects on older peoples math performance, Psychology and Aging23: 934…939Abrams, D, Vauclair, C-M, Swift, H (2011) Predictors of attitudes to age across Europe Department for Work and Pensions, UK (Research Report No 735)ACE (2004) How Ageist Is Britain? London: Age Concern EnglandCuddy, A. J. C., M. Norton and S. T. Fiske (2005) This Old Stereotype: The pervasiveness and persistence of the elderly stereotype, Journal of Social Issues, 61: 267…285Fiske, S. T. et al. (2002) A Model of (Often Mixed) Stereotype Content: Competence and warmth respectively follow from perceived status and competition, Journal of Personality and Social Psychology, 82: 878…902Gaertner, S. L. and J. F. Dovidio (2000) Reducing Intergroup Bias: The common ingroup identity model, Philadelphia, PA: Psychology PressGarstka, T. A. et al. (2004) How Young and Older Adults Differ in Their Responses to Perceived Age Discrimination, Psychology and Aging19: 326…335Hogg, M. A. and D. Abrams (2001) Intergroup Relations: Essential readings, New York: Psychology PressJost, J. T. and M. R. Banaji (1994) The Role of Stereotyping in System Justification and the Production of False Consciousness, British Journal of Social Psychology, 22: 1…27Kruse, A. and E. Schmitt (2006) A Multidimensional Scale for the Measurement of Agreement with Age Stereotypes and the Salience of Age in Social Interaction, Ageing and Society, 26: 393…411Levy, B. and M. Banaji (2002) Implicit Ageism, in T. Nelson (ed.), Ageism: Stereotyping and prejudice against older personsCambridge, MA: Massachusetts Institute of TechnologyLevy, B. R. (2003) Mind Matters: Cognitive and physical effects of aging self-stereotypes, The Journals of Gerontology: Series B: Psychological Sciences and Social Sciences, 58B: 203…211Levy, B. R. et al. (2002) Longevity Increased by Positive Self-Perceptions of Aging, Journal of Personality and Social Psychology83: 261…270Nelson, T. D. (ed.) (2002) Ageism: Stereotyping and prejudice against older persons, Cambridge, MA: MIT PressOECD (2009) Pensions at a Glance 2009: Retirement-income systems in OECD and G20 countries. Available at: www.oecd.org/els/social/pensions/pagPettigrew, T. F. (1998) Intergroup Contact Theory, Annual Review of Psychology, 47: 65…85Plant, E. A. and P. G. Devine (1998 Internal and External Motivation to Respond without Prejudice, Journal of Personality and Social Psychology, 75: 811…832Ray, S., E. Sharp and D. Abrams (2006) Age Discrimination 2006A benchmark for public attitudes, London: Age Concern England, Policy UnitRiek, B. M., W. W. Ania and S. L. Gaertner (2006) Intergroup Threat and Outgroup Attitudes: A meta-analytic review, Personality and Social Psychology Review, 10: 336…353Rothon, C. and A. Heath (2003) Trends in Racial Prejudice, in A. Park et al. (eds), British Social AttitudesContinuity and change over two decades, London: SageSchneider, D. J. (2004) The Psychology of Stereotyping, New York: Guilford PressStephan, W. and C. W. Stephan (2000) An Integrated Threat Theory of Prejudice, in S. Oskamp (ed.), Reducing Prejudice and Discrimination. Hillsdale, NJ: Lawrence ErlbaumTajfel, H. (1981) Human Groups and Social Categories, Cambridge: Cambridge University PressVauclair, C.-M., D. Abrams and C. Bratt (2010) Measuring Attitudes to Age in Britain: Reliability and validity of the indicators?, Report for the Department of Work and Pensions (Working Paper No. 90) References Age UK is a charitable company limited by guarantee and registered in England (registered charity number 1128267 and registered company number 6825798). The registered address is 207…221 Pentonville Road, London N1 9UZ. Age Concern England (registered charity number 261794) and Help the Aged (registered charity number 272786), and their trading and other associated companies merged 1 April 2009. Together they have formed the Age UK Group, dedicated to improving the lives of people in later life. The three national Age Concerns in Scotland, Northern Ireland and Wales have also merged with Help the Aged in these nations to form three registered charities: Age Scotland, Age NI and Age Cymru. ID10704 05/11 Tavis House1…6 Tavistock SquareLondon WC1H 9NA 0800 169 80 80www.ageuk.org.uk