/
Cartography 101 The Basics of Maps, Map Making and Location Cartography 101 The Basics of Maps, Map Making and Location

Cartography 101 The Basics of Maps, Map Making and Location - PowerPoint Presentation

tawny-fly
tawny-fly . @tawny-fly
Follow
346 views
Uploaded On 2018-12-21

Cartography 101 The Basics of Maps, Map Making and Location - PPT Presentation

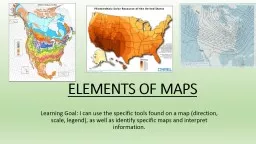
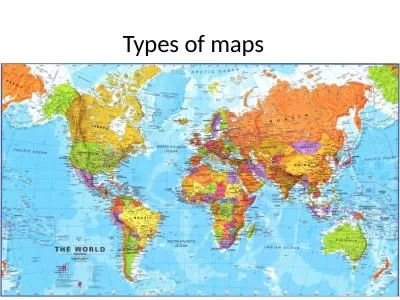
Map Basics All quality maps have the following Basic Traits Title gives the map purpose and thematic focus Compass gives cardinal directions amp orientation KeyLegend decodes ID: 744771

lines amp maps map amp lines map maps accurate location relative major latitude scale south elevation north color longitude

Share:

Link:

Embed:

Download Presentation from below link

Download Presentation The PPT/PDF document "Cartography 101 The Basics of Maps, Map ..." is the property of its rightful owner. Permission is granted to download and print the materials on this web site for personal, non-commercial use only, and to display it on your personal computer provided you do not modify the materials and that you retain all copyright notices contained in the materials. By downloading content from our website, you accept the terms of this agreement.


Presentation Transcript

Slide1

Cartography 101

The Basics of Maps, Map Making and LocationSlide2

Map Basics

All quality maps have the

following Basic Traits:Title: gives the map purpose and thematic focusCompass: gives cardinal directions & orientationKey/Legend:

decodes symbols or defines colors used Scale: converts size on map to distances in real life

3 Types of ScalesGraphic Scale (drawn)Written Scale ex: 1 inch = 5 milesRepresentative Scale (RF) ex: 1:9,778,000To convert into “Inches in a Mile”

1

st

divide # by 5280 (feet/mile)2nd divide the answer by 12 (inches/foot) = How many miles in an inch.Slide3

Reading Maps – which map has is large scale and which is small?Slide4

In the picture above, color is being used to show what?

Find a map in your atlas that uses color differently…How it is used?

Color & Shading

Gives meaning to colors used:population enviro-regions

bordersprecipitation**gradients**Slide5

Map Projections

Go to reference pg. ix

3 most common map projectionsCylindrical ProjectionMost accurate across the center (Tropical Regions)Least accurate at the top & bottomConic Projection Most accurate at the cone’s rim (N. America wide W>E)Least accurate in the center/bottom of cone

Azimuthal – Planar ProjectionsMost accurate at the center (Polar Regions)Least accurate at the edgesSlide6

Relative Location

Relative:

Where a place is located in relation to another known placeWhich could be a….Nation, landmark or physical feature (water or land)

Make sure that….Your chosen features are close to the actual locationSlide7

Examples:

Monarch High School is located to the North of 36, South of Dillon Rd and Southeast of Harper Lake

Japan is located to the East of China but South of Sea OkhotskProvide a relative description of your house using three relative landmark mix’em up! (physical feature, well known building, street)Slide8

Provide a relative location for….Slide9

Absolute Location

Absolute: The exact latitude and longitude coordinates of a place

Divided into degrees first and minutes second Example: Louisville, CO – 39° 58’N, 105° 08’W Slide10

Latitude

Latitude...

is measured North and South of the Equatorlines run East - West on the globe/map

lines are parallel to one another (never intersect)Lines are NOT equal in length

Biggest @ Equator & Smallest @ N/S PolesThere are 90 latitude lines in each hemisphere180 Total lines Important Lines of

Latitude

0° = Equator

90°N = North Pole90°S = South Pole23.5°N = Tropic of Cancer23.5°S = Tropic of Capricorn66.5°N = Arctic Circle66.5°S = Antarctic CircleSlide11

Longitude

Longitude...

is measured East and West of the Prime Meridianlines run North - South on the globe/map

lines are equidistant to one another (intersect @ the Poles)Lines are equal in length (all = to Equator length)There are 180 longitude lines in each hemisphere

360 Total lines Important Lines of Longitude0° = Prime Meridian – Greenwich Meridian

180° = International Date Line

- Is not an exact Meridian because

it jogs around countries -When you cross it you change the date Youtube review!

http://

www.youtube.com/watch?v=swKBi6hHHMA&safety_mode=true&persist_safety_mode=1&safe=activeSlide12

Practice

What is at....?

23° N, 72° E =58° N, 30° E =4° S, 105° E =30° N, 81° W =25° S, 57° W =

69° N, 30° W =

Ahmadabad, India

St. Petersburg, Russia

Palembang, Indonesia

Jacksonville, Florida

Asuncion, Paraguay

Mt. Gunnbjorn, Greenland

Google

Earth – Miracle?

47.110579,

9.227568Slide13

Topography

Topography –

topo – “place" + graphia - "writing" a place’s signature or markThe variation of the earth’s surface showing natural features such as rivers, canyons, lakes, and most importantly, variations in ground elevations. Relief and terrain

Shows the contour of the land from plains and rolling hills to steep canyons and mountainsLines are plotted in intervals of elevation change ex: 250ft, 500ft or 1,000ftLines that are close together represent rapid or steep vertical change

ex: steep canyons walls or cliffsWide spaces between lines represent gradual or slow vertical change ex: rolling hills, plains, valley floors, beaches

Students

should be able to look at two locations and draw a vertical

profile of the journey traveledTopo your knuckles or simulate a false mountainhttp://

www.youtube.com/watch?v=DQPEIjhBdII&safety_mode=true&persist_safety_mode=1&safe=activeSlide14

Topographic Maps USE:

Color to show elevation

Shaded relief

Contour lines to location of similar elevationSlide15

Physical Maps Include

* Major Landforms

-

Mnt

. ranges, peninsulas, etc.

-Escarpments, depressions

* Major Biomes/ Environ Regions

-Jungles, deserts, plains

-

Altiplano

, steppe, llanos

* Major Water Features

-Bays, oceans, seas, straits

-Rivers, lakes, reservoirs

-Waterfalls, rapids

* Elevation & Topography

-Shows relief of land

-Provides elevation examples

Political Maps Include

* Political Boundaries

-International Borders

-State, province,

territory

-Disputed borders

* Major Cities & Towns

-Medium and Large

-Relative to population size

-

◦ ·

-Capital city

* Infrastructure & Development

-Roads, Interstate

highway

- Major railways, pipelines

- Urban Centers

-City & suburbs

-Large developed areas

Physical vs. Political Maps