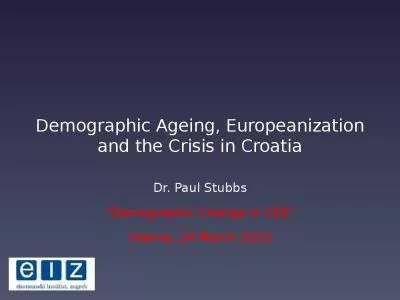
Dr Paul Stubbs Demographic Change in CEE Vienna 24 March 2015 Contexts Demographic ageingdeclining population since 1991 war low birth rates migration Low and falling employment rates high youth and longterm unemployment ID: 275957
Download Presentation The PPT/PDF document "Demographic Ageing, Europeanization and ..." is the property of its rightful owner. Permission is granted to download and print the materials on this web site for personal, non-commercial use only, and to display it on your personal computer provided you do not modify the materials and that you retain all copyright notices contained in the materials. By downloading content from our website, you accept the terms of this agreement.
Slide1
Demographic Ageing, Europeanization and the Crisis in Croatia
Dr. Paul Stubbs“Demographic Change in CEE”Vienna, 24 March 2015Slide2
Contexts
Demographic ageing:declining population since 1991 (war, low birth rates, migration, ...)Low and falling employment rates – high youth and long-term unemployment
In recession since 2009 (decline in real GDP of 12.5%)
EU Member State 1 July 2013 – Excessive Deficit Procedure since January 2014
EU-SILC 2013 AROPE
Overall: 29.9% - women 30.2%; men 29.6%
65+: 31.9% - women 35.3%; men 26.8%
75+: 36.5% - women 40.4%; men 29.4%
Pensions – high dependency ratios and low support ratiosSlide3
Croatia 1st Pillar Pensions
Year (end of the period)
Contributors
Pensioners
Dependency ratio
Support ratio
1950
593,102
67,771
11,43%
8.75
1960
912,290
176,978
19,40%
5.15
1970
1,166,088
340,134
29.17%
3.43
1980
1,518,049
438,133
28.86%
3.46
1990
1,682,971
594,339
35.31%
2.83
2000
1,380,510
1,018,504
73.78%
1.36
2010
1,475,363
1,200,386
81.36%
1.23
2011
1,468,133
1,213,121
82.63%
1.21
2012
1,432,740
1,217,692
84.99%
1.18
2013
1,400,631
1,190,815
85.02%
1.18
2014 (
Oct
.
)
1,421,054
1,221,667
85.98%
1.16
2014 (
Dec
.
)
1,397,400
1,223,738
87.76%
1.14Slide4
Population projections
2010
2035
2060
TOTAL
m.
4.425
4.206
3.862
0-19
0.933 (21.1%)
0.801 (19.0%)
0.701 (18.2%)
20-64
2.727 (61.6%)
2.368 (56.3%)
2.022 (52.4%)
65+
0.765 (17.3%)
1.038 (24.7%)
1.131 (29.3%)
75+
0.332 (7.5%)
0.516 (12.3%)
0.641 (16.6%)Slide5
Demographic ageing Slide6
Croatian Social Policy
Hybrid/patchwork/mixed legacies (self-management and Bismarckism)Captured and clientelistic (war veterans, ethnic Croats from BiH, pensioners...)
Late Europeanization and Variegated EU-ization (humanitarianism; Pre-accession JIM; EDP)
Welfare Parallelism (Local-National; State-NGO)
Embedded neo-liberalism and new conservatism?Slide7
Pension Reform 1995 - 2002
Crisis conditions (war, early retirement, Constitutional Court decision)Preferred reform model (World Bank /Chilean model)Technical fix (scenario modelling) in particular domestic and international political conditions
Absence of ANY EU position or ILO opposition
Implemented Argentinian model – mixed three pillar system (PAYG; mandatory savings; voluntary savings)
Considerable PR campaignSlide8
Sustainability
1st Pillar deficit 2014: 14 b. HRK (EURO 1.84 b)14 ‘Privileged pension’ schemes – 15% of total, including 72,000 (6%) Veterans of the Homeland War (maximum pension set at double)
Equalised retirement age for men and women at 65 by 2030.
Between 2031 and 2038 retirement age for men and women gradually raised to 67.
Mixed messages on penalities for early retirement – lower in pre-election years – early retirement used to lower unemployment figures (rising early exits 2012-2014)
New in 2014: full pensions for anyone with 41 years’ contributions.
Projections 1st pillar pensions reduced from 10.9% of GDP in 2013 to 7.0% of GDP in 2060 (gap between payments and contributions reduced to 1.4% of GDP) Slide9
Adequacy
Extremely low aggregate replacement ratio (36% vs EU-28 56%) – fall from 47% in 2008Extremely low and falling benefit ratio 31% - 27% (2030) – 22% (2060)Theoretical replacement rates vary considerably but set to fall for all groups
First
pillar pensions are progressively redistributive
30% of pensioners have less than 25 qualifying years (women 34% , men 26%)
Gender pension gap not as large as may be expected
Significant numbers of those retired receive no benefits
Average monthly pension 2014: 2,240 HRK (EURO 294) – War veterans: 5,134 HRK (EURO 675) Slide10
Impact of the Crisis
Incomes (though not material status) of older people more protected than working-age populationLimited and temporary cuts to some ‘privileged’ pensions (GDP growth and debt reduction ‘triggers’)
Indexation formula changes (2010/11 suspended; now favourable to pensioners)
Possibility of opting out from second pillar
Abandonment (postponement?) of JIM commitment to introduce ‘social pension’Slide11
Role of the European Union
Absent in first wave/radical pension reformJIM – social pension and concern with minimum pension levelsEuropean semester: concerns regarding both adequacy and sustainability
Concern regarding policy uncertainty and inefficiencies
Early retirement needs addressing
Gender harmonisation too slow
L
ack of comprehesive active ageing strategy and enabling of longer working lifeSlide12
Conclusions
Complex mis-match between externally-driven reform agendas and internal political contingenciesNo push to ‘renationalise’ second pillarLittle focus on linkage with long-term care needs
Gender dimension of pensioner poverty not addressed
Renewed discussion on guaranteed minimum income / social pensions