/
Superstitious PerceptionsLizann Bonnar (LIZANN@PSY.GLA.AC.UK)Liza Paul Superstitious PerceptionsLizann Bonnar (LIZANN@PSY.GLA.AC.UK)Liza Paul

Superstitious PerceptionsLizann Bonnar (LIZANN@PSY.GLA.AC.UK)Liza Paul - PDF document

tawny-fly
tawny-fly . @tawny-fly
Follow
365 views
Uploaded On 2015-11-07

Superstitious PerceptionsLizann Bonnar (LIZANN@PSY.GLA.AC.UK)Liza Paul - PPT Presentation

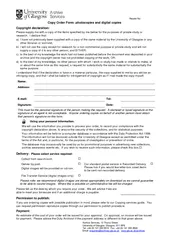
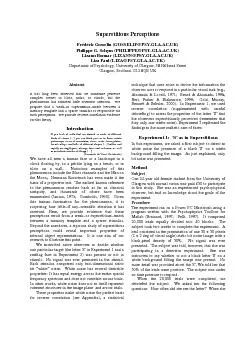
saw it how noisy was it What strategy did she use torespondResults and discussionOn 227 of the trials the subject pressed on the yeskey indicating that an S was present Duringdebriefing ID: 186109

saw how noisy was

Share:

Link:

Embed:

Download Presentation from below link

Download Pdf The PPT/PDF document "Superstitious PerceptionsLizann Bonnar (..." is the property of its rightful owner. Permission is granted to download and print the materials on this web site for personal, non-commercial use only, and to display it on your personal computer provided you do not modify the materials and that you retain all copyright notices contained in the materials. By downloading content from our website, you accept the terms of this agreement.


Presentation Transcript

Superstitious PerceptionsLizann Bonnar (LIZANN@PSY.GLA.AC.UK)Liza Paul (LIZA@PSY.GLA.AC.UK)Department of Psychology, University of Glasgow, 58 Hillhead StreetGlasgow, Scotland, G12 8QB UKAbstractIt has long been observed that we sometime perceivecomplex scenes in blots, rocks, or clouds, but thephenomenon has attracted little scientific attention. Wepropose that a weak–or superstitious–match between amemory template and a sparse stimulus is responsible forsuch perceptions. We provide reverse-correlation evidencefor this theory.If you look at walls that are stained or made of differentkinds of stones […] you can think you see in them certainpicturesque views of mountains, rivers, rocks, trees, plains,broad valleys, and hills of different shapes […] battles andrapidly moving figures, strange faces and costumes, as wellas an infinite number of things […](Leonardo da Vinci, NotebooksWe have all seen a human face or a landscape in acloud floating by, in a pebble lying on a beach, or inblots on a wall. Notorious examples of thisphenomenon include the Mars channels and the Man onthe Moon; Hermann Rorschach has even made it thebasis of a projective test. The earliest known referenceto the phenomenon reaches back as far as classicalantiquity, and thousands of others have beenenumerated (Janson, 1973; Gombrich, 1960). Giventhis human fascination for the phenomenon, it issurprising how little–if any–scientific attention it hasreceived. Here, we provide evidence that theseperceptions result from a weak–or superstitious–matchbetween a memory template and a sparse stimulus.Beyond the anecdotes, a rigorous study of superstitiousperceptions could reveal important properties ofinternal object representations. It is one aim of ourresearch to illustrate this point.We instructed naïve observers to decide whetherone particular target (the letter 'S' in Experiment 1 and asmiling face in Experiment 2) was present or not instimuli. No signal was ever presented in the stimuli.Each stimulus comprised only two-dimensional staticbit “white” noise. White noise has several desirableproperties: It has equal energy across the entire spatialfrequency spectrum and does not correlate across trials.In other words, white noise does not in itself representcoherent structures in the image plane and across trials.These properties make white noise the perfect basisfor reverse correlation (see Appendix), a statisticaltechnique that uses noise to derive the information theobserver uses to respond in a particular visual task (e.g.,Ahumada & Lovell, 1971; Beard & Ahumada, 1998;Neri, Parker & Blakemore, 1999; Gold, Murray,Bennett & Sekuler, 2000). In Experiment 1, we usedreverse correlation (supplemented with carefuldebriefing) to assess the properties of the letter ‘S’ thatthe observers superstitiously perceived (remember thatthey only saw white noise). Experiment 2 replicated thefindings in the more realistic case of faces.Experiment 1: 'S' as in SuperstitiousIn this experiment, we asked a first subject to detect inwhite noise the presence of a black 'S' on a whitebackground filling the image. As just explained, onlybit noise was presented.SubjectOne 24-year old female student from the University ofGlasgow with normal vision was paid £50 to participatein this study. She was an experienced psychophysicalobserver, but had no knowledge about the goals of theexperiment.The experiment ran on a Power PC Macintosh using aprogram written with the Psychophysics Toolbox forMatlab (Brainard, 1997; Pelli, 1997). It comprised20,000 trials equally divided into 40 blocks. Thesubject took two weeks to complete the experiment. Atrial consisted in the presentation of one 50 x 50 pixels(2 x 2 deg of visual angle) static bit noise image with ablack-pixel density of 50%. No signal was everpresented. The subject was told, however, that she wasparticipating in a detection experiment. She wasinstructed to say whether or not a black letter 'S' on awhite background filling the image was present. Nomore detail was provided about the 'S'. We told her that50% of the trials were positive. The subject was underno time pressure to respond.When the 20,000 trials were completed, wedebriefed the subject. We asked her the followingquestions: How often did she see the letter? When she saw it, how noisy was it? What strategy did she use torespond?Results and discussionOn 22.7% of the trials the subject pressed on the 'yes'key, indicating that an 'S' was present. Duringdebriefing, she said that she saw an 'S' each time sheresponded positively, and she estimated the quantity ofnoise in the letter 'S' to vary between 30% and 50%.She summarized her strategy as follows: "I simplywaited to see if the S "jumped out at me"."All the static bit noise images leading to a 'yes'response were added together and so were those leadingto a 'no' response. The two resulting images, the 'yes'and the 'no' images, were normalized. A rawclassification image was then computed by subtractingthe normalized 'no' image from the normalized 'yes'image. This classification image is the linear templatethat best explains the behavior of the subject in the leastsquare sense of the term (see Appendix).There is an objective method to understand theinformation that drove the illusory perceptions of the‘S’ in the experiment. As explained earlier, white noiseis completely unbiased. If the observer respondedrandomly (i.e., without having the illusion of thepresence of an ‘S’), the classification image would itselfbe unbiased. From this reasoning, any bias appearing inthe spectral analysis of the observer’s classificationimage should indicate the structures underlying theillusory perceptions. The spectral analysis reveal a biasfor information concentrated between 1 and 3 cyclesper image, with a peak at 2 cycles per image (see arrowin Figure 1a). This is consistent with Solomon andPelli's (1994) finding that letter identification is mostefficient around 3 cycles per letter.Figure 1. (a) Distribution of energy across the spectrum. (b)Classification image low-passed at 3 cycles per image.We can visualize the information that drove theillusory detection by filtering the raw classificationimage with a low-pass Butterworth filter with a cutoffat 3 cycles per image. To provide a better depiction, wefurther remove all the outlier pixel intensities (twostandard deviations away from the mean). Theresulting image is a black 'S' on a white background.To summarize, we have induced illusoryperceptions of an ‘S’ by asking one subject to detectthis letter in noise. Unknown to her, the stimuli did notcomprise the letter, but only white noise. If the subjecthad been performing only according to the stimulus(i.e., in a bottom-up manner), her classification imageshould have had the same properties as noise—i.e.,having identical energy across all spatial frequencies.However, there was a marked peak of energy between 1and 3 cycles per degree that could only arise from top-down influences on the interpretation of white noise.Further analyses revealed the precise shape of the letterthat the subject thought she saw. Specifically, it isworth pointing out that the best depiction of theinformation usedIn Experiment 2, we generalized the technique to amore complicated stimulus, using another subject. Thetask was to discriminate between a smiling and non-smiling face. However, the face presented in noise hadno mouth whatsoever.SubjectOne 26-year old female student at the University ofGlasgow with normal vision was paid £50 to take partin this study. She was naïve with respect to the goals ofthe experiment, but was an experienced psychophysicsobserver.The experiment ran on a Macintosh G4 using a programwritten with the Psychophysics Toolbox for Matlab(Brainard, 1997; Pelli, 1997). It consisted in 20,000trials equally divided in 40 blocks. The subject tookthree weeks to complete the experiment. In each trial,one sparse image spanning 256 x 256 pixels (5.72 x5.72 deg of visual angle) was presented. This imagecomprised 27.5% of the black pixels of the contours ofa mouthless face (see the white marker in Figure 2b)randomly sampled and, for the remainder, of bit noisewith the same density of black pixels. No signal wastherefore presented in the mouth area.The subject was instructed to decide whether theface was smiling or not–no detail was providedregarding the alternative expressions. This ensured thatthe subject focused on seeking information for "smile".We also told her that the face would be smiling in 50% of the trials. The subject was under no time pressure torespond. Following the 20,000 trials, we debriefed thesubject as in Experiment 1.Results and discussionOn 7.07% of the trials the subject pressed on the 'yes'key, indicating that the "noisy" face was smiling.During debriefing, she explained that she had been veryconservative and that she had only responded 'yes' whenshe was absolutely certain that the face was indeedsmiling. The subject looked for teeth and used the eyesand the nose to localize the mouth.All the static bit noise images leading to a 'yes'response were added to form a 'yes' image, and all thoseleading to a 'no' were added to form a 'no' image. Araw classification image was then computed bysubtracting the normalized 'no' image from thenormalized 'yes' image.The distribution of energy in the spectrum for theraw classification image is represented in Figure 2a.The energy is concentrated in the bandwidth rangingfrom 1 to 20 cycles per image (from 0.35 to 12.29cycles per face–see arrow in Figure 2a). This roughlycorresponds to the most efficient bandwidth found byBayer, Schwartz and Pelli (1998) in an expressionidentification task (i.e., maximum efficiency centered at8 cycles per face).Figure 2. (a) Distribution of energy across the spectrum. (b)Classification image low-passed at 20 cycles per image.Figure 2b is the raw classification image low-passedat 20 cycles per image with a Butterworth filter–withoutlier pixel values removed, followed by anormalization. A white mouthless face marker has beensuperimposed on filtered classification image. A smilerevealing teeth is clearly visible (see circled area inFigure 2b).The evidence we have gathered in two experimentscorroborates the idea that superstitious perceptionsresult from a weak match between a memory templateand a sparse stimulus. We have shown that we couldinduce superstitious perceptions of a letter ('S',Experiment 1) and part of a face (a mouth expressing asmile, Experiment 2) in bit noise. Reverse correlationdemonstrated that observers in these experiments usedinformation from memory ressembling an 'S' and asmile, respectively. It is important to stress that thisinformation did not originate from the signal, by fromtheir memory. It is only because these memoryrepresentations are partially correlated with white noisethat the superstitious perceptions occur. But then,because white noise is weakly correlated with everyvisual stimulus, this technique could in principle extendto depicting a wide range of visual representations. Inour experiments, these representations had propertiesexpected from what is know in the recognitionliterature. So, the superstitious perceptions were notrandom hallucinations, but instead well-constrainedperceptions derived from specific knowledge.Superstitious perceptions could therefore be used toexplore the properties of representations in the absenceof any bottom-up information.AcknowledgementsThis research was partially funded by ESRC grant R000237 901.Ahumada, A. J. & Lovell, J. (1971). Stimulus featuresin signal detection. Journal of the Acoustical Societyof America, 1751-1756.Bayer, H. M., Schwartz, O. & Pelli, D. (1998).Recognizing facial expressions efficiently. IOVSBeard, B. L. & Ahumada, A. J. (1998). "A technique toextract the relevant features for visual tasks" In B. E.Rogowitz and T. N. Pappas (Eds.), Human Visionand Electronic Imaging III, SPIE Proceedings, 329979-85.Brainard, D. H. (1997). The Psychophysics Toolbox.Spatial Vision, 10, 433-436.Gold, J., Murray, R. F., Bennett, P. J. & Sekuler, A. B.(2000). Deriving behavioral receptive fields forvisually completed contours. Current Biology(11), 663-666.Gombrich, E. H. (1960). Art and Illusion: A Study inthe Psychology of Pictorial Representation. London:Phaidon Press Ltd. Janson, H. W. (1973). "Chance images" In Philip P.Wiener (Ed.), Dictionary of the History of Ideas.New York: Charles Scribner's Sons.Neri, P., Parker, A. J. & Blakemore, C. (1999). Probingthe human stereoscopic system with reverseNature (6754), 695-698.Pelli, D. G. (1997). The VideoToolbox software forvisual psychophysics: Transforming numbers intomovies. Spatial Vision, 437-442.Solomon, J. A. & Pelli, D. G. (1994). The visual filtermediating lettre identification. Nature369, 395-397.Sprent, P. (1969). Models in Regression and Related London: Methuen & Co Ltd.We suppose that the observer matches two vectors ateach trial of the experiment: a stimulus vector ofdimensionality and a template vector of the samedimensionality representing the memorized pattern tomatch against the input (e.g., the letter ‘S’ or a smilingSuppose further that we arrange the stimuli of theexperiment in the * matrix . The behavior of theobserver for the whole experiment is described bywhere is an dimensional vector of decisionresponses, and is an -dimensional vector of "error"random variables with E( and V() = For simplicity, the “target present” and “targetabsent” responses in as well as the white and blackpixels in are encoded with values of 1 and –1,respectively.Given that we know and can observe , we canresolve the linear system of equations by finding least square solution requires that we minimize thescalar sum of squares)'(for variations in . Differentiating, we havewhich gives, for our least square estimator, the vectorThis is the logic of standard multiple regression (e.g.,Sprent, 1969). Because our stimulus vectors areuncorrelated, we have = (Therefore,Leaving the constant aside, this equation reduces tosumming all stimuli that led to a 'yes' response andsubtracting from it the sum of all the stimuli that led toa 'no' responses. This is the essence of reverse