/
Why guess when you can know  with Why guess when you can know  with

Why guess when you can know with - PDF document

taylor
taylor . @taylor
Follow
342 views
Uploaded On 2021-07-07

Why guess when you can know with - PPT Presentation

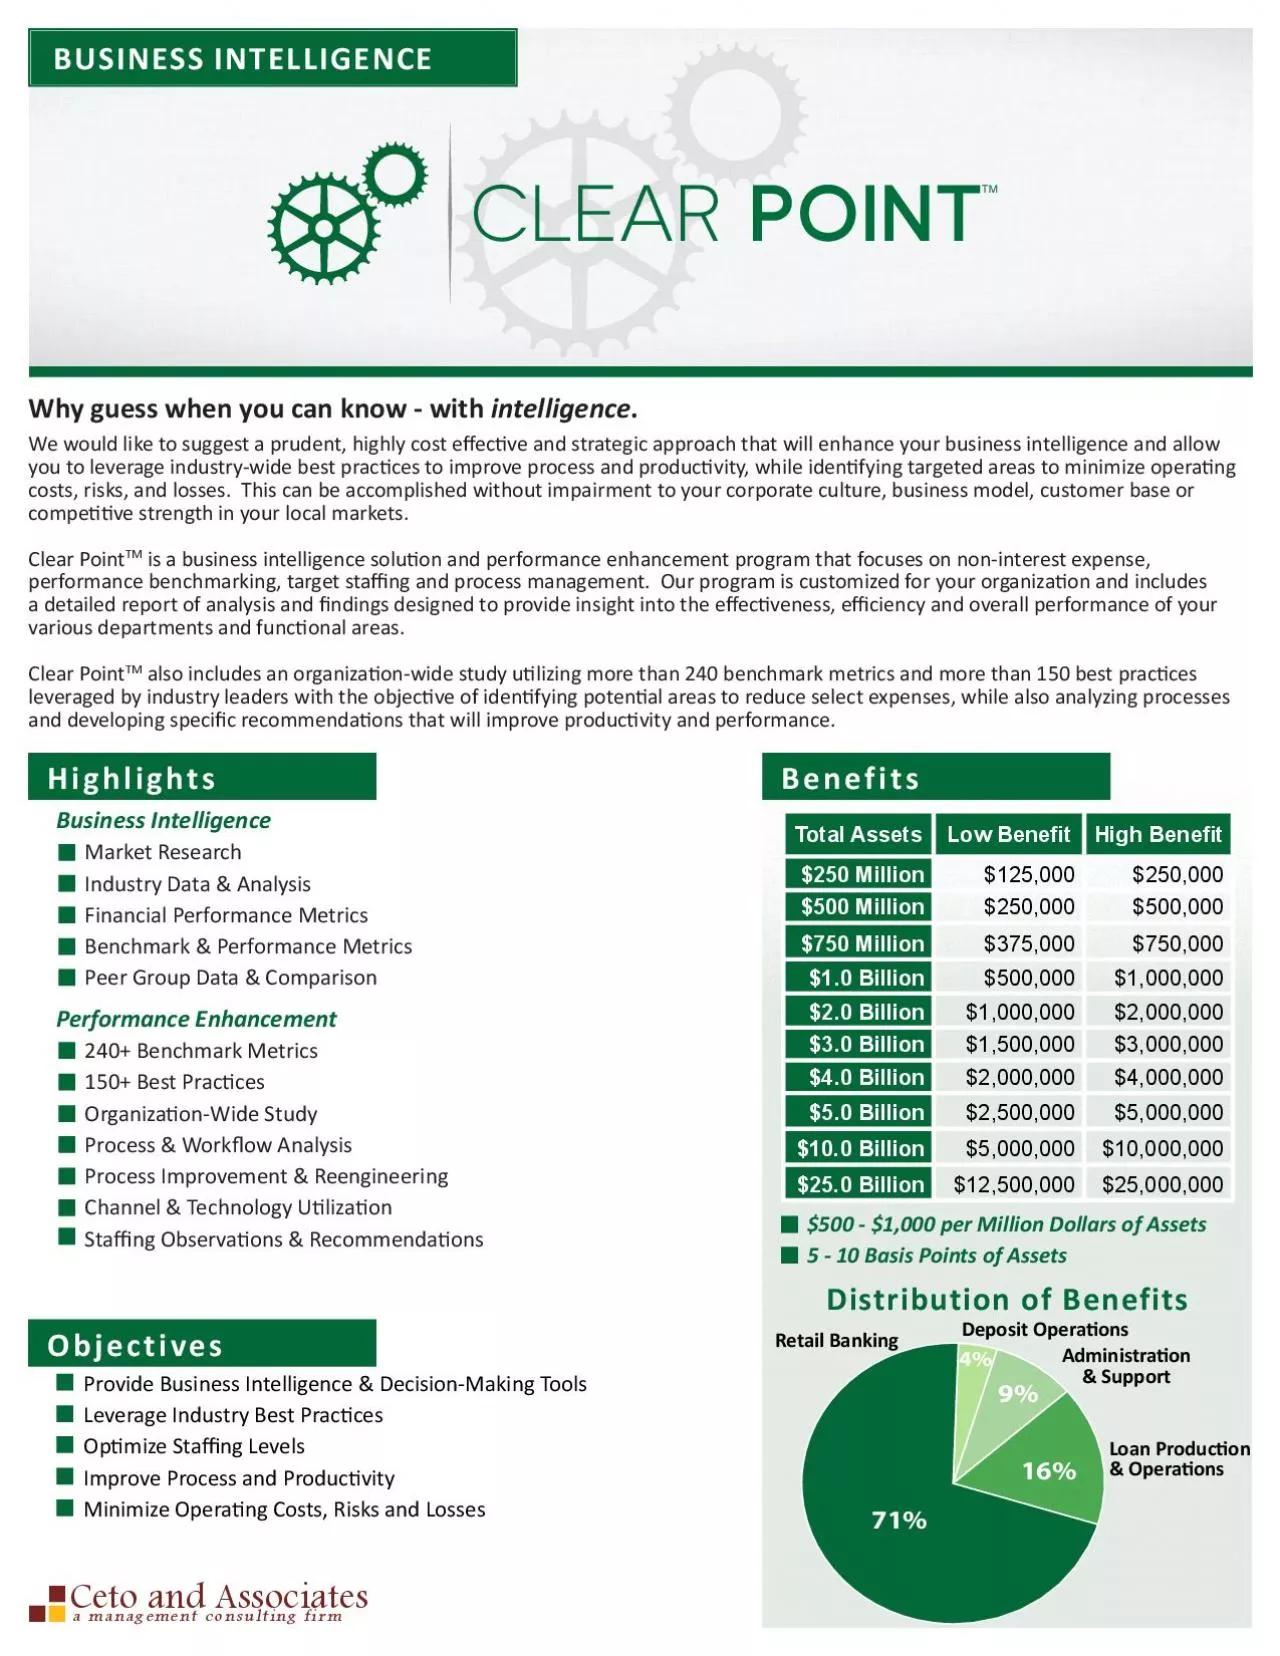
971416 intelligence We would like to suggest a prudent you to leverage industrywide best pracx00740069ces to improve process and producx00740069vity while idenx00740069fying target ID: 855843

x00740069 000 500 billion 000 x00740069 billion 500 performance intelligence business prac industry opera metrics process million ons ces

Share:

Link:

Embed:

Download Presentation from below link

Download Pdf The PPT/PDF document "Why guess when you can know with" is the property of its rightful owner. Permission is granted to download and print the materials on this web site for personal, non-commercial use only, and to display it on your personal computer provided you do not modify the materials and that you retain all copyright notices contained in the materials. By downloading content from our website, you accept the terms of this agreement.


Presentation Transcript

1 9%71%4%16% Why guess when you can know -
9%71%4%16% Why guess when you can know - with intelligence . We would like to suggest a prudent, you to leverage industry-wide best prac�ces to improve process and produc�vity, while iden�fying targeted areas to minimize opera�ng costs, risks, and losses. This can be accomplished without impairment to your corporate culture, business model, customer base or compe��ve strength in your local markets. Clear Point TM is a business intelligence solu�on and performance enhancement program that focuses on non-interest expense, a detailed report of analysis and �ndings designed to provide insight into the e�ec�veness, e�ciency and overall performance of your various departments and func�onal areas. Clear Point TM also includes an organiza�on-wide study u�lizing more than 240 benchmark metrics and more than 150 best prac�ces leveraged by industry leaders with the objec�ve of iden�fying poten�al areas to reduce select expenses, while also analyzing processes Total Assets $250 Million $125,000 $250,000 $500 Million $250,000 $500,000 $

2 750 Million $375,000 $750,000 $1.0 Billi
750 Million $375,000 $750,000 $1.0 Billion $500,000 $2.0 Billion $1,000,000 $2,000,000 $3.0 Billion $1,500,000 $3,000,000 $4.0 Billion $2,000,000 $4,000,000 $5.0 Billion $2,500,000 $5,000,000 $10.0 Billion $5,000,000 $10,000,000 $25.0 Billion $12,500,000 $25,000,000 Business Intelligence Market Research Industry Data & Analysis Financial Performance Metrics Benchmark & Performance Metrics Performance Enhancement 240+ Benchmark Metrics 150+ Best Prac�ces Organiza�on-Wide Study Process & Work�ow Analysis Process Improvement & Reengineering Channel & Technology U�liza�on Sta�ng Observa�ons & Recommenda�ons Highlights Benefits Distribution of Benefits Provide Business Intelligence & Decision-Making Tools Leverage Industry Best Prac�ces Op�mize Sta�ng Levels a management consulting firm BUSINESS INTELLIGENCE TM Improve Process and Produc�vity Minimize Opera�ng Costs, Risks and Losses Objectives $500 - $1,000 per Million Dollars of Assets 5 - 10 Basis Points of Assets Administra�on & Support Retail Banking Deposit Opera�ons Loan Produc�on & Opera�on