/
ARM Real-Time Trace aids debugging.    By Robert Boys robert.boys@arm. ARM Real-Time Trace aids debugging.    By Robert Boys robert.boys@arm.
ARM Real-Time Trace aids debugging. By Robert Boys robert.boys@arm. - PDF document

test
test . @test
Follow
465 views
Uploaded On 2016-08-14

ARM Real-Time Trace aids debugging. By Robert Boys robert.boys@arm. - PPT Presentation

Keil USBJTAG adapter on STM32 board In order to bring internal debugging data to the outside ARM RealTime Trace aids debugging RealTime Trace ETMIn the late 1990s ARM developed ETM Embedde ID: 446849

Keil USB-JTAG adapter

Share:

Link:

Embed:

Download Presentation from below link

Download Pdf The PPT/PDF document "ARM Real-Time Trace aids debugging. B..." is the property of its rightful owner. Permission is granted to download and print the materials on this web site for personal, non-commercial use only, and to display it on your personal computer provided you do not modify the materials and that you retain all copyright notices contained in the materials. By downloading content from our website, you accept the terms of this agreement.


Presentation Transcript

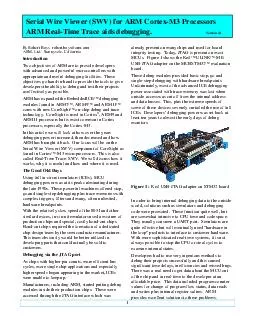
ARM Real-Time Trace aids debugging. By Robert Boys robert.boys@arm.com ARM, Ltd. Sunnyvale, California Keil USB-JTAG adapter on STM32 board In order to bring internal debugging data to the outside ARM Real-Time Trace aids debugging. Real-Time Trace ETMIn the late 1990s ARM developed ETM (Embedded Trace Macrocell) to provide crucial trace information. This data is output on a 4, 8 or 16 bit dedicated trace bus and is captured by a special trace debugger tool. This external tool needs very fast hardware to capture all the data at the speeds ARM™ cores are capable of running. While ETM is effective, there is a need for a lower cost method of gathering trace information without the need for this expensive hardware. Not all ARM devices have the optional ETM implemented. Recent Cortex-M3 processors from NXP, Toshiba and STMicroelectronics provide a 4 bit ETM port as well as the Serial Wire Viewer. In general, for these Cortex-M3 devices, ETM is used to support PC information while SWV is uwrite data as well as exception events. CoreSight Real-Time Trace SWV ARM, for its Cortex family, uses the new CoreSight set of debugging modules. CoreSight includes all debugging modules such as JTAG debugging, ETM and most significantly adds Serial Wire Debug (SW-MCUs will have ETM, but nearly all will have both JTAG and SW-DB debugging technologies. Cortex –M3 processors with SWV are currently available from Luminary, STMicroelectronics, NXP and Toshiba. More devices are planned from various manufacturers. debugging capabilities as JTAG but with fewer pins. SW-DB uses only two wires while JTAG uses 4 to 7 to connect to the CoreSight debugging modules. A smaller connector can therefore be used with SW-DB. SW-DB and JTAG offers stop, go and single-step debugging, up to 8 hardware breakpoints and up to 4 watchpoints. The Keil ULworks with both these debugging methods. Serial Wire Viewer (SWV) is similar to a one bit ETM port. It needs only one pin and this pin on the MCU is called Serial Wire Output (SWO). These three pins (SW-DB and SWO) share the same connector as the Figure 2 illustrates the various components of a typical Cortex Debugging Diagram What Serial Wire Viewer can do for you The Serial Wire Viewer provides these types of information: 1) Program counter values. (sampled) 2) Data read and write cycles. 3) Variable and peripheral values. 4) Event counters. 5) Exception entry and return. 5) Timestamps and CPU cycles used. No debugging code in the user program or cycle stealing are needed. User code can also send data out the SWO with the ITM using a one cycle write ETM has a higher throughput of data. SWV can provide considerable trace information with no investment in expensive hardware tools. The RealView MDK-ARMDevelopment Kit) provides SWV support for no additional charge. MDK uses µVision3 from Keil as its IDE (Integrated Development Environment. See www.keil.com for more information. Keil provides ETM support using a tight integration with the Signum Systems JTAGJetTrace adapter and the Segger J- 2 ARM Real-Time Trace aids debugging. µVision can display variables in several familiar formats including graphs in real time without any intrusiveness. Variables are transmitted out the SWO line by the SWV macrocell which requires no CPU cycles or resources other than the three serial pins structures are easily displayed. Local variables must first be converted to global or static before they can be viewed. Figure 3 shows the output from the A/D converter global variable AD_DbgVal and the Systick Keil µVision Logic AnalyzerPeripheral Registers registers in real-time. Whenever a read or write is performed on a peripheral address by a global or static variable, a trace event is created and can be displayed in a graph as in Figure 3 or in the Watch and Memory Program Counter (PC) Sample It is possible to display program counter values. This is useful for program flow change, profile analysis and determining where the CPU might be caught in an infinite loop and which instruction sent it there. Profile Analysis gives an indication where the CPU is spending its time. Clearly, the single serial wire port is not capable of providing every program counter value because of the high speed ARM cores can run at. A statistical sampling indication of performance analysis is possible and is sufficiently adequate for profile analysis. Figure 4 shows the value of the PC as well as timestamps in CPU in both cycles and seconds. PC Samples & ITM Trace Records Read and write data frames can be displayed giving value transferred, the data address and timestamps in both core cycles and seconds. Figure 5 shows a series of data writes showing these attributes. Data reads are similarly displayed. Note the small filter window showing the types of events that can be displayed. Data Writes & Exception examplesITM: Instrumentation Trace Macrocell The ITM is useful for user programs to write data out the SWO port. This data can be displayed on either the Trace Records or Serial Wire Viewer windows. Sample user code to write to the ITM is shown below. to as “printf debugging”. This method is marginally intrusive to the user program. Sample code to use ITM follows: Essentially you merely write to the specific ITM address and CoreSight automatically sends your data out the SWO port and uVision displays it in the ITM window shown in Figure 6 and normally uses 1 CPU write cycle. 3 ARM Real-Time Trace aids debugging. Write to the ITM port: Three ITM records are displayed in Figure 4. Figure 6 shows the results of the user code displayed in the Serial Wire Viewer WindowTrace Event Counters These are the types of events traced: 1) # of CPU clock cycles (32 bit). 2) # of folded instructions count (8 bits). 3) # of instruction cycles (8 bit). 4) # of cycles processor is sleeping (8 bit). 5) Total cycles spent in interrupts (8 bit). 6) Total cycles spent in load/store operations. Each time one of these counters rolls over, an event is generated and fed to the Event Counters window. These counters can be used to measure total elapsed time, provide information on system performance and many other uses. Figure 7 shows the number of times these counters have rolled over. They can be cleared by clicking on Event CountersSWV will capture various exceptions’ return and exit. These are timestamped and the exception number is displayed. Figure 8 shows the Exception Trace window where the exception SysTick (15) has occurred 921 times. Information about exceptions will be displayed in this window and also repeated in the exceptions 0 and 15 are displayed. Exception Trace WindowUsefulness of the Trace Trace, either ETM or SWV, adds significant power to debugging efforts. Problems that may take hours, days or even weeks in big projects can often be found in a fraction of these times with a trace. Especially useful is where the bug occurs a long time before the consequences are seen or where the state of the system disappears with a change in scope. Usually, using trace helps find bugs without stopping the program. In the more complicated environments of today, it is becoming more difficult to find bugs easily and in a timely fashion. Tracing can help find nastier bugs easier than traditional stop and go debugging. 4 ARM Real-Time Trace aids debugging. These are the types of problems that can be found with a quality trace: All you need is an evaluation board with a STM32, NXP, Toshiba or Luminary processor, a Keil ULINK2 (or ME) and a copy of RealView MDK. MDK has several examples included and all will compile with the evaluation version of the tools. See www.keil.com to obtain the software. 1) Pointer problems. 2) Illegal instructions and data aborts (such as misaligned writes). 3) Code overwrites – writes to Flash, unexpected writes to peripheral registers (SFRs), corrupted stack. If you have another Cortex-M3 processor not listed here that has Serial Wire Viewer technology implemented, you can easily view it working with Keil MDK. Please contact Keil technical support if you experience any issues. 4) Out of bounds data. Uninitialized variables and arrays. 5) Stack overflows. What causes the stack to grow bigger than it should ? Lab exercises for the ST and Luminary processors are also available on the Keil website. 6) Runaway programs: your program has gone off into the weeds and you need to know what instruction caused this. The Serial Wire Viewer provides a low cost method of obtaining information from inside the MCU at low cost due to ARM CoreSight technology and Keil’s µVision3. 7) Communication protocol and timing issues. System timing problems. 8) Where is the program spending all its time ? A Profile Analyzer will tell you. For heavy duty trace debugging such as looking for nasty bugs, the ETM will still be used but to find occasional problems using trace debugging, the Serial Wire Viewer is hard to beat for both performance, ease of use and cost. As well as being readily available. In addition, interesting items such as variable contents, status of the RTOS such as task number, semaphores and other information can be viewed in real time to send information to the developer. Information about the state of the KEIL RTX RTOS running on Cortex-M3 processors is shown in real-time using Serial Wire Viewer. It is not necessary to stop the processor to view this type of data. The displayed information changes “on-the-fly”. See Figure 9 below. RTX Viewer in Real-Time 5