/
ENERGY  VALUE  OF  FOODS ENERGY  VALUE  OF  FOODS

ENERGY VALUE OF FOODS - PowerPoint Presentation

test
test . @test
Follow
373 views
Uploaded On 2016-05-30

ENERGY VALUE OF FOODS - PPT Presentation

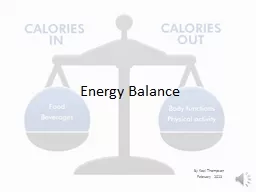
Submitted by SELMA ABDUL SAMAD BCH100502 S3 MScBIOCHEMISTRY The Energy Yielding Food Factors Human body utilises potential energy in foods for maintaining life and doing work The energy yielding food factors are ID: 341395

bmr energy food body energy bmr body food weight activity rate age fat height calorie formula person expenditure foods

Share:

Link:

Embed:

Download Presentation from below link

Download Presentation The PPT/PDF document "ENERGY VALUE OF FOODS" is the property of its rightful owner. Permission is granted to download and print the materials on this web site for personal, non-commercial use only, and to display it on your personal computer provided you do not modify the materials and that you retain all copyright notices contained in the materials. By downloading content from our website, you accept the terms of this agreement.


Presentation Transcript

Slide1

ENERGY VALUE OF FOODS

Submitted by,

SELMA ABDUL SAMAD

BCH-10-05-02

S3

MSc.BIOCHEMISTRYSlide2

The Energy Yielding Food Factors

Human body

utilises

potential energy in foods for maintaining life and doing work.

The energy yielding food factors are

Carbohydrates

Proteins

Fats

In

cells,enzymes

degrade these by oxidation

yielding

energy

Carbs

and fats give CO

2

, water and heat while Proteins give urea along with theseSlide3

The energy value of Food

The energy or calorific value of food depends on the amount of energy yielding factors in them

This can be determined by oxidation in a bomb calorimeter

Units of energy include

CALORIE

-

one calorie expresses the quantity of heat needed to raise the temperature of 1 kg (1 L) of water 1°C (specifically, from 14.5 to 15.5°C). Kilogram calorie or kilocalorie (kcal) more accurately defines calorie

.Slide4

British thermal unit, or BTU - represents the quantity of heat necessary to raise the temperature of 1 lb (weight) of water 1°F from 63 to 64°F

The joule, or

kilojoule

(kJ), reflects the standard international (SI) unit for expressing food energy. To convert kilocalories to kilojoules, multiply the kilocalorie value by 4.184

The following conversions apply:

1 cal =4.184 J

1 kcal = 1,000 cal = 4,184 J = 4.184 kJ

1 BTU =778 ft-lb =252 cal =1,055 J

Mega joule = 1000 kJ = 239 kcalSlide5

Humans need food energy to cover the basal metabolic rate; the metabolic response to food; the energy cost of physical activities; and accretion of new tissue during growth and pregnancy, as well as the production of milk during lactation.

 “Energy balance is achieved when input (or dietary energy intake) is equal to output (or energy expenditure), plus the energy cost of growth in childhood and pregnancy, or the energy cost to produce milk during lactation” (FAO, 2004).Slide6

Overview of food energy flow through the body for maintenance of energy balanceSlide7

Metabolisable energy

– Food energy available for heat production and body gains at nitrogen and energy balance

Net

metabolisable

energy -

food energy available for body functions that require ATP.

ie.,it

is based on the ATP producing capacity of foods rather than total heat producing capacity.Slide8

A large number of analytical methods for food analysis have been developed since the late nineteenth century, so have a variety of different energy conversion factors for foods.

The common ones are the

Atwater

System

, Extensive

General Factor System and

Atwater

Specific factor System. All of these are based on ME .

The energy values based on

Atwater

System are

17 kJ/g (4.0 kcal/g) for protein

37 kJ/g (9.0 kcal/g) for fat

17 kJ/g (4.0 kcal/g) for carbohydrates

29 kJ/g (7.0 kcal/g) for alcoholsSlide9

The Atwater specific factor system appears to be superior to the original Atwater general system, which took only protein, fat, total carbohydrate and alcohol into account.

There are other factors which are dependent on the NME and hybrid systems are also

deviced

with implications .Slide10

Determination of Energy Value

Bomb Calorimeter

Measure the total or gross energy value of various food macronutrients

Bomb calorimeters operate on the principle of direct

calorimetry

, measuring the heat liberated as the food burns completely.

Heat of combustion refers to the heat liberated by oxidizing a specific food; it represents the food’s total energy valueSlide11
Slide12

Bomb calorimetry

is used to determine the enthalpy of combustion, 

D

comb

H

, for hydrocarbons

Other

calorimetries

Benedict’s oxy-calorimeter – measures the volume of oxygen required to burn a known weight of the food

Direct

calorimetry

– The relation between energy output and oxygen consumed has been determined using the human respiration calorimeter.

Eg

. Adult weighing 65

kgs

Amount of heat output in 24 hours – 2400 kcal

Amount of oxygen consumed in 24 hours – 500

litres

Heat output per

litre

of oxygen consumed – 4.8 kcalSlide13

Energy available – based on

Digestibility

UtilisabilitySlide14

So the physiological energy value of foods vary from that seen in a bomb calorimeter.

In Bomb

calorimeter,carbs

and fats are completely

oxidised

to CO2 and water and protein with nitrogen too.

But

in human body this may not be effected

The veg.

fibres

are burnt in calorimeter while human body doesn’t actually

utilise

them for energy.

Also , in

utilisation

and

digestion,certain

percentage of each is lost and nitrogen is mainly excreted as urea.. Slide15

Loss in digestion – eg

. In western countries, 2% for

carbs

, 5% for fats and 8% for proteins.

Loss of energy in metabolism due to Incomplete oxidation

– no loss in case of

carbs

and fats. But for

proteins,a

part of the energy is lost as urea due to incomplete oxidation and is estimated as 1.2 cal per gram of protein

oxidised

.

Thus the Atwater-Bryant factors show the physiological energy values of foods.Slide16

Nutrition label

Knowledge of nutritional value of foods is important

Many govt. has made it a rule to include nutrition labels in food packetsSlide17

RESPIRATORY QUOTIENT

Respiratory quotient –

is the ratio between the volume of CO

2

given out and the volume of O

2

consumed by the human subjects.

Respiratory quotient(R.Q) =

Vol

of CO

2

produced

Vol

of O2 consumed

When only carbohydrate is

oxidised

, RQ = 1

For fats, RQ = 0.7

For proteins , RQ = 0.82

In the post absorptive stage of an average meal, with 10% protein, 20% fat and 70%

carbs

, RQ is about 0.82

Respiratory Quotient is measured using

Ganong’s

RespirometerSlide18

BASAL METABOLISM

It is the energy metabolism of a subject at complete physical and mental rest and having normal body temperature and in the post absorptive state.,ie.,12 hours after the intake of last meal

Basal metabolism

can be measured using a Benedict-Roth apparatus.

Basal metabolic rate

is thus

he minimum amount of energy -- in the form of calories-- that your body requires to complete its normal functions, such as breathing, breaking down food, and keeping your heart and brain working. Slide19

RESTING METABOLIC RATE

– It is the calories burned by the subject at rest.

It

is synonymous with Resting Energy Expenditure or REE

BMR varies from person to person and increases with your amount of muscle tissue. Exercising increases your BMR, and it can stay raised after 30 minutes of moderate physical activity.

Though every individual has a slightly different rate, the average is about 70 calories per hour

BMR is measured under very restrictive circumstances when a person is awake, but at complete rest. An accurate BMR measurement requires that the person's sympathetic nervous system is not stimulated. RMR is measured under less strict conditions.Slide20

BIOCHEMISTRY OF BMR

About 70% of a human's total energy expenditure is due to the basal life processes within the organs of the body

20% of one's energy expenditure comes from physical activity and another 10% from 

thermogenesis

, or digestion of food (

postprandial

thermogenesis

)Slide21
Slide22
Slide23
Slide24
Slide25

Measurement of BMR

BMR and RMR are measured by gas analysis through either direct or indirect

calorimetry

, though a rough estimation can be acquired through an equation using age, sex, height, and weight.

Also there are several formulas to calculate the approximate BMR of an individual

Dubois and Dubois found a formula to calculate the Body surface area of a human being A as

A =W

0.425

X H

0.725

X 71.84

where H is height in cm

and W is weight in kgSlide26

A standard table was plotted for BMR against

age,sex

and surface area in square meters.

Harris Benedict Formula

 takes the number produced by the BMR formula and multiplies it depending on your activity level

Basal Metabolic Rate (BMR) Formula

takes several variables like height, weight, age and gender to calculate your calorie needs as if you did not do any exerciseSlide27

English BMR Formula

Women

:

BMR

= 655 + ( 4.35 x weight in pounds ) + ( 4.7 x height in inches ) - ( 4.7 x age)

Men

:

BMR

= 66 + ( 6.23 x weight in pounds ) + ( 12.7 x height in inches ) - ( 6.8 x age)

Metric BMR Formula

Women

:

BMR

= 655 + ( 9.6 x weight in kilos ) + ( 1.8 x height in cm ) - ( 4.7 x age )

Men

:

BMR

= 66 + ( 13.7 x weight in kilos ) + ( 5 x height in cm ) - ( 6.8

x age)Slide28
Slide29

The BMR formula

 uses the variables of height, weight, age and gender to calculate the Basal Metabolic Rate (BMR). This is more accurate than calculating calorie needs based on body weight alone. The only factor it omits is lean body mass and thus the ratio of muscle-to-fat a body has.

 Leaner bodies need more calories than less leaner ones. Therefore, this equation will be very accurate in all but the very muscular (will underestimate calorie needs) and the very fat (will over-estimate calorie needs).Slide30
Slide31
Slide32

Mifflin equation

For men

BMR

= (10 x weight in kg) + (6.25 x height in cm) - (5.0 x age in years) + 5

For women

BMR

= (10 x weight in kg) + (6.25 x height in cm) - (5.0 x age in years – 161

Katch-McArdle

Formula

The

Katch-McArdle

Formula is a basal metabolic rate calculation that you can use when you know your lean body mass measurement. As a result, it's a more accurate metabolism formula than Harris-Benedict Formula.

Because it uses your lean body mass measurement, there is no reason for separate formulas for men and women in the

Katch-McArdle

Formula.Slide33

The formula is

BMR = 370 + (21.6 x lean body mass in kg)

Cunningham Resting Metabolic Rate Calculation

RMR = 500 + (22 x lean body mass in kg)

This calculates the RMRSlide34
Slide35

Factors Affecting Basal Metabolic Rate

Gender

: Men have a greater 

muscle mass

 and a lower 

body 

fat percentage

. Men therefore have a higher BMR.

Genes

: Some individuals are born with a fast metabolism others with a slower metabolism.

Age

: BMR reduces, as one gets older. After 20 years, it drops by 2 per cent per decade.

Exercise

: Exercise helps raise your BMR by building extra lean tissue. Lean tissue is more metabolically demanding than fat tissue.

Weight

: The heavier you are, the higher your BMR.Slide36
Slide37

Body Surface Area

: A tall thin person will have a higher BMR than a shorter, fatter person. BMR also increases in pregnant women.

Body Fat Percentage

: The more lean tissue on the body, the higher the BMR, the more fatty body tissue, the lower the BMR. Men generally have a 10-15% faster BMR than women.

Diet

: Starvation or serious abrupt calorie-reduction can dramatically reduce BMR by up to 30 percent. Restrictive low-calorie weight loss diets can cause your BMR to drop as much as 20%.Slide38

 Food Types

 -

The type of food we eat can also have a significant effect on our basal metabolic

rate.Notably

protein rich

 foods have the greatest effect with carbohydrates and fats eliciting a smaller impact.

High-fat foods and refined sugars, however, can reduce BMR since they are lower in

fiber

and bulk.

Getting the proper amount of vitamins and minerals can help regulate BMR to keep that process efficient.Slide39

 Hormones -

In terms of BMR, the most influential hormone is called Thyroxin, which is produced by the Thyroid Gland. One function of Thyroxin is to regulate BMR. Higher levels of Thyroxin lead to a greater

BMR.

Thyroxin

release can be affected negatively through extreme dieting.

Testosterone/sex hormone

promotes BMR.

Estrogen

also increases

BMR,but

less in compare to testosterone because of less metabolic activity in females.

Cortisol

 is the only hormone showing both catabolic activity as in fever it increases BMR as

temprature

increases, and anabolic activity as in sleep it decreases BMR

upto

10-15%.

G

rowth hormone

also increases BMR.Slide40

 Muscle Mass - Muscle is an active tissue in so much as it needs energy to live. The more muscle a person has, the greater the demand for energy, and the higher the BMR.Slide41

The more muscle fiber

, the higher your BMI as muscle, even at rest, burns significantly more calories than fat and other tissues. This is the reason that strength training is so important to a weight loss program. Aerobics and cardio exercises are good to a point, but if overdone can actually break down muscle tissues for energy which can be counter-productive to weight loss. An efficient exercise program will include both cardio and strength training.Slide42

Heredity -

hereditary

factors,can

influence basal metabolism. We all know of people who seem to eat voraciously but never seem to gain weight, and others eating normal amounts gain weight easily. Some people have what can be called a thrifty metabolism—that is, they conserve more energy than the average person, so it is much easier for them to gain weight. A child with no obese parents has only a 10% risk of becoming obese; a child with one obese parent has a 40% risk, and with two obese parents, 80%.Slide43

Temporary factors affecting BMR include:

Fever: Fevers raises the BMR

Stress: Stress hormones also raise the BMR

In times of stress the hormones 

Adrenaline and

Noradrenaline

 are released, which have the effect of increasing cellular metabolism.

Temperature: Both the heat and cold raise the BMR.

As our body temperature increases, the rate at which our bodies use energy increases. Indeed a 1% increase in body temperature can elicit an increase in BMR in the region of 10% (

Tortora

and Grabowski 1993)

 Sleep : During sleep BMR falls by 10% below that of levels measured when person is awake.Slide44

 Climatic Conditions : People living in cold climate have higher BMR compare to people living hot climate

Caffeine and tobacco use: can increase metabolic activity.

Certain medications, such as anti-depressants can modify the BMR, leading to weight gain

After an injury, BMR can increase (temporarily) while the body uses EFAs and proteins to rebuild damaged structures and create new tissueSlide45

ENERGY METABOLISM DURING WORK

Energy requirement

 is the amount of food energy needed to balance energy expenditure in order to maintain body size, body composition and a level of necessary and desirable physical activity consistent with long-term good health. This includes the energy needed for the optimal growth and development of children, for the deposition of tissues during pregnancy, and for the secretion of milk during lactation consistent with the good health of mother and child.Slide46

Daily RequirementRecommended Daily Intake

Heart rate monitoring (HRM)

:

 A method to measure the daily energy expenditure of free-living individuals, based on the relationship of heart rate and oxygen consumption and on minute-by-minute monitoring of heart rate.

Total energy expenditure (TEE)

:

 The energy spent, on average, in a 24-hour period by an individual or a group of individuals. By definition, it reflects the average amount of energy spent in a typical day, but it is not the exact amount of energy spent each and every day.Slide47

Physical activity level (PAL):

 TEE for 24 hours expressed as a multiple of BMR, and calculated as TEE/BMR for 24 hours. In adult men and non-pregnant, non-lactating women, BMR times PAL is equal to TEE or the daily energy requirement.

Physical activity ratio (PAR)

:

 The energy cost of an activity per unit of time (usually a minute or an hour) expressed as a multiple of BMR. It is calculated as energy spent in an activity/BMR, for the selected time unitSlide48

What actually Happens …….

Why can’t we sprint forever ?? Work & Muscle energy Relation

These data are from the 1964 Olympic competitions.  Running speed is plotted against the duration of the race. Competitors running more than 30-40 seconds reduced their velocity markedly and a continual and gradual decrease occurred after about 2 minutes.  Marathon runners ran approximately half as fast as sprinters.  

The explanation for this phenomena is that differing energy sources are used by working muscles, the choice being related to the rate of usage.  Stored high-energy phosphates energy (ATP-ADP and

phosphocreatine

) give the most rapid regeneration of utilized ATP.

 Slide49
Slide50

 A 100 meter sprint takes less than 10 seconds .  During this very short period the driving force is stored high-energy phosphate.  The runners can perform almost without breathing, using energy stored as ATP or

creatine

phosphate (~P) or glycogen in the active muscles.  In contrast to long-distance runners, sprinters are often large, very muscular people.  They are "specially equipped"  for explosive function for very short periods.

The energy supply for those who run from about 60 seconds to three minutes is also stored energy, but in this case it is primarily glycogen stored in muscles (and blood glucose) that provides energy.  Glycogen must be oxidized to

pyruvate

, lactate and CO

2

 to provide the ATP required for muscle activity. Slide51
Slide52
Slide53

Energy used during physical activity

 - this is the amount of kilojoules burned during movement and physical activity; in a normally active person, this component contributes 20 per cent of daily energy use.

Thermic

effect of food - 

this is the energy you use to eat, digest and metabolise food. It contributes about 5-10 per cent of your energy use.

During heavy physical exertion, the muscles may burn through as much as 3,000kJ per hour. Energy used during exercise is the only form of energy expenditure that you have any control over.

The energy expenditure of the muscles makes up only 20 per cent or so of the total energy expenditure at rest but, during strenuous exercise, the rate of energy expenditure of the muscles may go up 50-fold or more. Slide54

DETERMINATION OF ENERGY METABOLISM DURING WORK

Several Equipment

s

Douglas Bag

Max Planck

Respirometer

Kofranyi

Michaelis

Respirometer

Integrating Motor

PneumotachygraphSlide55

ENERGY REQUIREMENTS

Calorie burning –

Heavy and Light individuals , Type of work or exercise , age and other physiological characteristics , BMR

Type of exercise and calories burned

Energy requirements -

Based on age (

infants,children,adults

)

Based on body weight and height , Based on PAL ,

Based on conditions(pregnancy/lactation) etc.Slide56
Slide57
Slide58
Slide59

RECOMMENDED DIETARY ALLOWANCE (RDA)

Different

for different countries , geographical divisions (like tropical or equatorial or polar ),age and sex, etc

The

needs

of the calories

intaken

Complete diet

– macro and micro nutrients

Indian

– Based on a reference man and woman , the standard values tabulated

RDA of

Indian Ref. Man ( 55 kg and 168 cm height , age 26 with moderate activity level ) is 2780 kcal/day

Indian Ref. Woman (45 kg , 154 cm , 22 years with moderate activity level ) is 2080 kcal/daySlide60

FDA – Recommended Daily AllowanceSlide61

OBESITY

To reduce weight, our 

energy expenditure must exceed our energy intake

.

1 lb = 3500 cal

1 kg = 2.204 lb

Low calorie foods

Negative calorie foods

Risk factors and diseases in relation to obesitySlide62

BODY MASS INDEX

Defined as the individual's body weight divided by the square of his or her heightSlide63
Slide64
Slide65

BODY FAT PERCENTAGE

The total weight of the person's fat divided by the person's weight and consists of essential body fat and storage body fat.

 BMI is not necessarily an accurate indicator of body fat; for example, individuals with greater than average muscle mass will have a higher BMI.

Measured by several techniques

Skin fold

Height and circumference etc.. Slide66
Slide67
Slide68

Maintain a normal body……

Good food habits

Regular exercise

Monitoring weight and BMI Good health

Avoid Junk foodsSlide69

REFERENCE

M.Swaminathan,Essentials

of Food and

nutrition,Volume

1, 1996 , pg. 99 - 122

FAO corporate document repository

FAO.

 2003. 

Food energy - methods of analysis and conversion factors. Report of a technical workshop.

 FAO Food and Nutrition Paper No. 77. Rome.

WHO.

 1995. 

Physical status: The use and interpretation of anthropometry. Report of a WHO expert committee. 

WHO Technical Report Series No. 854. Geneva.Slide70

http://www.savvy-african.com/index.html

http://www.total-fitness-personal-trainer.com

http://www.fitnesstantra.com/

http://www.biotecnika.org/

http://www.fatlossacademy.com/

http://www.calculatorslive.com

http://en.wikipedia.org/wiki/BasalMetabolicRate

http://www.muscleandstrength.com/tools/main.html

http://www.bmi-calculator.net/Slide71

http://healthyeatingclub.com

http://weightloss.about.comSlide72

Thank You