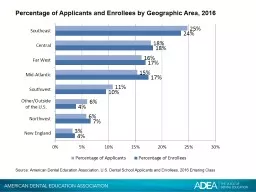
PPT-Percentage of Applicants and Enrollees by Geographic Area,
Author : test | Published Date : 2017-11-15
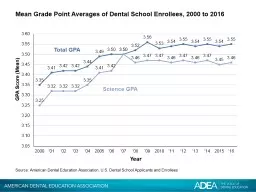
Source American Dental Education Association US Dental School Applicants and Enrollees 2016 Entering Class
Presentation Embed Code
Download Presentation
Download Presentation The PPT/PDF document "Percentage of Applicants and Enrollees b..." is the property of its rightful owner. Permission is granted to download and print the materials on this website for personal, non-commercial use only, and to display it on your personal computer provided you do not modify the materials and that you retain all copyright notices contained in the materials. By downloading content from our website, you accept the terms of this agreement.
Percentage of Applicants and Enrollees by Geographic Area,: Transcript
Download Rules Of Document
"Percentage of Applicants and Enrollees by Geographic Area,"The content belongs to its owner. You may download and print it for personal use, without modification, and keep all copyright notices. By downloading, you agree to these terms.
Related Documents