PPT-Pg 247 #1 & 2 Interpreting Graphs
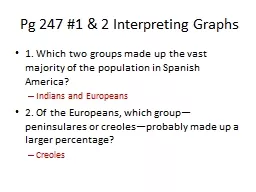
1 Which two groups made up the vast majority of the population in Spanish America Indians and Europeans 2 Of the Europeans which group peninsulares or creolesprobably
Download Presentation
"Pg 247 #1 & 2 Interpreting Graphs" is the property of its rightful owner. Permission is granted to download and print materials on this website for personal, non-commercial use only, provided you retain all copyright notices. By downloading content from our website, you accept the terms of this agreement.
Presentation Transcript
Transcript not available.