/
Almiro Moreira almiro.moreira@ine.pt Almiro Moreira almiro.moreira@ine.pt

Almiro Moreira almiro.moreira@ine.pt - PowerPoint Presentation

thesoysi
thesoysi . @thesoysi
Follow
342 views
Uploaded On 2020-08-07

Almiro Moreira almiro.moreira@ine.pt - PPT Presentation

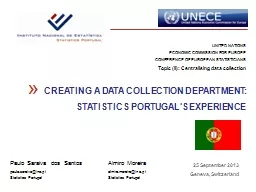
Statistics Portugal 25 September 2013 Geneva Switzerland UNITED NATIONS ECONOMIC COMMISSION FOR EUROPE CONFERENCE OF EUROPEAN STATISTICIANS Topic ii Centralising data collection CREATING A DATA COLLECTION DEPARTMENT ID: 801404

collection data statistical management data collection management statistical statistics system business survey production portugal social amp regional dissemination surveys

Share:

Link:

Embed:

Download Presentation from below link

Download The PPT/PDF document "Almiro Moreira almiro.moreira@ine.pt" is the property of its rightful owner. Permission is granted to download and print the materials on this web site for personal, non-commercial use only, and to display it on your personal computer provided you do not modify the materials and that you retain all copyright notices contained in the materials. By downloading content from our website, you accept the terms of this agreement.


Presentation Transcript

Slide1

Almiro Moreiraalmiro.moreira@ine.ptStatistics Portugal

«

25 September 2013Geneva, Switzerland

UNITED NATIONS

ECONOMIC COMMISSION FOR EUROPECONFERENCE OF EUROPEAN STATISTICIANSTopic (ii): Centralising data collection

CREATING A DATA COLLECTION DEPARTMENT:

STATISTICS PORTUGAL'S EXPERIENCE

Paulo Saraiva dos Santos

paulo.saraiva

@

ine.pt

Statistics Portugal

Slide2

Sharing eight years of experience in centralising data collection, implementing an integrated and process driven approach to change the statistical production, improving its efficiency and flexibility.

Motivation

2

Slide3

Background and context;Reengineering the production;Centralised Data Collection;

Administrative Sources & registers;Data Collection infrastructure

Benefits of a Centralised Approach;The future of Data Collection.

Outline

3

Slide4

Central national authority for the production of official statistics; Aims at developing and supervising the national statistical system;Created in 1935, has its head office in Lisbon with delegations in Porto, Coimbra,

Évora and Faro.

Statistics Portugal (INE)

4

Slide5

Madeira

Azores

Oporto

Lisboa

Coimbra

Évora

Faro

Geographical dispersion

5

Common technical requirements, methods and infrastructure

Slide6

Statistics Portugal is a public institution which has legal personality, administrative autonomy and technical independence in the exercise of its official statistical activity;It is a special public institution integrated within indirect State administration;The Statistical

Law confers on Statistics Portugal statistical authority and legal obligation to confidentiality.

Statistics Portugal

6

Slide7

European and National Statistics (2013):

European scope

7

Statistical Operations

(2013)

European

National / Other

Total

Statistics Portugal

153

82%

33

18%

186

100%

Quantity of Statistical Operations

Slide8

Timeline8

From 1989 to 2003:

Headquarters & Regional Directorates;Regional Directorates:Firstly acting as dissemination and data collection center for the region (NUTS II);Gradually assumed active role in statistical production and regional studies;

Its organization and resources have increased fast.

From 2003:Proactive evaluation of the existing model;Reorganization not guided by resources constraints.

Slide9

Reorganization in 20049

New Executive board in 2003

;Hired external advisory company (international strategy consultants);Request a Peer Review in 2004:Mr. Ivan

Fellegi

Former Chief Statistician of Canada from 1985 to 2008;Mr. Jacob Ryten Former Assistant Chief Statistician of Canada from 1969 to 1997.A proactive action: to create a new structure.

Slide10

Former organization (2003)10

Executive Board

Lisbon and Tagus Valle

North

Center

Alentejo

Algarve

Dissemination

Finance

Human Resources

Planning and International

Legal Support

Methodology

Information Systems

National Accounts

Agriculture

Population

and Census

Business

Industry and Services

Social

Short Term

and Forecast

Regional Directorates

Support

Subject Matter

Slide11

Regional Directorates (2003)11

Regional Directorate

Social

Business

Studies

RH & Resources

IT Support

Dissemination

Regional Directorate (Department)

Unit

Section

Three hierarchical levels

An example of the organization of a former RD.

Slide12

Local 1Survey 2Survey n

12

Difusão

Tratamento

Recolha

Difusão

Tratamento

Recolha

Difusão

Tratamento

Recolha

...

...

Former architecture

Difusão

Tratamento

Recolha

Difusão

Tratamento

Recolha

Difusão

Tratamento

Recolha

Dissemination

Treatment

Collection

Dissemination

Treatment

Collection

Dissemination

Treatment

Collection

Local 2

Local n

Survey 1

...

Stovepipe systems

Complex, inefficient and not flexible

Slide13

Former organization (2003)13

Heavy and costly organization

788 workers: 37% in Regional Directorates.195 managers (25%): 14 Departments, 5 Regional Directorates, 48 Units, 128 sections Duplication of work, procedures and tools;

Not flexible enough for the future.

Need to be reorganized

Slide14

Fellegi & Ryten’s

Peer Review

Objective: to review the Portuguese statistical system and produce recommendations;

Main results:

The diagnosis;Structural problems and remedies;

Recommendations

Slide15

Started in 2004 and based on the Peer Review´s recommendations;Internal reorganization:A central data collection department was created;Regional directorates were extinct;

Domain departments have been merged into three units: economics, social and national accounts;

Methods and information system were merged into one department. It was a successful challenge, although some resistances and constraints.

15

Production re-engineering

Slide16

New organization (2004  2013)

16

Executive Board

Porto

Finance & HR

Inf

Systems Methodology

Data Collection

National Accounts

Economics

Social

Delegations

Support

Statistical Production

Coimbra

Évora

Faro

Subject Matter

Staff

Dissemination

Planning

Legal Support

International

Communication

L1: Department

L2: Unit

L3: Section

Three hierarchical levels

Slide17

Production architecture

17

Social and Demographics

Economics

National Accounts

Data Collection

Methods and Information Systems

Slide18

18Impact of the reorganization


2003

2013

% Diference

L1:

Departments

19

7

-

63%

L2:

Units

48

34

-29%

L3: Sections

128

13

-90%

Managers

195

61

-69%

Workers / Managers

4,0

10,9

173%

Workers

788

665

-

16%

Lisbon

496

508

2%

Regions

292

157

-46%

Staff reduction without firing anyone

Slide19

19Human Resources Distribution(by macro process)

Slide20

Centralised Data Collection

Slide21

Survey’s data collection:40% budget & 30% human resources.

Data Collection at

Statistics Portugal21

Survey Data Collection is a core function

Slide22

A Data Collection department assures the collection, processing and analysis of collected microdata, covering all business and social surveys;HR  ~ 200 workers + 350 freelance interviewers

Data Collection

22

120 surveys

105

business (self-completed)

15 by interview (CAPI and CATI).

125.000 companies (99% SME);

70.000 dwellings;35.000 farms.

Annual figures

Slide23

Data Collection Department23

Data Collection

Self-completed

Surveys

Interview

Surveys

Data Collection

Processes

Lisbon 1

Lisbon 4

Lisbon 3

Lisbon 5

Lisbon 6

Lisbon 7

Coimbra

Porto 1

Porto 3

Évora

Faro

Porto 2

Slide24

Data Collection DepartmentHuman Resources by Unit

24

Slide25

Data Collection DepartmentOrganization by Unit

25

Self-completed surveys:By project or statistical operation;National management of each project;

Interview surveys:

Sections work with the same projects;Share same methods, procedures and tools.Data collection processes;National coordination of interview surveys;CATI national coordination.

Slide26

Management within DC26

Decentralized managed but centrally controlled;

One overall budget distributed through each management level;Autonomy with responsibility;Objective definition in “cascade”;Department

 Unit  Section  worker

HR: matrix management;

Slide27

Interview Management System27

Interview Management System supports all the processes related with social statistics and the price collection;

The Survey Management System has several components: team management and the tools used by the interviewers to collect data, transfer them to Statistics Portugal, allowing them to work both in face-to-face and telephone interviews..

Slide28

HR and costs control28

Assiduity control

 WebRH app;Accounting to projects 

Factiv

appProject codes and Task codes;Individually daily allocation of the working time to each project code and tasks;Direct HR costs are monthly calculated to each project, according to individual wages and social costs;

The same with other costs and indirect costs;Transfers can be made between projects.

Slide29

2

Design

3

Build

4 Collect

5

Process

6

Analyse

7

Disseminate

1

Specify

Needs

3.5

Test statistical business process

3.4

Test production system

3.3

Configure workflows

3.2

Build

or

enhance process components

3.1

Build data collection instrument

1.6

Prepare business case

1.5

Check data availability

1.3

Establish output objectives

1.2

Consult and confirm

needs

1.1

Determine needs for information

2.6

Design production systems and workflow

2.5

Design

statistical

processing methodology

2.4

Design

frame

and sample methodology

2.3

Design data collection methodology

2.2

Design variable descriptions

2.1

Design outputs

4.4

Finalize collection

4.3

Run collection

4.2

Set

up

collection

4.1

Select sample

5.1

Integrate data

5.2

Classify and

code

5.3

Review, validate, edit and analyze

microdata

5.4

Impute

5.5

Derive new variables and statistical

units

5.6

Calculate weights

5.7

Calculate aggregates

6.1

Prepare draft

outputs

6.2

Validate outputs

6.3

Scrutinize and

explain

6.4

Apply disclosure control

6.5

Finalize outputs

7.5

Manage user support

7.4

Promote dissemination products

7.3

Manage release of dissemination products

7.2

Produce dissemination products

7.1

Update

output systems

8

Archive

9

Evaluate

8.2

Manage archive repository

8.1

Define archive

rules

8.3

Preserve data and associate metadata

8.4

Dispose of data and associated metadata

9.1

Gather evaluation inputs

9.2

Conduct evaluation

9.3

Agree action

plan

Levels 1 and 2

GSBPM,

version

4.0

1.4

Identify concepts

3.6

Finalize production system

5.8

Finalize data

files

Data Collection

Subject Matter

Shared DC/SM

IS & Methods

Dissemination

Quality Control

Division of work

Slide30

Relationship between DC & Subject Matter (1)

30

One major issue at the beginning;There were a negative perception of the DC tasks  “a low profile work …”

Conversely, subject matter statisticians were very “data collection oriented”;But expectations are always high!

“You have to do better than me (when I was responsible for DC) …”

Slide31

Relationship between DC & Subject Matter (2)

31

SolutionService Level Agreements (SLA) to manage expectations and to build trust;It was used a step-by-step approach, from a simplified version and increasing gradually the complexity.

Slide32

Administrative Sources & Registers

Slide33

Administrative Sources (ADS)33

ADS are not (still) in the scope of the DC Department;

It is managed by Subject Matter departments, supported by IS & Methods;Statistics Portugal is still very “survey oriented”. Thus, ADS are not well developed;But there one remarkable initiative:IES: Simplified Business Information

Slide34

Data CollectionInfrastructure

Slide35

Survey Management System (SIGINQ);Other Data Collection Systems:Datawahouse

;HomeCATI;

Interview Management System;Telephone Data Entry;

Outline

35

Slide36

Survey Management System

Survey Management

Slide37

Design a new approach of production based on a broad integration with process and tools standardization;Use of an internal reference model to describe the statistical business processes (SPPM);

37

Re-engineering Working Group

Survey Management

Business

Agriculture

Social

Slide38

Management and control of all data collection processes, including information about respondents and paradata;Supported by the Metadata System;Process Management System

Business

Agriculture

Social

SAGR

Similar features,

but adapted

by statistical unit.

38

Slide39

GPap is the core for Business Surveys, linked with:Questionnaires and Capture (WebInq and WebReg);Respondent Management (GRESP), Business Register (FUE),

Transfers validated microdata to Datawarehouse

.

Process Management System

39

Slide40

Survey

Unit

OccurCollect

Report

AnalysisUpdate

Manag.

Help

Errors

Status

Validations

Primary Val

Upload

Insert

Manage entries

Data Entry

Method

Specific

Generic

SIGUA block prop

Manage

Cross

Specific

Supplement

Launch

By mode

Consult

Open / Close

Specific Tables

Generic Tables

Specific Reports

Generic Reports

Consult transfers

Transfer to analysis

Consult Analysis

GPap

Survey

Register

Sample

Respondent

Batch update

Table Manag.

Common process

Specific process

GPap

components

40

Slide41

41

BEA

FNA

Survey Management

Contact Centre

Business

Agriculture

Social

SAGR

Interviewer Management

Slide42

HomeCATI42

HomeCATI

is an infrastructure which allows freelance interviewers work at home, integrated in a virtual contact centre and based on a voice over Internet protocol (VoIP) solution;This solution has many advantages, but there are many challenges to deal with, like the interview supervision and monitoring.

Slide43

Interview Management System43

Interview Management System supports all the processes related with social statistics and the price collection;

The Survey Management System has several components: team management and the tools used by the interviewers to collect data, transfer them to Statistics Portugal, allowing them to work both in face-to-face and telephone interviews..

Slide44

Telephone Data Entry (1)44

Telephone Data Entry (TDE), which is a solution by which respondents can return their data using the keypad on their telephone;

Respondents are sent a letter which informs them of the free phone telephone number to call, their unique respondent identification key number, and the data required. On calling the telephone number, the respondent can choose the appropriated survey, and a recording of the survey questions is heard and the respondent enters their data using their telephone keypad.

Slide45

Automated Data Collection45

INE is developing and implementing Automated Data Collection Methods for Business Surveys;

It aims to reduce the reporting burden businesses, to improve the timeliness and to promote a more efficient way of collection data;Based on XML, it is already available for two surveys.

Slide46

Benefits of Centralised Data Collection

Slide47

Development and management of a common infrastructure, both intellectual and operational, which could only be duplicated geographically;Creation of a flexible, dynamic and responsive production architecture tied to the common services provided by shared means of production (sampling frames, classifications and standards, questionnaire designs, methods and tools, etc.);

47

Benefits of centralised DC (1)

Slide48

Creation of right means of coordination to make our design work in order to face future (but now present) budgetary cuts;Adoption of a cost-effective approach that makes the most effective use of regional and central resources. It was possible to do more with the same.Reduction of the data collection cycle, specially the time to deliver statistical results;

48

Benefits of centralised DC (2)

Slide49

Assistance to develop a steady culture based on efficiency and innovation, considering the full in-house design and development approach;Development of analytic competences in order to improve the quality of the information (more reviewing and validation tools);

49

Benefits of centralised DC (2)

Slide50

Creation of an integrated Survey Management System as well as other Data Collection tools;Reduction of respondent burden:Avoiding duplication of variables and offering easy and multiple ways to provide data;

Reduction of production costs;Estimated in 27.2% (business surveys; 2005 – 2012).

50

Benefits of centralised DC (2)

Slide51

Cost reductionBusiness data collection51

Total costsBase

2005 = 100%

- 27.2%

Slide52

Electronic Data

Collection

52

Visits

% electronic collection

Questionnairs

2013 – 100%

Slide53

Electronic Data CollectionAvoid variable duplication53

Common Variables

Easy update

Slide54

Future of Data Collection

Slide55

Increase the use of administrative sources;Extend Integrated Production Systems;Improve Automated Data Collection and the use of Scanner Data on price collection;

Increase the multimodal collection capability (web based);Improve the use of paradata to support the quality processes;

Create new processes to better understand respondent's behavior in order to motivate their collaboration.55

Future of Data Collection

Slide56

Almiro Moreiraalmiro.moreira@ine.ptStatistics Portugal

«

25 September 2013Geneva, Switzerland

UNITED NATIONS

ECONOMIC COMMISSION FOR EUROPECONFERENCE OF EUROPEAN STATISTICIANSTopic (ii): Centralising data collection

CREATING A DATA COLLECTION DEPARTMENT:

STATISTICS PORTUGAL'S EXPERIENCE

Paulo Saraiva dos Santos

paulo.saraiva

@

ine.pt

Statistics Portugal

Thank you for your attention!