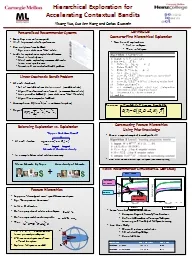
Rachel Pottinger University of British Columbia Joint work with lots of great students including Zainab Zolaktaf Reza Babanezhad Jian Xu Omar AlOmeir and Janik Andreas Exploring and understanding data ID: 792378 Download
Jan D. Reinhardt, . PhD; . James E. Gosney, MD; Andrew J. Haig, . MD; . & . Jian’an. . Li, MD. Background. Natural . disasters => new . disabilities and . existing disabilities. Physical Rehabilitation required.
: . Enhancing Access to Earth Observations for Societal Benefit. Clarissa Anderson, UC Santa Cruz. CJ Reynolds, Univ. of South Florida. Frank Muller-. Karger. , Univ. of South Florida. RATIONALE. M. ajor .
(ESaaS §12.6). © 2013 Armando Fox & David Patterson, all rights reserved. The Fastest . D. atabase is the One . Y. ou Don’. t . U. se. Caching: . Avoid touching database if answer to a query hasn’.
“half-baked” system. Pros: people not used to databases can manipulate data. Databases are hard to use… . Do you agree? Why? Why not?. Issues with the . DBTouch. Idea. Alternatives. Use-cases.
Presented by:. Ms. . Kimberly Strand . & . Ms. . Timberly. Walton. Participants will deepen their understanding of mathematics discourse, including some background and rationale.. Participants will experience Number Talks and consider how they might be used as part of a daily routine..
crohnsandcolitisorguk Understanding IBD Ed 5 June 2014 brPage 2br Understanding IBD About this booklet If you have recently been diagnosed with Ulcerative Colitis UC or Crohns Disease the two most common forms of In64258ammatory Bowel Disease IBD y
Somewhere that stores information and can be searched for using query's. The Key components of a database are tables, records, fields, data types and relationships. Tables: . where simple information can be stored e.g. name, address, age etc… Or At a school the class list of each community group. .
Cyber Security Experts FUTURE JOBS READERS Level 1- ② Connecting to the internet The Job of a Cyber Security Expert A wallet and keys A safe A lock Why do we need cyber security experts? Hackers steal information online. They steal birth dates, phone numbers, and banking numbers. They can find out our credit card numbers, passwords, and more!
Dale E. Gary. Professor, Physics, Center for Solar-Terrestrial Research. New Jersey Institute of Technology. 1. 9/25/2012. Prototype Review Meeting. outline. Disclaimer. Two databases. Monitor database—the .
Chapter 10. Database Administration. 1. Objectives. What administrative tasks need to be performed with a database application?. How do you ensure data is consistent across multiple databases?. What are the basic tasks of a database administrator?.
Published bytickorekk
Rachel Pottinger. University of British Columbia. Joint work with lots of great students, including Zainab Zolaktaf, Reza Babanezhad, . Jian Xu, Omar AlOmeir. , and . Janik. Andreas. Exploring and understanding data.
Download - The PPT/PDF document "Improving Understanding and Exploration ..." is the property of its rightful owner. Permission is granted to download and print the materials on this web site for personal, non-commercial use only, and to display it on your personal computer provided you do not modify the materials and that you retain all copyright notices contained in the materials. By downloading content from our website, you accept the terms of this agreement.
Slide1
Improving Understanding and Exploration of Data by Non-Database Experts
Rachel Pottinger
University of British Columbia
Joint work with lots of great students, including Zainab Zolaktaf, Reza Babanezhad,
Jian Xu, Omar AlOmeir
, and
Janik
Andreas
Slide2Exploring and understanding data
More users have more data
This is particularly challenging for users without much database background
I like to work with data and users who have real world
problems. Then I extend to a more general scenario.
How can we help users with little database expertise to understand and explore their data?
Slide3Exploring and understanding data
Exploration
: recommend items beyond the popular items in recommender systems
Understand
: help users understand the range of possible answers in data aggregated from multiple sources
Exploration and understanding: Ongoing work on exploring and understanding
Slide4Exploration:
Recommend long tail items
(joint with Zainab Zolaktaf and Reza Babanezhad)
Standard recommender systems algorithms tend to emphasize popular items
This tends to cause recommendation consumers to only find things they already know
But most items are “long tail” Presented at ICDE (International Conference on Data Engineering) last week
Slide5Motivating Example
Top-N recommendation
Recommend to each user a set of N items from a large collection of items
Used in Netflix, Amazon, IMDB, etc.
Problem
Tend to recommend things users are already aware ofE.g., Suggests “Star Wars: The Force Awakens” to users who have seen “Star Wars: Rogue One
”
Slide6Motivating Example
Many recommendation systems
Take as input a set of users and their ratings (e.g., ratings on movies)
Focus on accurately
predicting user
preferences based on historyUse a subset of data as “gold standard”
Interaction
d
ata often suffers
from
popularity bias
and sparsity
Have to recommend popular items to maintain performance accuracyRich get richer effectAccuracy alone is not leading to effective suggestions?
5
4
5
2
3
5
4
54315412
Slide7Why long-tail items matter
Consumers want
Accuracy
Novelty
…
Providers of items wantKeep consumers happyItem-space
coverage
Generates revenue
…
Less focus on popular items
Pareto principle (80/20 rule
)
Popularity
Products
Long-tail
Head
Long-tail items
Generate
the lower 20% of the
observations
Empirically validated: Correspond to almost 85% of the items in several datasets
Slide8Selected related work
Accuracy Focused
KBV09-
Koren
, Yehuda, Robert Bell, and Chris
Volinsky. "Matrix factorization techniques for recommender systems." Computer
42.8 (2009
).
WKL+08- Weimer, Markus, et al. "
Cofi
rank-maximum margin matrix factorization for collaborative ranking."
Advances in neural information processing systems
. 2008.Re-ranking frameworksAK12- Adomavicius,
Gediminas, and YoungOk
Kwon. "Improving aggregate recommendation diversity using ranking-based techniques." IEEE Transactions on Knowledge and Data Engineering 24.5 (2012): 896-911.HCH14- Ho, Yu-Chieh
, Yi-Ting Chiang, and Jane Yung-Jen Hsu. "Who likes it more?: mining worth-recommending items from long tails by modeling relative preference." Proceedings of the 7th ACM international conference on Web search and data mining. ACM, 2014.Evaluation of top-N recommendation
CKT10- Cremonesi, Paolo, Yehuda Koren, and Roberto Turrin. "Performance of recommender algorithms on top-n recommendation tasks." Proceedings of the fourth ACM conference on Recommender systems
. ACM, 2010
.
Ste11-
Steck, Harald. "Item popularity and recommendation accuracy." Proceedings of the fifth ACM conference on Recommender systems. ACM, 2011.Ste13- Steck, Harald. "Evaluation of recommendations: rating-prediction and ranking." Proceedings of the 7th ACM conference on Recommender systems. ACM, 2013.
Slide9Challenges: Accuracy, novelty, and coverage trade-offs
Promoting long-tail item
can increase
novelty
[Ste11]
Long-tail items are more likely to be unseen
Promoting
long-tail items increases
coverage [
Ste11
]
Generates revenue for providers of items
Long-tail promotion can reduce accuracy [Ste11
]Not all users receptive of long-tail items
Slide10Challenges: R
ecommendation system evaluation
Need to assess multiple aspects
Accuracy, novelty, and coverage
No single measure that combines all aspects. Report
trade-offs?Need to consider real-world settingsDatasets are
sparse
Users provide little feedback
Test
ranking
protocols [
Ste13, CKT10]
Do not reward popularity-biased algorithmsOffline accuracy should be close to what user experiences in real-world
Slide11Solution overview: GANC
A
G
eneric top-N recommendation framework that provides customized balanced between
A
ccuracy, Novelty, and Coverage
Objective
: Assign top-N sets to all
users
Find
, the collection of top-N sets
to maximize
Slide12
Solution overview: GANC
Main features of our solution
Directly infer user long-tail novelty preference
from interaction data
Customize trade-off parameters per user
Integrate
into a generic
re-ranking
framework
independent of any base recommender
Plugin a suitable base recommender
w.r.t
. factors such as dataset
density
Slide13
Long-tail
novelty preference
model (
)
(1) Activity
Number observations in the train set (e.g., number of rated items)
Does not distinguish between long-tail and popular items
(2) Normalized long-tail measure
Ratio of long-tail items
rated
in train set
Does not consider
if
user liked item(3) TFIDF-MeasureIncorporates rating and popularity of itemsDoes not consider view of other users
(4) Generalized measure
Optimization approachIncorporates rating information, popularity of items, and view of other users
We created and evaluated 4 long-tail novelty preference models
ML-1M (More dense)
Slide14GANC: Accuracy recommenders
Focuses
on making accurate suggestions
Evaluated existing models from literature
PureSVD
[CKT10]Regularized SVD [KBV09]Most Popular [CKT10]
Slide15GANC: Coverage recommenders
Focus on increasing
coverage
Random coverage recommender
Static coverage
recommender Consider how many times the item was rated in the pastGain of recommending an item is proportionate to the inverse of its frequency in train set Dynamic coverage recommender
Consider how many times item has been recommended so far
Gain of recommending an item is proportionate to the inverse of
item
recommendation
frequency
Slide16Empirical Evaluation
ML = Movie Lens MT = Movie
Tweetings
.
ML, MT, and Netflix these are common recommender
datasetsDatasets have varying level of densityLong-tail items correspond to approximately 85% in three datasets
Slide17Empirical Evaluation
Performance metrics
Local ranking accuracy metrics
Precision, Recall, F-measure
Long-tail promotion metrics
LTAccuracy (emphasizes novelty and coverage), Stratified Recall (emphasizes novelty and accuracy)Coverage metrics
Coverage, Gini
Test ranking protocol
[
Ste13,
CKT10
]
“All unrated items test ranking protocol”Generate
the top-N set of each user, by ranking all items that do not appear in the train set of that user
Closer to accuracy the user experiences in real-world settings
Slide18Algorithms Compared
Re-ranking frameworks for rating prediction
Regularized SVD (RSVD)
Resource Allocation (5D)
Ranking-based Techniques (RBT)
Personalized Ranking adaptation (PRA)Report results for two variants of each algorithm
Slide19Comparison with re-rankings models for rating-prediction
Dense
dataset
ML-1M
RSVD is base accuracy recommender
Lower height is better Corresponds to better rankGANC outperforms RSVD in all metrics
GANC obtains lowest overall performance across 5 metrics
(F)measure@5
(S)
tratified
Recall@5
(L)Taccuracy@5
(C)overage@5
(G)ini@5
Slide20Changing accuracy recommenders explores tradeoffs between accuracy and coverage
GANC allows different accuracy recommenders
Plugging the
non-personalized
algorithm
Pop
as accuracy recommender
Competitive with more sophisticated algorithms like CofiR100
Slide21Comparison with
t
op-N recommendation algorithms
Sparse dataset
MT-200K
Pop is base accuracy recommenderLower height is better Corresponds to better rank
Three variations of GANC competitive with more PSVD100 and Cofi100
(F)measure@5
(S)
tratified
Recall@5
(L)Taccuracy@5
(C)overage@5
(G)ini@5
Slide22Act 2
The first part of the talk described how to help users explore data beyond the most popular in a recommendation setting
Next we’ll help
users understand the range of possible answers in data aggregated from multiple sources
Published in Extending
DataBase Technology (EDBT) 2015 (joint with Zainab Zolaktaf and Jian Xu)
Slide23Looking for climate change: what is the average high temperature across BC for each year?
Averaging across readings over the entire province seems reasonable
But there are problems, e.g., inconsistent values
Slide24In this work, we helped users understand aggregation query results from multiple sources
Answering queries in integration contexts requires combining sets of data that are segmented across multiple sources
Averaging over all the points doesn’t work
Some data points have duplicates across the sources
The duplicates may have different values in the sources
Which set of sources and value combinations do we use?We define a viable answer as a possible answer
Slide25Way #1 to compute average temp
Slide26Way #2
to compute average temp
Slide27Way #3
to compute average temp
Slide28Contributions of this part
We define aggregate answers as a distribution of viable answers
We provide summary statistics and algorithms for the viable answer distribution
Key point statistics
High coverage intervals
Stability scoreWe verify the effectiveness of our methods using real-life and synthetic data
Slide29Contributions of this part
We
defined
aggregate answers as a distribution of viable answers
We
provided summary statistics and algorithms for the viable answer distributionKey point statisticsHigh coverage intervalsStability score
We
verified
the effectiveness of our methods using real-life and synthetic data
Slide30High coverage intervals and optimization
Point statistics such as mean and variance are insufficient
Slide31Computing high coverage intervals
The ideal, full viable answer distribution is prohibitively expensive to obtain
We used sampling, bootstrapping and a greedy algorithm to minimize interval length so that coverage of viable answers is above a set threshold
Slide32Act three: ongoing work
Slide33Understand
: help
users
understand data
provenance (joint work with Omar AlOmeir)
Database researchers have done a great job of exploring different provenance definitions and how to calculate itHowever, this information is difficult to understand by non-DBA users, which makes it hard for users to trust their dataWe created a desirable set of features for provenance exploration systems and implemented such a system
Our case study was on Global Legal Entity Identifiers
We’re looking for more data
Slide34Understand
: help users understand open data
(joint work with
Janik
Andreas)
Governments are increasingly creating open data sitesHowever, these open data sites are hard to use – it’s hard to find the data that users are looking forWe’re doing a case study on local data to look at some common open data issues:Quality – granularity and details of available dataMetadata and data formatting
Availability and completeness
Slide35Understand:
how can we help users understand why they got the wrong answer?
Slide36I’d love to have more people to work with
If you have data or ideas that you think would fit in, I’d love to talk… especially if you are looking for a
postdoc position!
© 2021 docslides.com Inc.
All rights reserved.