PPT-Introduction Recent Table
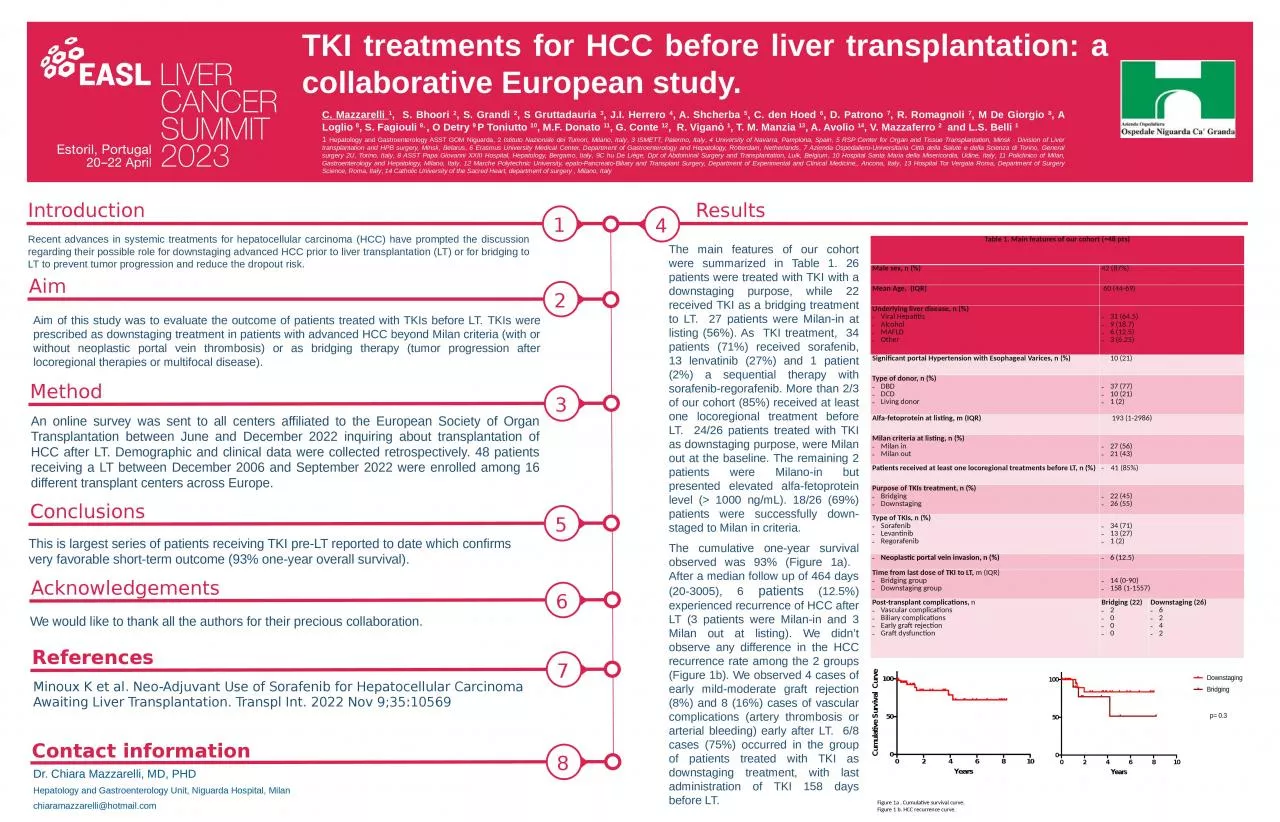
2 Aim Table 1 Main features of our cohort 48 pts Male sex n 42 87 Mean Age IQR 60 4469 Underlying liver disease n Viral Hepatitis Alcohol MAFLD Other 31 645
Download Presentation
"Introduction Recent Table" is the property of its rightful owner. Permission is granted to download and print materials on this website for personal, non-commercial use only, provided you retain all copyright notices. By downloading content from our website, you accept the terms of this agreement.
Presentation Transcript
Transcript not available.