PDF-11 GRAPHS IN ECONOMICS
Author : trish-goza | Published Date : 2016-04-20
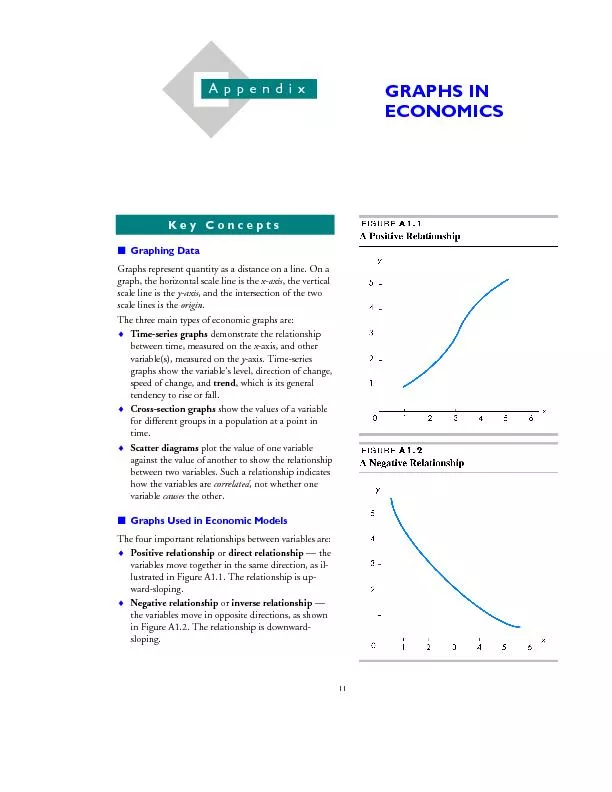
Graphing Data Graphs represent quantity as a distance on a line On a variables measured on the how the variables are Graphs Used in Economic Models Appendix minimum
Presentation Embed Code
Download Presentation
Download Presentation The PPT/PDF document "11 GRAPHS IN ECONOMICS" is the property of its rightful owner. Permission is granted to download and print the materials on this website for personal, non-commercial use only, and to display it on your personal computer provided you do not modify the materials and that you retain all copyright notices contained in the materials. By downloading content from our website, you accept the terms of this agreement.
11 GRAPHS IN ECONOMICS: Transcript
Download Rules Of Document
"11 GRAPHS IN ECONOMICS"The content belongs to its owner. You may download and print it for personal use, without modification, and keep all copyright notices. By downloading, you agree to these terms.
Related Documents