/
Direct imaging of AGN jets and black hole vicinity Direct imaging of AGN jets and black hole vicinity

Direct imaging of AGN jets and black hole vicinity - PowerPoint Presentation

trish-goza
trish-goza . @trish-goza
Follow
464 views
Uploaded On 2016-06-26

Direct imaging of AGN jets and black hole vicinity - PPT Presentation

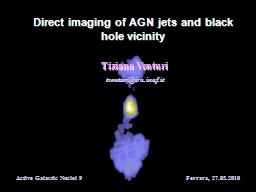
Tiziana Venturi tventuriirainafit Active Galactic Nuclei 9 Ferrara 27052010 Radio VLBI as the most direct way to ID: 378921

ghz radio sources monitoring radio ghz monitoring sources vlbi amp jet 2010 current vlba ray sample agn imaging high

Share:

Link:

Embed:

Download Presentation from below link

Download Presentation The PPT/PDF document "Direct imaging of AGN jets and black hol..." is the property of its rightful owner. Permission is granted to download and print the materials on this web site for personal, non-commercial use only, and to display it on your personal computer provided you do not modify the materials and that you retain all copyright notices contained in the materials. By downloading content from our website, you accept the terms of this agreement.


Presentation Transcript

Slide1

Direct imaging of AGN jets and black hole vicinity

Tiziana Venturi

tventuri@ira.inaf.it

Active Galactic Nuclei 9 Ferrara, 27.05.2010Slide2

Radio VLBI

as the

most direct

way to look into

the inner regions of

AGNsKnowledge of the inner jets in AGN even more relevant these days due to the current γ-ray observatories: true simultaneous radio/γ-ray studies of correlated variability, essential to locate the γ-ray emission.Current hot VLBI studies of AGNs- Simultaneous radio/γ –ray monitoring (radio imaging) of flaring blazars- The very faint Universe: low power nearby AGN (see Giroletti) & powerful high-z quasars

z=0.01 -> 1

mas

= 0.2 pc

z=0.1 -> 1

mas

= 1.8 pc

z=2 -> 1

mas

= 8 pc Slide3

Unified view of Radio Loud AGN

Low power

FR I and

BL Lacs

High power

FR II and FSRQUnification models (Orr & Browne 1982; Urry & Padovani 1995) successfully tested in the radio band for the two power ranges : viewing angles and intrinsic relativistic speeds at the jet base Slide4

AGNs all very similar from a morphological point of view when looked on the parsec-scale: mostly

core-dominated with an

asymmetric jet, regardless of the classification (radio galaxies, BL Lacs, FSRQ)Orientation and relativistic velocities at the jet base

Markarian 421 – Blue BL

BL Lac – Red BL

3C454.3 - FSRQ

Cygn A - FRIIM87 - FRIImages from MOJAVE at 15GHzMkn 421BL Lac3C454.3M87Cygnus ASlide5

Sample of

low/intermediate

power radio galaxies

(Giovannini

et al. 2001)Sample of neraby BLLacs

(Giroletti et al. 2004)Consistency in the distribution of Lorentz factorsSlide6

Sample of low power radio galaxies

(Giovannini et al. 2001)

Sample of nearby

BLLacs(Giroletti et al. 2004)

Distribution of viewing angles consistent with the idea that the two

classes of radio sources belong to the same population of objects seen under differentangles to the line of sightSlide7

The nuclear radio properties of highly beamed sources

The Blazar World

When we look at the powerful radio sources aligned at small angles to the line of sight, the most extreme properties are found:

Strong flux density variabilityMorphological changes implying superluminal speedsInstabilities in the radio jet

ObserverSlide8

Flux density variability

Venturi et al. 2001 & 2003

Expanding cloud of relativistic electrons initially thick at some frequencies and viewed very close to the line of sight

Slide9

PKS 1510-089

HPRQ; z=0.36

β

app= 23.76c

2200+420BLLac; z=0.0686β

app= 10.57c

1995 - 20101995 - 20101995 - 20103C454.3HPRQ; z=0.859βapp= 14.19cStructural variability and superluminal motionFavourable viewing angle and high intrinsic speed of the radio emitting plasma, lead to superluminal proper motionPolarization and total intensity movies from MOJAVESlide10

3C279 VLBA 43GHz

HPRQ, z=0.536

β

app

= 20.57c

Radio galaxy, z=0.033

βapp = 5.43Slide11

Current studies.

I. Statistics from the MOJAVE survey

The sample & the project

- Nearly 300 compact AGN in the Northern Sky,

135 of which form a

complete

flux density limited sample (δ > -20o, S2cm > 1.5 Jy at any epoch between 1994 and 2004)- Monitoring carried out with the VLBA at 2 cm starting from 1994- Statistical analysis made on the basis of the original sample:135 sources526 separate features in 127 jets (no speed measurements for 8 sources) database consisting of 2424 imagesIdeal band: high angular resolution, very good image sensitivity and better reliability compared to BU monitoringSlide12

Analysis carried out for BL Lacs, FSRQ and radio galaxies separately

(Lister et al. 2009)

Fastest component moving at 50.6c and interpreted as the upper end of the AGN jet Lorentz factor distribution

Peak at

~

10cApparent velocity vs redshift: the distribution is not the result of observational limitationsSlide13

Locus of (

β

app

,L) for sources with γ=32 and L=1025

W/HzVLBA observational limit set at S=0.5 Jy and

μ

=4 mas/yrRadio galaxiesBL LacsQuasarsSlide14

Before the

advent of AGILE, FERMI and

ground-based new VHE observatories

,only a handful of

simultaneous

multiband campaign carried out on the best known blazars (i.e. 3C279, Mrk 421 …) with a variety of results (Hartmann et al. 2001; Blazejowski et al. 2005), or a posteriori correlations (Jorstad et al. 2001) Current studies. II. Simultaneous radio/γ-ray monitoring with VLBI imaging radioγ-ray γ-ray flareSuperluminal ejection Slide15

PKS 1510-089

(Marscher et al. 2010)VLBA 43 GHz monitoring & Fermi LAT and AGILE observations

Optical

and γ-ray

flares

in good coincidenceRotation of the optical polarization vector2 new superluminal features with speeds of 24±2 c and 21.6±0.6 c Multiband observations interpreted as a single feature (seen as superluminal) moving through a helical magnetic field in the jet acceleration zoneSlide16

3C454.3

(Vercellone et al. 2010)VLBA 15 GHz monitoring & AGILE observations

15 GHz - 7 Aug 2007

Total flux density increase due to the radio core (component C)

Flux density of the main jet components stable or decreasing

No proper motion along the jetNo birth of new components so farFrom the core variability at 43 GHz it was derived that the source is viewed at θ~1.5° and that Γ~20Flares in the optical and γ-ray bandSlow monotonic flux density increase at radio wavelengths Slide17

The case of M87

(Giroletti et al. 2010)

Coordinated radio-VHE (VERITAS) observational campaign

VHE flares on 9/2/2010 and April 2010

Second radio galaxy, beyond 3C84, detected at high energiesSlide18

ATel #2431 – VHE flare on 9 Feb 2010

eVLBI monitoring – 2 epochs before the flare and 4 during and after the flare

Inner jet

HST-1

Evidence for flux density increase at the jet base (

~10%) and continued proper motion in HST-1 with v

app~7cSlide19

VLBI results:

EVN detection rate 100% at 1.6 GHz (top row) as well as at 5 GHz (bottom row)

(the sample was not selected on flat radio spectrum!)

Compact sources, but 4 out of 5 have steep spectrum (

α

~-0.6)

on this scaleCurrent studies. III. VLBI Imaging of high-z quasars - Frey et al.High-z radio quasars with available SDSS spectroscopySample selection: z>4.5; compact on FIRST with 8.8 mJy < S1.4GHz <28.8 mJyz=4.92α=-0.60z=5.01α=-0.58z=4.73α=-0.55z=4.87α=-0.58Slide20

Main

current

ground VLBI facilities

VLBA (δ≥ -30

o)

: 327 MHz - 43 GHz, 512 Mbps www.nrao.eduGMVA (δ≥ -30o ): up to 86 GHzLBA (southern hemisphere): up to 22 GHz European VLBI Network (δ ≥ -10o): 1.4- 22 GHz, 1 Gbpse-EVN, more flexible and more frequent than EVNwww.evlbi.orgMajor support provided to new users by the JIVE staffSlide21

Future Space VLBI missions

Space Radio Telescope

– 2011 327 MHz, 1.6, 4.8, 15-22 GHz

www.asc.rssi.ru/radioastron/news/news.html

ASTRO-G – 2014 www.vsop.iasa.ac.jp/vsop2 Dual Pol. – 8.4, 22, 43 GHz

sub-mas to

μas resolutions from 327 MHz to 43 GHzSlide22

Final Considerations

VLBI is the only way to directly image the central regions in AGNs

The present performances and flexibility of VLBI and e-EVN make AGN cores and jets and very faint AGN the most targeted sources these days

The new space and ground-based high energy observatories have revived the interest in the study of the inner regions in powerful radio galaxies: monitoring of large samples are the current approachSlide23

Current radio programs - I. Imaging Monitoring

MOJAVE

Imaging + monitoring survey (~200 sources) – VLBA @15 GHz TANAMI

southern monitoring of blazars (~80 sources) – LBA @ 8.4 & 22 GHz BU Blazar Group

22 & 43 GHz VLBA imaging monitoring of

~ 20 sourcesVIPSVLBI Imaging and Polarimetry Survey, VLBA@5 GHz, ~1200 sourcesUSNO-RRFIDDatabase of geodetic observations at 2.3/8.4 GHz and 22 GHzDXRBSEVN observations at 5 GHz of ~ 100 sources from the DXRBS sample Slide24

Current radio programs - II. Single dish monitoring

UMRAO

UMich Radio Observatory, full polarization long term monitoring at 4.8, 8.4, 15 GHz of

~ 50 bright sources Ratan

monitoring survey of ~ 700 bright sourcesMetsahovi

long term monitoring (

~ 100 sources) @ 22 & 37 GHz OVRO daily monitoring of ~ 1000 sources @ 15 GHzFGammaEb (11cm to mm)/IRAM (1,2,3 mm) simultaneous monitoringMedicina and Noto Monthly monitoring of ~ 30 sources at 5, 8.4 and 22 GHz