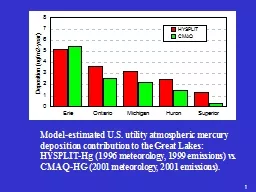
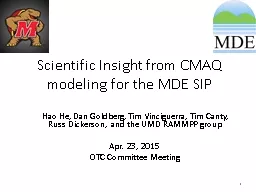
Hao He Dan Goldberg Tim Vinciguerra Tim Canty Russ Dickerson and the UMD RAMMPP group Apr 23 2015 OTC Committee Meeting 1 Beta Chemistry 2 Problem 1 In standard CMAQ lifetime of alkyl nitrates NTR is 10 days Long lifetime means NTR does not contribute to ozone ID: 592240
Download Presentation The PPT/PDF document "Scientific Insight from CMAQ modeling fo..." is the property of its rightful owner. Permission is granted to download and print the materials on this web site for personal, non-commercial use only, and to display it on your personal computer provided you do not modify the materials and that you retain all copyright notices contained in the materials. By downloading content from our website, you accept the terms of this agreement.
Slide1
Scientific Insight from CMAQ modeling for the MDE SIP
Hao He, Dan Goldberg, Tim Vinciguerra, Tim Canty, Russ Dickerson, and the UMD RAMMPP groupApr. 23, 2015OTC Committee Meeting
1Slide2
“Beta Chemistry”
2Problem #1: In standard CMAQ, lifetime of alkyl nitrates (NTR) is ~10 days. Long lifetime means NTR does not contribute to ozone production.
Observations indicate NTR has lifetime of 1 day.
Solution: Increase loss of NTR so modeled alkyl nitrates agree with observations taken during the 2011 DISCOVER-AQ campaign.
Result:
NTR loss leads to increased
NO
x
Ozone increases.
See Canty et al., Atmos. Chem. Phys. Discuss. 2015Slide3
“Beta Chemistry”
3Problem #2: Overestimated mobile NOx Emissions in NEI.
Observed CO/NO
y ratio during the 2011 DISCOVER-AQ is ~1.75 times larger than NEI. Observed CO in good agreement with NEI NOy
may be overestimated in NEI.
Solution:
Decrease mobile NO
x
emissions by 50%
Result:
Lower NO
x
concentrations
Ozone decreases
See Anderson et al., Atmos. Environ. 2014Slide4
“Beta Chemistry”
4Problem #3: Uncertainties in biogenic emissions modelingOverall
effect on ozone depends on biogenic emissions, especially isoprene.
Solutions: Recent updates to biogenic emissions inventory models MEGAN (v2.04 to v2.10) and BEIS (v3.14 to v3.6*)
*BEIS v3.6 is still under development
Results:
2007 platform:
MEGANv2.04
→
MEGANv2.10
Overall
decrease
in isoprene
ozone deceases
2011 platform:
BEISv3.14
→
MEGANv2.10
Overall
increase
in isoprene
ozone risesSlide5
Modeling Platform and Emissions
2011 Modeling PlatformCMAQ v5.0.1 with CB05 and AE5 schemeEPA 2011 meteorology (12 km) in the eastern US2018 EmissionsOptimistic emissions for 2018ICI boiler and EGU NOx reductions
Final Tier 3 mobile reductions
5Slide6
2018 Sensitivity Runs
Adjust EGU NOxIL, IN, KY, MD, MI, NC, OH, PA, TN, VA, WVScenario 3A ‘best’ Reduce to 2005-2012 best NOx rates
Scenario 3B ‘worst’ Increase 3A
NOx to worst ratesScenario 3C ‘actual’Increase 3A NOx to 2011 rates
Scenario 3D
‘ideal’
SCRs added to remaining uncontrolled units in neighboring states (VA, IN, KY, OH, MI, NC, OH, VA, WV)
Scenario ATT-4
‘MD extra’
Scenario 3A plus ~50% reduction in MD EGU
NO
x
6Slide7
7
CMAQ Model Beta Scenarios (2011 platform)
“Best Case”- All SCRs Running
“Worse Case”- No SCRs RunningSlide8
8
CMAQ Model Beta Scenarios (2011 platform)
“Best Case”- All SCRs Running
“Real Case”- Some SCRs RunningSlide9
9
CMAQ Model Beta Scenarios (2011 platform)
“Best Case”- All SCRs Running
“Better Case”- More SCRs RunningSlide10
10
All model results for July only (2018): Standard Model
County
Site
DV 2011
DV 2018
3A (ATT-1)
3B
3C
3D
ATT-4
Anne Arundel
Davidsonville
83
68.9
67.9
69.7
69.1
67.6
67.6
Baltimore
Padonia
79
68.2
66.7
69.2
68.4
66.3
66.5
Baltimore
Essex
80.7
69.4
68.3
70.1
69.5
68.0
68.1
Calvert
Calvert
79.7
68.8
67.6
70.4
68.9
67.4
66.4
Carroll
South Carroll
76.3
66.8
65.2
68.7
67.6
64.7
64.8
Cecil
Fair Hill
83
70.0
68.4
71.4
70.4
68.0
68.2
Calvert
S.Maryland
79
66.9
65.7
68.7
67.2
65.4
64.2
Cambridge
Blackwater
75
65.1
64.2
66.0
65.2
63.9
64.0
Frederick
Frederick Airport
76.3
66.9
65.3
68.8
67.7
64.7
64.7
Garrett
Piney Run
72
59.7
58.4
61.5
60.3
55.5
58.4
Harford
Edgewood
90
76.0
74.8
77.0
76.2
74.4
74.5
Harford
Aldino
79.3
66.1
64.8
67.2
66.3
64.5
64.6
Kent
Millington
78.7
65.7
64.3
67.0
66.1
63.9
64.1
Montgomery
Rockville
75.7
64.5
63.6
65.5
64.8
63.2
63.1
PG
HU-Beltsville
79
65.8
64.9
66.7
66.1
64.6
64.5
PG
PG
Equest
.
82.3
68.6
67.5
69.6
68.8
67.2
67.0
PG
Beltsville
80
66.4
65.4
67.2
66.6
65.1
65.1
Washington
Hagerstown
72.7
63.1
61.8
65.0
64.0
61.0
61.7
Baltimore
City
Furley
73.7
63.5
62.5
64.2
63.7
62.3
62.3Slide11
11
County
Site
DV 2011DV 2018
3A (ATT-1)
3B
3C
3D
ATT-4
Anne Arundel
Davidsonville
83
70.1
68.9
71.1
70.2
68.6
68.4
Baltimore
Padonia
79
69.4
67.7
70.6
69.7
67.4
67.4
Baltimore
Essex
80.7
68.8
67.4
69.6
68.9
67.1
67.2
Calvert
Calvert
79.7
70.7
69.0
72.5
70.868.867.6 CarrollSouth Carroll76.368.065.970.469.065.265.4CecilFair Hill 8370.067.972.070.767.467.7Calvert S.Maryland7967.666.270.167.866.063.6CambridgeBlackwater7566.865.967.666.965.665.7FrederickFrederick Airport76.367.965.970.268.865.265.2GarrettPiney Run7259.758.161.760.554.858.1Harford Edgewood9076.474.677.676.674.274.3Harford Aldino79.366.564.768.066.864.364.4Kent Millington78.766.264.468.066.863.964.1 MontgomeryRockville75.764.063.165.164.462.762.5PG HU-Beltsville7966.165.267.166.364.964.8PG PG Equest.82.368.867.669.969.067.367.0PG Beltsville8067.565.868.467.565.665.5Washington Hagerstown72.764.262.466.865.661.462.3Baltimore CityFurley73.762.961.663.763.161.461.5
All model results for July only (2018): Beta ModelSlide12
Modeling Preliminary EPA Problem Areas
County, State
AQS #
Design Value 2011
DV 2018
DV S3A
DV S3B
DV S3C
DV S3D
DV ATT4
Attainment Problems - 2018
Harford,
MD
240251001
90.0
76.3
74.6
77.6
76.6
74.2
74.3
Fairfield, CT
090013007
84.3
73.0
72.5
73.3
73.1
72.4
72.5
Fairfield, CT
090019003
83.7
75.6
75.2
75.9
75.7
75.2
75.2
Suffolk, NY
361030002
83.3
73.673.173.873.673.173.1Maintenance Problems - 2018Fairfield, CT09001001780.372.372.0
72.5
72.4
71.971.9New Haven, CT09009900285.774.874.575.074.874.474.4Camden, NJ34007100182.772.471.173.572.970.971.1Gloucester, NJ34015000284.373.872.375.374.472.072.1Richmond, NY36085006781.373.772.974.173.772.872.9Philadelphia, PA42101002483.372.370.773.772.870.370.6
12Slide13
We have measured
NOx in the atmosphere with airplanes, other aloft monitors and ground-level monitors for over 40 years
From that work, we have been able to correlate the ozone production efficiency with
NOx in the atmosphere … i.e. how much ozone is created with different levels of
NOx
?
13
<−
Cleaner
[NO
x
] (ppb)
More polluted −>
Net Ozone Production per Unit of
NOx
(ppb O
3
/ppb
NO
x
)
Schematic diagram of ozone production efficiency for the eastern US. - Getting over the hump
Remote South Pacific
Ozone Destruction
I95/I695
Roadside
Baltimore
a
round 1980
Baltimore
around 2010
Rural Maryland
around 1980
Rural Maryland
around 2010
Have We Reached a Tipping Point with
NO
x
?
Because of the
NOx
reductions since 2004, we believe, that in the last five years we have reached a tipping point in the Mid-Atlantic atmosphere, where a ton of
NOx reductions made in 2015 will generate significantly more ozone reduction then it did just 10 years agoEven though NOx emissions and NOx concentrations had begun to go down, the atmospheric NOx levels were still high enough so that the chemistry to create ozone was still working against us. Ozone reductions were difficult to achieve.In the last 5 years, it appears that the NOx concentrations in the atmosphere have reached a tipping point. Smaller NOx decreases now appear to create greater ozone reductions. The chemistry is working better for us.Slide14
Conclusion
‘Beta chemistry’ can improve CMAQ simulations of ozone precursors, and predict slightly higher ozone.Difficulty to stay the attainment. Bigger improvements from power plant emissions.Ozone production efficiency: After
reaching the tipping point, NO
x emissions controlled in 2015 lead to greater improvements of ozone pollution.14Slide15
Extra Slides
15Slide16
16
New DV Guidance Find maximum baseline O3 of 3x3 grid for each cell.
Max. O
3 for future case at same point as baseline case
Calculate mean for 10 highest days above 75 ppb
(5 day, 60ppb min)Slide17
17
CMAQ Model Beta Scenarios (2011 platform)Scenario 3b – Scenario 3a
3a: best case
3b: worst caseSlide18
18
CMAQ Model Beta Scenarios (2011)Scenario 3c – Scenario 3a
3a: best case3c: actual caseSlide19
19
CMAQ Model Beta Scenarios (2011)Scenario 3d – Scenario 3a
3a: best case3d: ideal case
The color bar is different!Slide20
Notes
On Ozone Production Efficiency DiagramThis shows net ozone production per unit NOx. It peaks somewhere around 1 ppb NOx; ozone is still made faster at higher NOx concentrations, but the rate of increase tails off.Boxes fly in to show where urban Baltimore was in the ~1980 and in 2010. Ozone improved between 1980 and 2010, but slowly because as NOx concentrations fell the efficiency increased. We moved left but also up.
Now the city is getting over the hump and rural areas (next two fly ins) are definitely in the range where small improvements in NOx emissions can mean big improvements in O3.
The other side of that coin is any backsliding will bring big problems.The last fly-ins are to show that under extremely high concentrations ozone is all tied up as NO2 – but the NO2 is toxic. At the other extreme, natural
processes
destroy ozone but American cities will probably never be as clean as tropical islands.