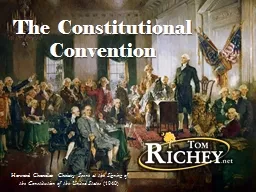
Howard Chandler Christy Scene at the Signing of the Constitution of the United States 1940 USHC 14 Analyze how dissatisfactions with the government under the Articles of Confederation were addressed with the writing of the Constitution of 1787 including the debates and compromises reac ID: 644212
Download Presentation The PPT/PDF document "The Constitutional Convention" is the property of its rightful owner. Permission is granted to download and print the materials on this web site for personal, non-commercial use only, and to display it on your personal computer provided you do not modify the materials and that you retain all copyright notices contained in the materials. By downloading content from our website, you accept the terms of this agreement.
Slide1
The Constitutional Convention
Howard Chandler
Christy,
Scene at the Signing of the Constitution of the United States
(1940)Slide2
USHC 1.4
Analyze how dissatisfactions with the government under the Articles of Confederation were addressed with the writing of the Constitution of 1787, including the debates and compromises reached at the Philadelphia Convention and the ratification of the Constitution. Slide3
20
Elite Consensus:
The Articles aren’t working.
Photo by
NessterSlide4
Bad Economy
Image by
Beyond My KenSlide5
Rebellions Slide6
TRADE BARRIERS
Photo by Eddy
Van 3000Slide7
The Annapolis Convention
1786
Photo by Ken
LundSlide8
Let’s meet again.
Photo by Ken
LundSlide9
Let’s meet again.
Next year.
Photo by Ken
LundSlide10
Let’s meet again.
Next year.
With more people.
Photo by Ken
LundSlide11
The Philadelphia Convention
1787Slide12
The Philadelphia Convention
1787
STATED PURPOSE:
Amend the ArticlesSlide13
LOL
They have no idea.Slide14
FROM SCRATCH
Photo by Mike
McCuneSlide15
LARGE STATE
State icons designed
by Ted
Grajeda from the Noun Project
small state
Slave State
Free StateSlide16
Statistics From the 1790 Census
State Population
Percentage of Total
Regional P
opulation
Number of Slaves
Percentage of Population
New Hampshire
141,885
4%
158
0%
Massachusetts
378,787
10%
0
0%
Connecticut
237,946
7%
2,759
1%
Rhode Island
68,825
2%
152
0%
NEW ENGLAND
23%
827,443
New Jersey
184,139
5%
11,423
6%
New York
340,120
9%
21,324
6%
Pennsylvania
434,373
12%
3,737
1%
MIDDLE STATES
958,632
NORTH
OF
MASON/DIXON
49%
1,786,075
Slaves (North)
39,853
6%
Delaware
59,096
2%8,88715%Maryland319,7289%103,03632%Virginia747,61020%293,42739%North Carolina393,75111%100,57226%South Carolina249,0737%107,09443%Georgia82,5482%29,26435%SOUTHERN STATES51%1,851,806Slaves (South)642,28094%TOTAL POPULATION3,637,881SLAVE POPULATION681,83315%
Sources:
http
://
www.infoplease.com/ipa/A0004986.html
http://manyeyes.alphaworks.ibm.com/manyeyes/visualizations/slave-population-of-us-states-and-te Slide17
LEGISLATIVE BRANCHSlide18
new
jersey plan
VIRGINIA
PLAN
View Census Data
JAMES
MADISON
BI
CAMERAL
Legislature
Based on
POPULATION
william
paterson
uni
cameral
legislature
one vote
per stateSlide19
How do we share?
Photo by
Vegan Feast
CateringSlide20
Hamilton’s Plan
f
or a
national
government
State SovereigntySlide21
The convention heard
Hamilton’s plan
, but did not debate it.Slide22
“GREAT COMPROMISE”
Roger Sherman (CT)
View Census Data
House of
Representatives
Lower House
Senate
Upper House
Based on
POPULATION
Two Votes Per State
Elected by Voters
(DIRECT)
Appointed by
State Legislatures
(INDIRECT)Slide23
QUESTION:
Should slaves
be counted for purposes of representation in the lower house of Congress?Consider the interests of your assigned state when answering.
View Census DataSlide24
The “Three-Fifths” Compromise
FOR THE SOUTH
FOR THE NORTHFor representation in Congress, slavescounted as 3/5 of a person.
After 20 years, Congress has the power
to regulate
(or outlaw) the
international slave trade.
3/5Slide25
The “Three-Fifths” Compromise
FOR THE SOUTH
FOR THE NORTHFor representation in Congress, slavescounted as 3/5 of a person.
After 20 years, Congress has the power
to regulate
(or outlaw) the
international slave trade.
3/5Slide26
EXECUTIVE BRANCHSlide27Slide28
ELECTORALSlide29
ELECTORAL
COLLEGE
Photo by Liz
LawleySlide30
ELECTORAL
COLLEGE
Photo by
Liz
Lawley
Each
state
will send
electors
to cast votes for President.Slide31
ELECTORAL
COLLEGE
Photo by
Liz
Lawley
ELECTORS =
Senators
+
RepsSlide32
The LARGE STATES get more electoral votes.
Photo by Tony AlterSlide33
The small states get a head start.
Photo by
greg westfallSlide34
2012 Presidential ElectionSlide35
Map Credit:
Kelvinsong
2012 Electoral VoteSlide36
JUDICIAL BRANCHSlide37Slide38
AMENDING THE CONSTITUTION
2 3
3 4
Photo by Martin
Falbisoner
Map by
ZooFariSlide39
CONGRESS
PROPOSES
Photo by Andrew HigginsSlide40
Photo by Andrew Higgins
THE STATES
RATIFY
OR REJECTSlide41
Articles
Constitution
A COMPARISON
Sovereignty?
Foreign
Relations?
Taxation?
Commerce
& Trade?
Representation?
To Legislate?
To Amend?
States
Federal
States
States
1 Vote Per State
2/3
UNANIMOUS
SHARED
Federal
Federal & State
Federal
(
Interstate
)
State
(
Intrastate
)
Proportional
(
House
)
Two Each
(
Senate
)
Concurrent Majority + President’s Signature
2/3 + 3/4Slide42