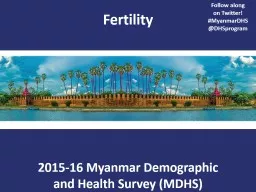
PDF-Trend of Birth rate Death rate Infant Mortality rate Total Fertility rate Sex ratio at

Author : trish-goza | Published Date : 2015-02-23

0 180 200 220 240 260 280 300 2007 2008 2009 2010 2011 2012 Birth rate Total Rural Urban 62 64 66 68 70 72 74 76 78 80 82 2007 2008 2009 2010 2011 2012 Death rate

Presentation Embed Code

Download Presentation

Download Presentation The PPT/PDF document "Trend of Birth rate Death rate Infant Mo..." is the property of its rightful owner. Permission is granted to download and print the materials on this website for personal, non-commercial use only, and to display it on your personal computer provided you do not modify the materials and that you retain all copyright notices contained in the materials. By downloading content from our website, you accept the terms of this agreement.

Trend of Birth rate Death rate Infant Mortality rate Total Fertility rate Sex ratio at: Transcript


0 180 200 220 240 260 280 300 2007 2008 2009 2010 2011 2012 Birth rate Total Rural Urban 62 64 66 68 70 72 74 76 78 80 82 2007 2008 2009 2010 2011 2012 Death rate Total Male Female 40 45 50 55 60 2007 2008 2009 2010 2011 2012 Infant mortality rate To. Ashley H. Schempf, PhD. Office of Epidemiology, Policy and Evaluation. Maternal and Child Health Bureau. Health Resources and Services Administration, DHHS. Outline. Basic epidemiology. Background. Data from 2004-2006 Period Linked Live Birth / Infant Death File. Birth Place Married Place Death Place Birth Place Death Place Birth Death Birth Place Married Place Death Place Birth Place Married Place Death Place Birth Place Death Place Birth Birth Birth Place De Department of Family and Community Medicine. Community Medicine Course. Faculty of Medicine/ The University of Jordan. Lecture Objectives. Present the need for population studies ( demography) . Introduce the components of population dynamics ( births, deaths, migration). #. MyanmarDHS. @. DHSprogram. © 2007 Min . Zaw. , Courtesy of . Photoshare. Levels and differentials. Determinants of fertility. Fertility preferences and ideal family size. 2.3. At current fertility levels, . FROM MICRO TO MACRO: ADDRESSING INFANT MORTALITY HOLISTICALLY. Mission. To address and improve the systemic and community structures that lead to poor birth outcomes through . c. ulture, . e. ducation, . L. evels . & . Cause-of-Death Data. These materials have been developed by the National Center for Health Statistics, International Statistics Program, Hyattsville, Md., as part of the CDC Global Program for Civil Registration and Vital Statistics Improvement.. Marian MacDorman and T.J. Mathews. Division of Vital . Statistics. National Center for Health Statistics . Acknowledgements: . Sam Notzon and Jennifer Madans, NCHS. International Health Rankings: A Look Behind the Numbers . Introduction. The Brass method for estimating child mortality. Variants of the Brass method. Indirect estimation methods. Methods . for evaluating data quality . allow to correct the data. Can calculate corrected mortality indicators based on adjusted data. Online course on data analysis and report writing for civil registration based vital statistics . 12 July to 10 September 2021. 1. Patterns of child-bearing are different by age. These patterns have many drivers: . the 1940s, though the environment that triggered tapering off of fertility varied considerably from the setting of human development in Kerala to economic development in Punjab (Das Gupta 1997). Howev Mississippi State Department of Health2019& 2020Infant Mortality Report Infant Mortality Report Table of ContentsAcknowledgmentsSuggested CitationExecutive SummaryBackgroundKey Findings Key Recommend 1 1 Since 2000 the Government has made tackling health, social and educational inequalities a public service priority by setting public service agreement (PSA) targets which focus on these areas. Online course on data analysis and report writing for civil registration based vital statistics . 12 July to 10 September 2021. 1. Introduction. Mortality rate:. A measure of the . frequency. of occurrence of death in a defined population during a . Julia Hellstrand. BNU Workshop 2018. Total fertility rate at an all-time low. Statistics. Finland, 27.4.2018. Finland’s birth rate plummets to its lowest level in nearly 150 years. Number of births could fall below 50,000 mark for first time since famine in 1866-1868.

Download Document

Here is the link to download the presentation.
"Trend of Birth rate Death rate Infant Mortality rate Total Fertility rate Sex ratio at"The content belongs to its owner. You may download and print it for personal use, without modification, and keep all copyright notices. By downloading, you agree to these terms.

Related Documents