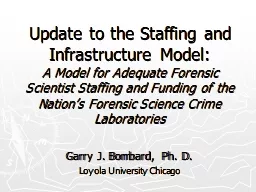
Model A Model for Adequate Forensic Scientist Staffing and Funding of the Nations Forensic Science Crime Laboratories Garry J Bombard Ph D Loyola University Chicago Why the Model Public Policy Analyses Viewpoint ID: 460046
Download Presentation The PPT/PDF document "Update to the Staffing and Infrastructur..." is the property of its rightful owner. Permission is granted to download and print the materials on this web site for personal, non-commercial use only, and to display it on your personal computer provided you do not modify the materials and that you retain all copyright notices contained in the materials. By downloading content from our website, you accept the terms of this agreement.
Slide1
Update to the Staffing and Infrastructure Model:A Model for Adequate Forensic Scientist Staffing and Funding of the Nation’s Forensic Science Crime Laboratories
Garry J. Bombard, Ph. D.
Loyola University ChicagoSlide2
Why the Model? Public Policy Analyses Viewpoint Lack of Data
Forensic Laboratory Viewpoint
Lack of Data
Understaffed, Under Budgeted, More with Less
“Field of Dreams” Syndrome
Current National TrendsSlide3
Why the Model?Window of Opportunity is Starting to OpenS.2177: Needs Analysis
We Need to Frame
and Justify Our
Needs
Previous Demonstration Projects
Current Research/Demonstration Projects
Future Research/Demonstration ProjectsSlide4
Goal and Objectives of ModelCreate foundational data for determining the needs and costs for the forensic science
community.
M
odel
should be dynamic and robust, yet versatile and flexible.
T
he
model should incorporate the realistic needs of the forensic science
community.
The
model should provide the quantitative data for various policy analyses.Slide5
History of ModelCreated in 2004
ASCLD Poster for Refinement (2005)
ASCLD Poster Utilizing Model in DNA Burglary Demonstration Project (2007)
AAFS Annual Meeting (2008)
Midwest Laboratory Director’s Meeting (2008)
Updated Model (2012-2015)Slide6
Overview of ModelProvides Two Staffing Levels
Minimal
Ideal
Provides Two Sets of Data
Infrastructure and New Headcount (Needs and Costs)
Annual CostsSlide7
Model ImprovementsExpands Number of Sections: Four (4) Biggest to Ten (10) including DNA Database
Sophisticated Modeling Program vs Manual Evaluations
Better
Data Available Slide8
Main Data Sources
FBI Uniform Crime Reports (1993 – 2013)
Survey of Publicly Funded Crime Labs (2009): Published and Raw Data Analyses
Foresight (2013)
Crime Lab Design (Ken Mohr)Slide9
Model Examples: Crimes
Reported Crimes: 1993-2013
Crimes
Biology/DNA
Calculated to 2017
Cleared
%
Cases
2017
Cleared Rate
2017
Total Homicides
11,556
Homicides: Firearms
7,921
100.0%
7,921
100.00
7,921
Homicides: Knives/Cutting
1,160
100.0%
1,160
100.00
1,160
Homicides: Blunt Objects
345
100.0%
345
100.00
345
Homicides: Unidentified weapons and personal
1,539
100.0%
1,539
75.00
1,154
Forcible Rape
74,521
100.0%
74,521
100.00
74,521Slide10
Model Examples: Crimes
Reported Crimes: 1993-2013
Crimes
Biology/DNA
Calculated to 2017
Cleared
%
Cases
2017
Cleared Rate
2017
Total Homicides
11,556
Homicides: Firearms
7,921
63.8%
5,054
100.00
5,054
Homicides: Knives/Cutting
1,160
63.8%
740
100.00
740
Homicides: Blunt Objects
345
63.8%
220
100.00
220
Homicides: Unidentified weapons and personal
1,539
63.8%
982
75.00
736
Forcible Rape
74,521
38.3%
28,542
100.00
28,542Slide11
Model Examples: Cases, Headcount, and Costs
DNA Database: Cases and Headcount Projections
DNA Database Costs
Arrests to Cases
Cost per Case (Mean from Foresight)
$ 71.19
Total Database Cases
10,453,725
Infrastructure
Additional Headcount Requirements
Total New Database Cases
5,226,863
Buildings
Equipment
$ 22,886,370.68
Headcount Projections
Training (Personnel and Commodities)
$ 307,364,288.48
Cases Worked per FS (2009)
2523
Median
Foresight:
2523
% Capital Expense as a proportion of Total Expense (Mean: Foresight)
6.93%
Forensic Scientists Required
2,072
Total Capital Expenses
$ 22,886,370.68
Less Current FSs (2009)
233
New Headcount
1,839
New Headcount cases worked
4,639,003.50
New FS Headcount
1,839
Total Headcount costs
$ 330,250,659.17
New Technical Support Headcount (9% [1])
165
Annual Costs
Total Cases x cost/ case
$ 744,200,682.75
New Managerial Headcount (14% [1])
257
Upper Management (4:1 ratio of Middle Mgt)
64
New Clerical Headcount (9% [1])
165
[1]: CLS 2009; pg 9Slide12
Model Examples: One Time Costs
Forensic Biology
DNA
DNA Database
New Headcount
#'s
Salaries
#'s
Salaries
#'s
Salaries
Forensic Scientists
11,033
17,192
1,839
Technical Support
993
$47,754,809
1,547
$74,414,137
165
$7,958,369
Middle Managers
1,545
$144,013,906
2,407
$224,410,289
257
$24,000,007
Upper Managers
386
$40,398,960
602
$62,951,854
64
$6,732,512
Clerical Support
993
$47,754,809
1,152
$55,397,191
165
$7,958,369
14,950
22,900
2,491
Infrastructure (One Time Cost)
Building
Forensic Scientists
$10,192,025,501
$15,881,767,605
$1,698,507,419
Managerial
$895,615,117
$1,395,596,112
$149,254,819
Techincal/Clerical Support
$555,859,933
$755,493,711
$92,634,405
Equipment
$71,459,939
$297,666,563
$22,886,371
Training (Personnel and Commodities)
$1,197,810,735
$2,381,600,432
$307,364,288
Totals
$13,192,693,710
$21,129,297,893
$2,317,296,559Slide13
Model Examples: Annual Costs
Biology Screening
DNA
DNA Database
Headcount
#'s
Salaries
#'s
Salaries
#'s
Salaries
Forensic Scientists
11,472
18,509
2,072
Technical Support
1,032
$49,654,930
1,666
$80,114,498
186
$8,966,861
Managerial
1,606
$149,744,088
2,591
$241,600,836
290
$27,041,311
Upper Management
402
$42,006,398
648
$67,774,167
73
$7,585,662
Clerical Support
1,032
$49,654,930
1,666
$80,114,498
186
$8,966,861
Total Staff
15,545
25,080
2,807
Annual Expenses
$1,319,773,801
$ 2,884,507,433
$ 744,200,683
Totals
$1,610,834,146
$3,354,111,432
$796,761,379Slide14
Model Calculations
Minimal Staffing (Clearance or Arrest Rate): All Crimes
New Headcount
Costs
For Bio
3,723
$ 3,285,119,242
DNA
5,068
$ 4,676,097,915
DNA DB
2,491
$ 2,317,296,559
LFP
1,833
$ 1,602,890,969
FA TM
1,175
$ 1,120,790,667
Drug
1,605
$ 1,428,639,738
Trace
3,345
$ 3,468,048,745
Impression
4,476
$ 4,245,160,754
Tox13 $ 142,856,875 QD3,249 $ 3,066,633,368 Total26,97825,353,534,832
Minimal Staffing (Clearance or Arrest Rate): All CrimesNew HeadcountCostsFor Bio3,723 $ 3,285,119,242 DNA5,068 $ 4,676,097,915 DNA DB2,491 $ 2,317,296,559 LFP1,833 $ 1,602,890,969 FA TM1,175 $ 1,120,790,667 Drug1,605 $ 1,428,639,738 Trace3,345 $ 3,468,048,745 Impression4,476 $ 4,245,160,754 Tox13 $ 142,856,875 QD3,249 $ 3,066,633,368 Total26,97825,353,534,832
Ideal Staffing: All CrimesNew HeadcountCostsFor Bio14,950 $ 13,192,693,710 DNA22,900 $ 21,129,297,893 DNA DB2,491 $ 2,317,296,559 LFP9,592 $ 8,388,040,398 FA TM8,355 $ 7,968,621,227 Drug1,822 $ 1,622,589,040 Trace24,394 $ 25,719,907,297 Impression32,661 $ 30,976,238,671 Tox1,132 $ 1,186,837,729 QD8,019 $ 7,568,856,564 Total126,317120,070,379,088
2013 UCR: 13,051 Police Agencies with 902,410 FTEs in LE: 626,942 Sworn; 275,468 CivilianSlide15
Further Improvements
Current Case Distribution to Sections and within
Sections
Better Foresight Data (Increase
the 83 Current C
ontributors)
Better Building Projections (space and cost) through Crime Lab Design’s SABER ProgramSlide16
Acknowledgements
Paul Speaker, Foresight Project at WVU
Matt
Durose
, BJS
Ken Mohr, Crime Lab Design