/
1 Quality of Service (QoS), Quality of Experience (QoE) and Performance 1 Quality of Service (QoS), Quality of Experience (QoE) and Performance

1 Quality of Service (QoS), Quality of Experience (QoE) and Performance - PowerPoint Presentation

unisoftsm
unisoftsm . @unisoftsm
Follow
350 views
Uploaded On 2020-06-17

1 Quality of Service (QoS), Quality of Experience (QoE) and Performance - PPT Presentation

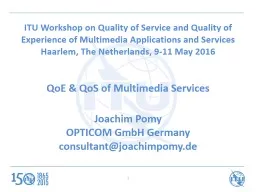
Joachim Pomy Consultantjoachimpomyde OPTICOM Germany ITU Workshop on Performance Quality of Service and Quality of Experience of Emerging Networks and Services Athens Greece 78 September 2015 ID: 780145

transmission quality network qos quality transmission qos network service users planning sample itu networks model performance 100 rec effects

Share:

Link:

Embed:

Download Presentation from below link

Download The PPT/PDF document "1 Quality of Service (QoS), Quality of E..." is the property of its rightful owner. Permission is granted to download and print the materials on this web site for personal, non-commercial use only, and to display it on your personal computer provided you do not modify the materials and that you retain all copyright notices contained in the materials. By downloading content from our website, you accept the terms of this agreement.


Presentation Transcript

Slide1

1

Quality of Service (QoS), Quality of Experience (QoE) and Performance

Joachim PomyConsultant@joachimpomy.deOPTICOM, Germany

ITU Workshop on “Performance, Quality of Service and Quality of Experience ofEmerging Networks and Services”(Athens, Greece 7-8 September 2015)

Slide2

Where it All Begins:Real Communication Situation

2

Slide3

... and where End-to-End Quality comes to Play:

Employing a Telecommunication System3

... can you hear me ?

... I want to speak now !

Slide4

Definitions start here: ITU-T Rec. E.800

Quality of Service

Service Support PerformanceService Operability PerformanceServeabilityService Security Performance

4Network PerformanceCharging PerformanceProvisioning PerformanceAdministration PerformanceAvailability PerformanceTransmission Performance

Network Performance (NP)Pre-requisite to Quality of Service (QoS)Not directly visible to the userQuality of Service (QoS)Performance of the Service offered to the UserSome QoS Aspects directly perceivable, some indirectly

Slide5

Four Viewpoints of QoS

Consistent Approach to QoSWell-defined and Relevant (e.g. Customer-affecting)

Used to Plan and Deploy NetworksIncludes Monitoring Service Quality ITU-T Rec. G.1000 defines four Viewpoints of QoSCustomer's QoS RrequirementsService provider's offerings of QoS (or targeted QoS)QoS achieved or deliveredCustomer survey ratings of QoSIdeally there would be 1:1 Correspondence between Delivered QoS and Perceived QoS

5

Slide6

4 Viewpoints of QoS

6

Slide7

ITU-T Rec. G.101

The Transmission Plan

Fundamental principles of transmission planningA good transmission plan is set up in order to deliver to users signals that are at a desirable level and free from objectionable amounts of delay, echo and distortion Has to take into account transmission parameters and impairments, different network configurations and elements Specific transmission plans have to be set up in order to take care of specific transmission impairments and conditions fortraditional narrow-band telephone networks

mobile networkspacket switched networksmultimedia applications 7

Slide8

Traditional Transmission Planning

8

Slide9

Transmission Planning Today

ITU-T Rec. G.108: Transmission Planning with the E-ModelTraditional transmission planning methodologies no longer flexible enough to account for new factors

9

Slide10

Transmission Planning Challenges - 1

Multinational networks require planning which takes into account regional differences in loss plan requirements and inter-network transmission plans

Due to liberalization of the telecommunication markets (e.g. in Europe) there are no longer laid down ranges of values for transmission parameters by regulationThe changing scenario in the public network operator domain is impacting transmission performance10

Slide11

Transmission Planning Challenges - 2

G.108 is applicable to the use of new technology within the networks, including wireless (cordless or mobile), IP transmission etc.

G.108 provides planning methods and contains necessary information and tools which will enable the planner to design the network transmission plan Guidelines and planning examples are based on the use of the E-Model11

Slide12

E-Model - ITU-T Rec. G.107

Computational model for use in transmission planning Assessing the combined effects of variations in several transmission parameters that affect conversational quality of 3.1 kHz handset telephony

Covers also packet lossFor many combinations of high importance to transmission planners, the E-model can be used with confidenceCaution must be exercised when using the E-model for some conditions 12

Slide13

Reference connection of the E-model

13

Slide14

Effects of Talker Echo in the Presence of Delay

14

50

60

70

80

90

100

0

50

100

150

200

250

300

350

400

450

500

Mouth-to-Ear-Delay / ms

E-Model Rating R

no Talker Echo

TELR=65 dB

TELR=55 dB

TELR=45 dB

TELR=35 dB

TELR=25 dB

Slide15

Categories of Communication Quality

in Terms of Users' Satisfaction Classes

15

Voice Quality Continuum

Slide16

Example with Delay as Impairment

16

Slide17

QoE Definition

ITU-T Rec. G.100 / P.10 definesQuality of Experience (QoE): The overall acceptability of an application or service, as perceived subjectively by the end-user.

NOTE 1 – Quality of experience includes the complete end-to-end system effects (client, terminal, network, services infrastructure, etc.).NOTE 2 – Overall acceptability may be influenced by user expectations and context.17

under review !

Slide18

QoE Implications

QoE includes „everything“Many aspects out of control of OperatorsIncludes Terminal Aspects

Conext and Environment of the UserProper QoS and NPTechnical pre-requisitesFor achieving desired QoE 18

Slide19

Users‘

Perception of Speech Quality

19Speech(Transmission) Quality

...

...

Sound Quality &

Naturalness

Intellegibility

Listening & Talking

Efforts

Conversational

Efforts

Doubletalk

Capability

Expectation

Backgroundnoise

Transmission

Speech

Charakteristic

Individual

Perception

Network

Conditions

Environmental

Conditions

Slide20

Motivation for Multimedia Quality - 1

Quality as perceived by the User A Promotional Factor for the Market

User compares Quality of New Telecommunication ServicesWith Quality experienced in the PastWith other Telecommunication Service offersWith Quality experienced for Entertainment Services 20

Slide21

Motivation for Multimedia Quality

Individual Quality ThresholdUsers try new Service only few times ( ~ 3x … 5x )If Quality below Indivdual Threshold Users give up

e.g. Download of a Website takes too long User remembers this experienceWill try a few times and conclude this as Static Effect:"This website is not useable - let's try the Offer of the Competitor…" 21

Slide22

Diffusion, Transmission Qualityand Expectation for an Innovation

22

Diffusion Theory generally accepted for describing Consumer Behaviour on the Introduction of an Innovation or New ServiceNumber of Users develops in S‑shaped Curve5 Classes of Users:(1) Innovators(2) Early Adaptors(3) Early Majority(4) Late Majority(5) LaggardsTrade-off between Transmission Quality and New Functionality

Slide23

Changes in Users' Behaviour - 1

Users tend to be much more reluctant to accept lower qualityThis is quoted frequently

True for some sorts of social callsDefinitively NOT true for sensible business callsDoes it help network operators when defining QoS for their network ?High quality has to be provided when demanded by business customers or other sensible clientsBut the distribution of quality acceptance over time and areas cannot be matched with the occurrence of impairments in the networkNot really useful for designing networks

2323

Slide24

Changes in Users' Behaviour - 2

Users switch between different communication devicesWireline, wireless, PC, PDA etcDepending on place, task, purpose

And depending on QUALITY24

24

Slide25

Key Parameters affecting MM Quality

Media Distortion End-to-End Delay

Echo Effects Information Loss Background Noise Distortion Loss of Synchronization between Media Streams25

Slide26

Example: Lip Sync

26

Slide27

Impairments in packet networks

Distinction between Effects

that occur in the Network andMechanisms in the Terminals that are affected Terminals can be used to correct for the Effects in the Network Remaining Issues are:End-to-End Delay is increased when compensating for other EffectsLoss of Information can be Concealed but Not Recovered

27

Slide28

Impairments in packet networks

28

Slide29

QoS Layers in Mobile

QoS model for mobile has four layers.

First layer is the Network Availabilitydefines QoS rather from the viewpoint of the service provider than the service userSecond layer is the Network Accessfrom user's point of view basic requirement for all the other QoS aspects and parametersThird layer contains other QoS aspectsService Access, Service Integrity & Service Retainability

Different services are located in the fourth layerTheir outcome are the QoS parameters as perceived by the user29

Slide30

QoS aspects of Mobile

30

Slide31

POLQA™ - Rec. P.863

The limitations of existing standards that are now addressed by

POLQACDMAChinese 3G TD-SCDMAPOLQA offers immediate, strong support for testing of new wideband 4G/LTE networks delivering HD-quality voice services

Tests carried out during the POLQA evaluation included future technologies such asUnified CommunicationsNext Gen Networks4G/LTEHD Voice, i.e. "wide-band" and "super-wide-band" See POLQA: The Next Generation in Voice Quality Testing http://www.polqa.info31

Slide32

32

Slide33

33

POLQA Introduction - (c) OPTICOM GmbH 2010

33

Performance Validation

The ITU has validated POLQA on:

Languages included in the POLQA validation:

German

Swiss German

Italian

,

Japanese

,

Swedish

American English and British English

Chinese (Mandarin),

Czech,

Dutch,

French,

47000

file

pairs

across

64

subjective

experiments

Slide34

Confidence

Intervalls for Different Sample Sizes (1)

Effect of different sample sizes in a measurement campaignbased on the Pearson-Clopper formulas for calculation of confidence intervalsvalid in a generic way and even for small sample sizesfor higher sample numbers, the calculation of confidence intervals based on the approximation of a normal distribution can be applied

Three different graphs are depicted: Sample sizes in the range:between 100 and 1 100 samples;between 1 100 and 2 100 samples; andbetween 1 000 and 11 000 samples.34

Slide35

Confidence

Intervalls for Different Sample Sizes (2)

35

Slide36

Confidence

Intervalls for Different Sample Sizes (3)

36

Slide37

Confidence

Intervalls for Different Sample Sizes (4)

37

Slide38

KPIs based on Network Counters

Vendor specific = network internal KPIs

different strategieshow to count network eventswhich events are included in which counter(s)Requires knowledge of specific systemspecialists with detailed system knowledgetesting the countersdocumentation may be faulty

approach to counter change with system updateMobile operators struggling with thismost operator live in a multi vendor environmentcounters from different vendors cannot be directly comparedrequires continous attention and a strategy38

Slide39

KPIs from Users' Perspective = KQIs

Key Quality Indicators (KQIs) = external indicatorscan be assessed in the FieldFor Monitoring, Regulation etc.

a subset can be selectedapplicable across all vendors & operatorsnot limited to mobile, but also good for broadband 39

Slide40

KPIs versus KQIs

Sometimes confused

KPIs = internal indicatorspart of network performancebased on network countersessential for operation, maintenance, business modelcould be reported, audited etc.however, meaningless when out of contextKQIs

= external indicatorsbasis for QoS assessment as perceived by the uservendor independantoperator independantideal to compare different operators on a statistical basiscannot be reported from the system itselfrequires some kind of field testing, drive, walk etc.40

Slide41

Any questions ?

41

Contact:

Consultant@joachimpomy.de