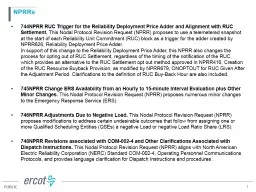
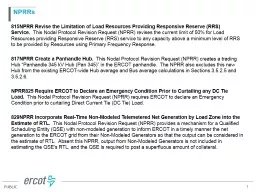
/
NPRR 933 Reporting of Demand Response by Retail electric Providers and Non-Opt-In NPRR 933 Reporting of Demand Response by Retail electric Providers and Non-Opt-In

NPRR 933 Reporting of Demand Response by Retail electric Providers and Non-Opt-In - PowerPoint Presentation

victoria
victoria . @victoria
Follow
64 views
Uploaded On 2024-01-13

NPRR 933 Reporting of Demand Response by Retail electric Providers and Non-Opt-In - PPT Presentation

RMS Meeting June 4 2019 Reporting for 2019 July Workshop Discuss data submittal survey questions other September 30 2019 Proposed snapshot date may move to earlier in the month ID: 1040806

response reps reporting participation reps response participation reporting demand ercot date price high days analysis year snapshot rep submission

Share:

Link:

Embed:

Download Presentation from below link

Download Presentation The PPT/PDF document "NPRR 933 Reporting of Demand Response by..." is the property of its rightful owner. Permission is granted to download and print the materials on this web site for personal, non-commercial use only, and to display it on your personal computer provided you do not modify the materials and that you retain all copyright notices contained in the materials. By downloading content from our website, you accept the terms of this agreement.


Presentation Transcript

1. NPRR 933 Reporting of Demand Response by Retail electric Providers and Non-Opt-InRMS Meeting – June 4, 2019

2. Reporting for 2019July WorkshopDiscuss data submittal, survey questions, otherSeptember 30, 2019Proposed snapshot date (may move to earlier in the month)October 1, 2019REPs can start sending files to ERCOTERCOT to provide 2019 event survey to REPs and NOIE LSEsOctober 13, 2019 initial REP file dueOctober 31, 2019Deadline for sending corrections to ERCOT (all errors to be resolved)Survey responses dueNovember 29, 2019ERCOT completes 2019 summer assessment March 31, 20202019 Annual Report of Demand Response due2

3. Purpose of NPRR9333NPRR933 is intended to start the discussion to achieve the objectives of more timely and accurate reporting of demand response in ERCOT.The points presented herein are proposed to help achieve these objectives but ERCOT accepts that other approaches may be acceptable as well.

4. NPRR 933 Objectives4To make annual report of price and demand response in ERCOT available on a more timely basis.Change report filing date to November 30 of the analysis year rather than March 31 of the following year.Would allow inclusion of analysis results in ERCOT’s summer in review filings.Would make timely inputs available for EORM (Economically Optimal Reserve Margin) analysis.Would make timely inputs available for LTSA (Long Term System Assessment) analysis.Would provide the capability to analyze significant high price and demand response events occurring in all months of the year on a timely basis.

5. NPRR 933 Objectives (Continued)5To improve the accuracy of the analysis findings to address:The incidence of high price events.The high churn rate in demand response participation.To document specifics for LSE self-arranged load response reporting associated with §25.505, Reporting Requirements and the Scarcity Pricing Mechanism in the Electric Reliability Council of Texas Power Region.To improve the data quality exchange between ERCOT and REPs.

6. 2018 Reporting Milestones6The 2018 data submission process started on October 1 and took about 3 months.2 Months were required for the ESIID participation submissions.46 REPs submitted 94 files (~10 additional files with format issues).12 REPs – submitted only 1 file (achieved 95% accuracy).34 REPs – needed to submit 2 or more files (76% accuracy for initial submission).16 REPs sent in their first file in November.REP corrections, on average, took 10 business days.ERCOT validations were provided in almost all cases the following day.Final submission accuracy was 98%.REP event survey deadline was Dec 21.15 REPs reported initiating OLC, PR and OTH events.ERCOT analysis and reporting required about 2 months.

7. Customer Churn and High Price Events7Since 2013 demand response participation has been subject to very high rates of churn.Participation growth has averaged 113% per year. On average 57% of the participation continued from prior year report.And on average 36% of the participants in a year discontinued participation the following year.2018 participation was 1.2 million ESIIDs.283,000 ESIIDs already have switched REPs since the Sep 28 snapshot date.737,000 ESIIDs were reported with a program start date more recent than the 2017 snapshot date.This created a participation blind spot starting with the 2017 snapshot date and ending with the reported 2018 program start date.The average blind spot duration was 242 days.

8. Customer Churn and High Price Events8With quarterly surveys:Only 72,000 ESIIDs would have had a blind spot between Sep 30, 2017 and for the Dec 31, 2017 quarterly snapshot date.The average blind spot duration would be 45 days.Number of high price events by month 2013 – 2018Blind spots degrade the accuracy of results by:Understating participation for eventsDecreasing baseline accuracy (failing to exclude days with price response).JanFebMarAprMayJun131114182816JulAugSepOctNovDec15171919134

9. Reporting Requirements for Consideration9Modify NPRR 933 to allow 10 days for REPs to submit corrections (rather than 5 days).For 2018, REPs needed three or less submissions to correct errors.Allowing 10 days would accommodate a 1 month (October) data submission window.ERCOT analysis and report would have 1 month (November). For REP deployed programs (OLC, OTH, PR)Require complete ESIID submission for the September 30 quarterly snapshot .Require complete ESIID submission for the other quarterly snapshots but only if the REP deployed the program.Quarterly ESIID submissions for price response programs (BI, RTP, TOU).

10. Next StepsWork with REPs and NOIE LSEs to address issues for a long term approach to REP/NOIE demand response reportingJuly Workshop 10Questions?