
1 ADVANCED LEVEL OPERATIONAL RISK MANAGEMENT
MY
Published · 52 slides · 0 views
1 / 1

Description
1 ADVANCED LEVEL OPERATIONAL RISK MANAGEMENT Operational Risk Management (ORM) is a logic-based, common-sense approach to making calculated decisions on human, material and environmental factors associated with any type of activity. Its a
Related Topics
Share
Embed code
Download this presentation From Below
"1 ADVANCED LEVEL OPERATIONAL RISK MANAGEMENT" is the property of its rightful owner. Permission is granted to download and print the materials on this website for personal, non-commercial use only, and to display it on your personal computer provided you do not modify the materials and that you retain all copyright notices contained in the materials. By downloading content from our website, you accept the terms of this agreement.
Presentation Transcript
01
1 ADVANCED LEVEL
OPERATIONAL RISK MANAGEMENT<br>
OPERATIONAL RISK MANAGEMENT<br>
02
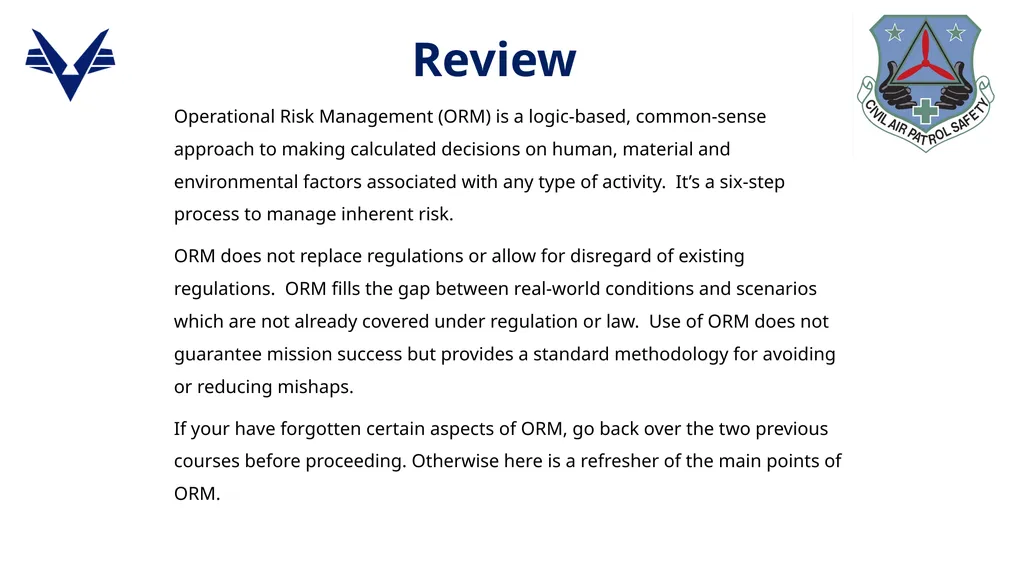
Operational Risk Management (ORM) is a logic-based, common-sense approach to making calculated decisions on human, material and environmental factors associated with any type of activity. It’s a six-step process to manage inherent risk.
ORM does not replace regulations or allow for disregard of existing regulations. ORM fills the gap between real-world conditions and scenarios which are not already covered under regulation or law. Use of ORM does not guarantee mission success but provides a standard methodology for avoiding or reducing mishaps.
If your have forgotten certain aspects of ORM, go back over the two previous courses before proceeding. Otherwise here is a refresher of the main points of ORM. Review<br>
ORM does not replace regulations or allow for disregard of existing regulations. ORM fills the gap between real-world conditions and scenarios which are not already covered under regulation or law. Use of ORM does not guarantee mission success but provides a standard methodology for avoiding or reducing mishaps.
If your have forgotten certain aspects of ORM, go back over the two previous courses before proceeding. Otherwise here is a refresher of the main points of ORM. Review<br>
03
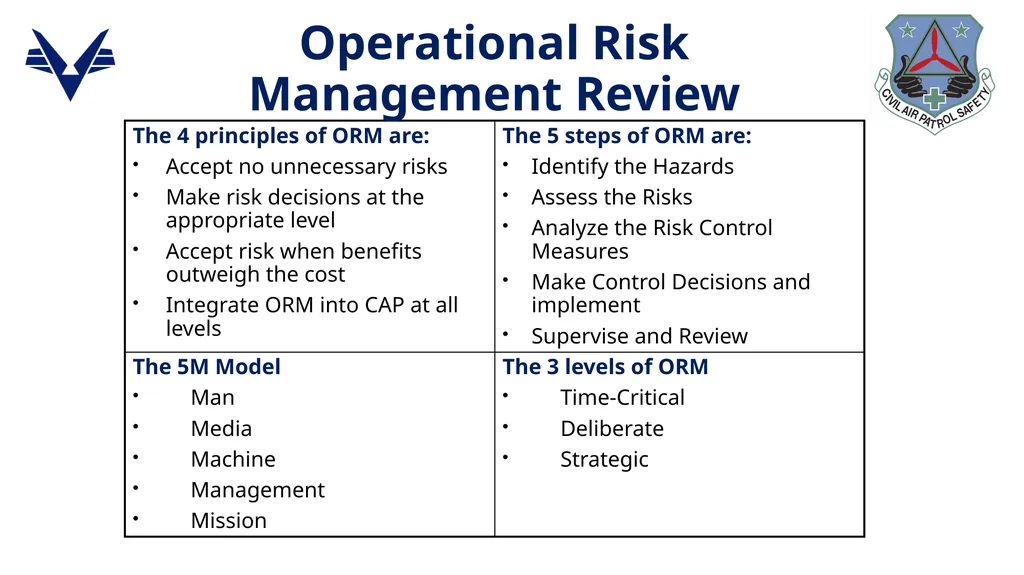
Operational Risk Management Review<br>
04
This advanced course will enhance your success by increasing knowledge of the ORM process.
There are 7 hazard identification tools presented to help you uncover areas of potential hazards as you work through the ORM’s first step.
The ORM’s steps 2-6 will also be explored in greater detail. What’s next?<br>
There are 7 hazard identification tools presented to help you uncover areas of potential hazards as you work through the ORM’s first step.
The ORM’s steps 2-6 will also be explored in greater detail. What’s next?<br>
05
To identify the hazards, you: analyze the mission, list the hazards and list the causes.
Identify the hazards on all of CAP’s assets:
Aircraft
Vehicles
Personnel
Equipment
Identify the hazards to all operational levels:
National
Region
Wing
Group
Squadron & Flights Step 1 – Identify the Hazards<br>
Identify the hazards on all of CAP’s assets:
Aircraft
Vehicles
Personnel
Equipment
Identify the hazards to all operational levels:
National
Region
Wing
Group
Squadron & Flights Step 1 – Identify the Hazards<br>
06
These 7 primary tools are the backbone in identifying hazards in any CAP operation.
The 7 Primary Hazard ID Tools:
Operations Analysis
Preliminary Hazard Analysis
“What If” Tool
Scenario Process Tool
Logic Diagram
Change Analysis
Cause & Effect Tool Step 1 – Identify the Hazards<br>
The 7 Primary Hazard ID Tools:
Operations Analysis
Preliminary Hazard Analysis
“What If” Tool
Scenario Process Tool
Logic Diagram
Change Analysis
Cause & Effect Tool Step 1 – Identify the Hazards<br>
07
Operations Analysis Tool
A big picture look at what is expected to happen. This helps overcome major weakness by focusing on a few intuitively risky areas. Evaluates all elements of operation for potential sources of risk.
Put steps of process on index cards or “sticky” notes so they can rearrange & easily add or eliminate areas or events
Project management software to create simple flow chart
Itemizes chronological a list of major events of an operation and then each event can be broken down into sub-events Step 1 – Identify the Hazards<br>
A big picture look at what is expected to happen. This helps overcome major weakness by focusing on a few intuitively risky areas. Evaluates all elements of operation for potential sources of risk.
Put steps of process on index cards or “sticky” notes so they can rearrange & easily add or eliminate areas or events
Project management software to create simple flow chart
Itemizes chronological a list of major events of an operation and then each event can be broken down into sub-events Step 1 – Identify the Hazards<br>
08
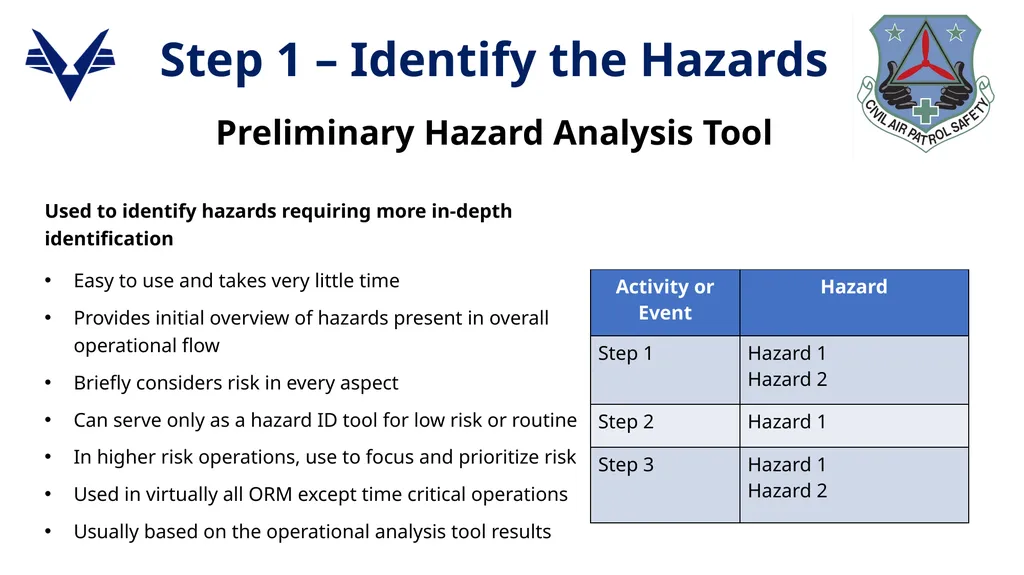
Used to identify hazards requiring more in-depth identification
Easy to use and takes very little time
Provides initial overview of hazards present in overall operational flow
Briefly considers risk in every aspect
Can serve only as a hazard ID tool for low risk or routine
In higher risk operations, use to focus and prioritize risk
Used in virtually all ORM except time critical operations
Usually based on the operational analysis tool results Step 1 – Identify the Hazards Preliminary Hazard Analysis Tool<br>
Easy to use and takes very little time
Provides initial overview of hazards present in overall operational flow
Briefly considers risk in every aspect
Can serve only as a hazard ID tool for low risk or routine
In higher risk operations, use to focus and prioritize risk
Used in virtually all ORM except time critical operations
Usually based on the operational analysis tool results Step 1 – Identify the Hazards Preliminary Hazard Analysis Tool<br>
09
One of the most powerful hazards ID tools. Typically used after the operations analysis and preliminary hazard analysis. Designed to add structure to the intuitive and experiential expertise of operational personnel.
Especially effective in capturing hazard data about failure modes
Can be used on time critical applications
Captures input of operational personnel in brainstorming–like environment. Visualize expected operational flow in chronological order from beginning to end and then select a segment to focus on. Use “Murphy’s Law” to anticipate failures and worse-case scenarios. “What If” Tool Step 1 – Identify the Hazards<br>
Especially effective in capturing hazard data about failure modes
Can be used on time critical applications
Captures input of operational personnel in brainstorming–like environment. Visualize expected operational flow in chronological order from beginning to end and then select a segment to focus on. Use “Murphy’s Law” to anticipate failures and worse-case scenarios. “What If” Tool Step 1 – Identify the Hazards<br>
10
Identify hazards using imagination and visualization to reveal unusual hazards. Construct a mental movie to walk thru events immediately ahead of and of the actual hazard.
Visualize twice; once as they should be, then with worse credible scenarios
Ability to link two or more individual hazards makes it one of the best tools
Entertaining, dynamic and motivating for even the most junior personnel
Best to follow flow of events outlined in the operational analysis tool
Can be only tool needed in time critical events Scenario Process Tool Step 1 – Identify the Hazards<br>
Visualize twice; once as they should be, then with worse credible scenarios
Ability to link two or more individual hazards makes it one of the best tools
Entertaining, dynamic and motivating for even the most junior personnel
Best to follow flow of events outlined in the operational analysis tool
Can be only tool needed in time critical events Scenario Process Tool Step 1 – Identify the Hazards<br>
11
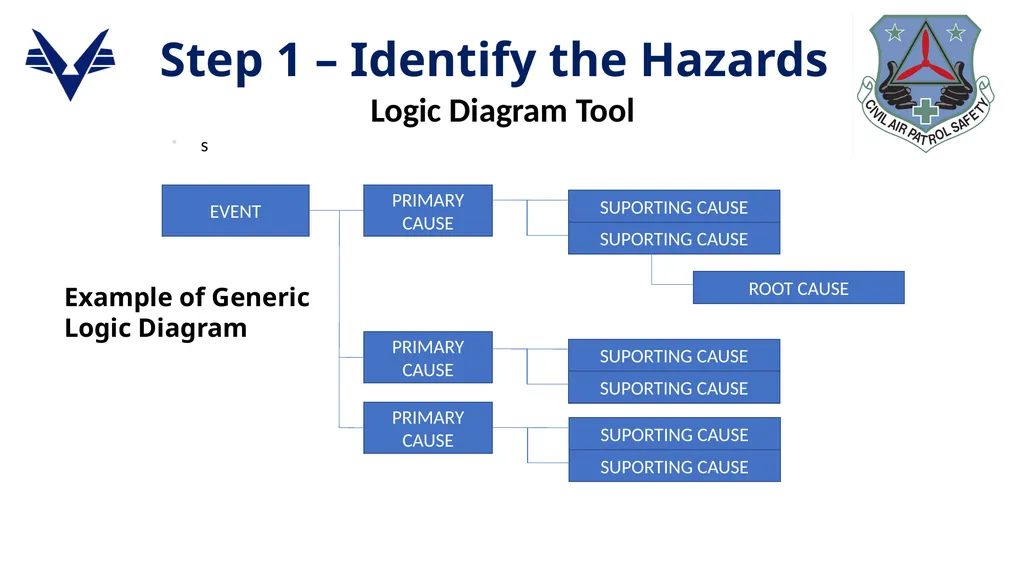
The most comprehensive and detailed of the hazard identification tools. Most effective with complicated operations where hazards are interlinked in various ways. Tree-like structure establishes the connectivity and linkages that may exist between hazards. It’s graphics captures and correlates the hazards data produced by the other tools.
Three major types of logic diagrams
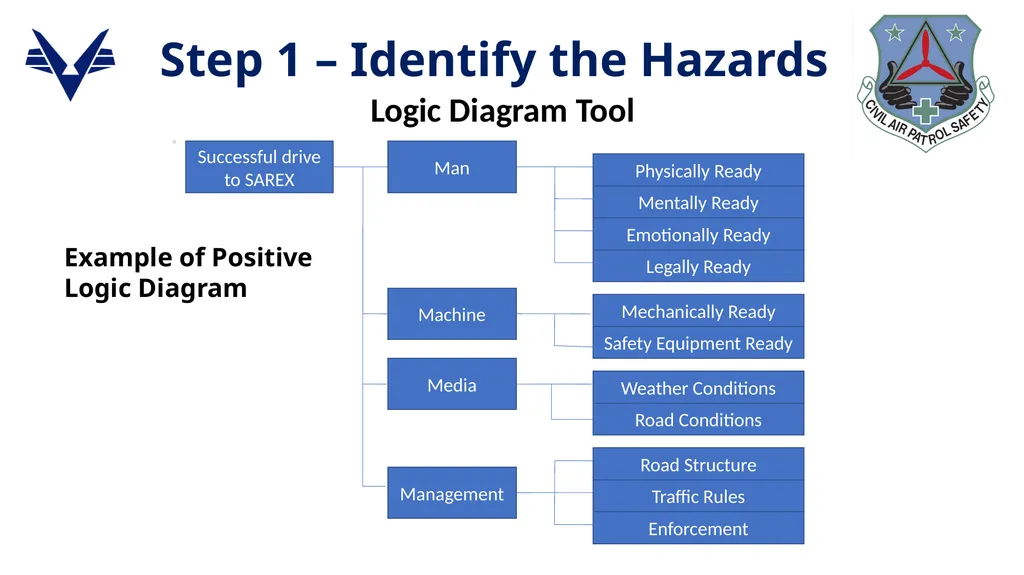
- Positive diagram. Highlights factors that must be in place if risk is to effectively controlled
- Event diagram. Focuses on one event, often a failure identified with “what if” tool, and examines possible outcomes
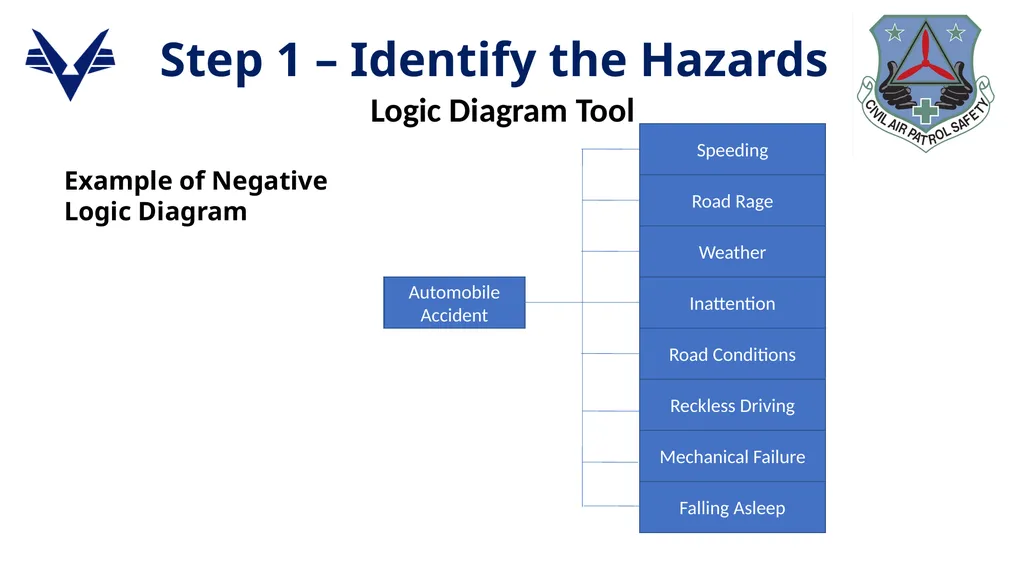
- Negative diagram. Selects a loss event and analyses various hazards that could combine to produce that loss
Excellent place to use the 5M Model – Interaction between Man, Machine, Media, and Management to produce Mission success. Logic Diagram Tool Step 1 – Identify the Hazards<br>
Three major types of logic diagrams
- Positive diagram. Highlights factors that must be in place if risk is to effectively controlled
- Event diagram. Focuses on one event, often a failure identified with “what if” tool, and examines possible outcomes
- Negative diagram. Selects a loss event and analyses various hazards that could combine to produce that loss
Excellent place to use the 5M Model – Interaction between Man, Machine, Media, and Management to produce Mission success. Logic Diagram Tool Step 1 – Identify the Hazards<br>
12
s EVENT PRIMARY CAUSE PRIMARY CAUSE PRIMARY CAUSE SUPORTING CAUSE SUPORTING CAUSE Step 1 – Identify the Hazards Logic Diagram Tool Example of Generic
Logic Diagram SUPORTING CAUSE SUPORTING CAUSE SUPORTING CAUSE SUPORTING CAUSE ROOT CAUSE<br>
Logic Diagram SUPORTING CAUSE SUPORTING CAUSE SUPORTING CAUSE SUPORTING CAUSE ROOT CAUSE<br>
13
s Successful drive to SAREX Man Machine Media Management Physically Ready Mentally Ready Emotionally Ready Legally Ready Mechanically Ready Safety Equipment Ready Weather Conditions Road Conditions Road Structure Traffic Rules Enforcement Step 1 – Identify the Hazards Logic Diagram Tool Example of Positive
Logic Diagram<br>
Logic Diagram<br>
14
Automobile
Accident Speeding Road Rage Weather Inattention Road Conditions Reckless Driving Mechanical Failure Falling Asleep Step 1 – Identify the Hazards Logic Diagram Tool Example of Negative
Logic Diagram<br>
Accident Speeding Road Rage Weather Inattention Road Conditions Reckless Driving Mechanical Failure Falling Asleep Step 1 – Identify the Hazards Logic Diagram Tool Example of Negative
Logic Diagram<br>
15
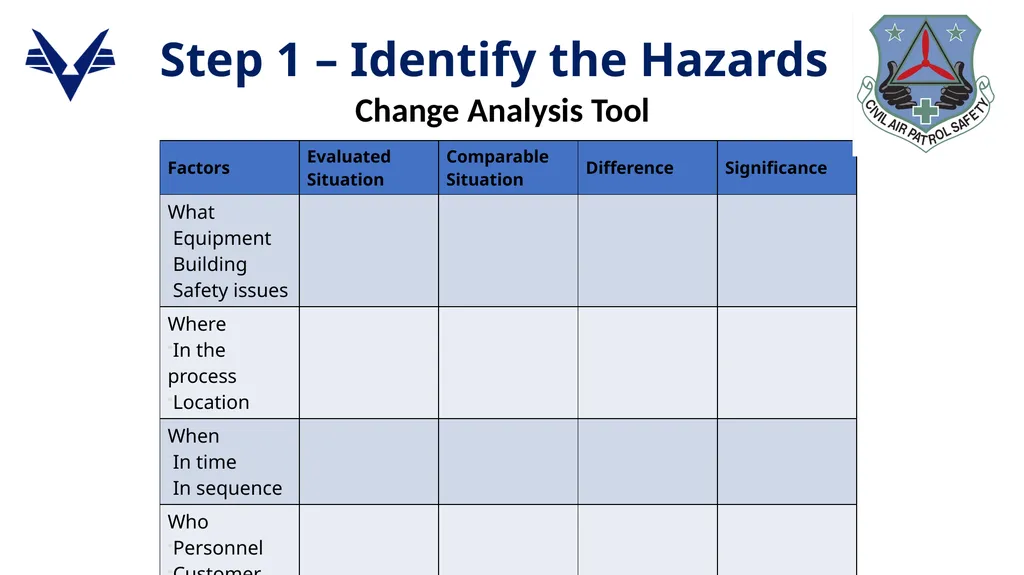
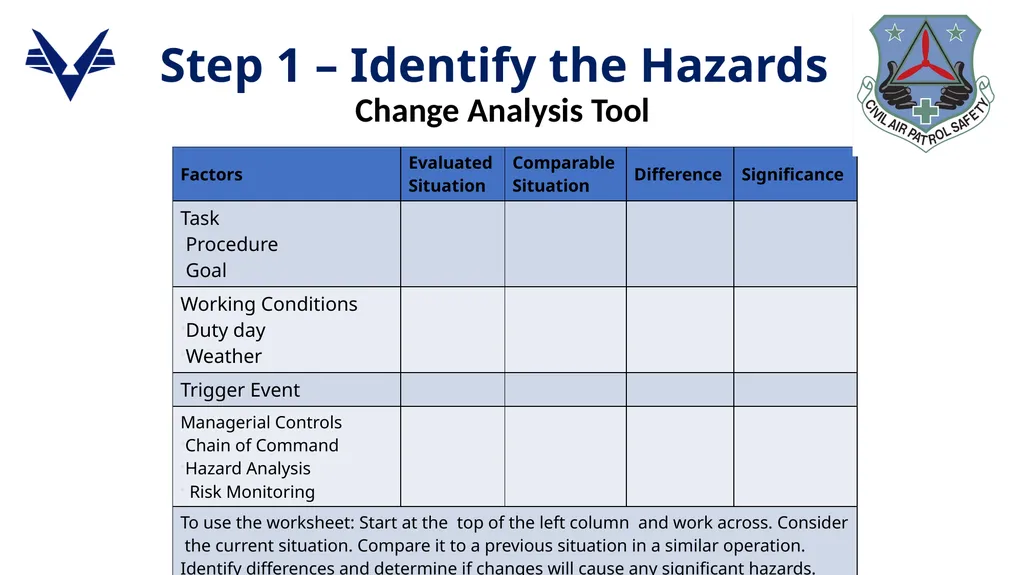
Used to analyze the hazard implications of planned or unplanned changes.
Focuses only on the changed aspect of event
Compare the current situation with the previous one
Only tool needed if operation has been subjected to in-depth hazard analysis
Best accomplished using a simple worksheet Step 1 – Identify the Hazards Change Analysis Tool<br>
Focuses only on the changed aspect of event
Compare the current situation with the previous one
Only tool needed if operation has been subjected to in-depth hazard analysis
Best accomplished using a simple worksheet Step 1 – Identify the Hazards Change Analysis Tool<br>
16
Step 1 – Identify the Hazards Change Analysis Tool<br>
17
Step 1 – Identify the Hazards Change Analysis Tool<br>
18
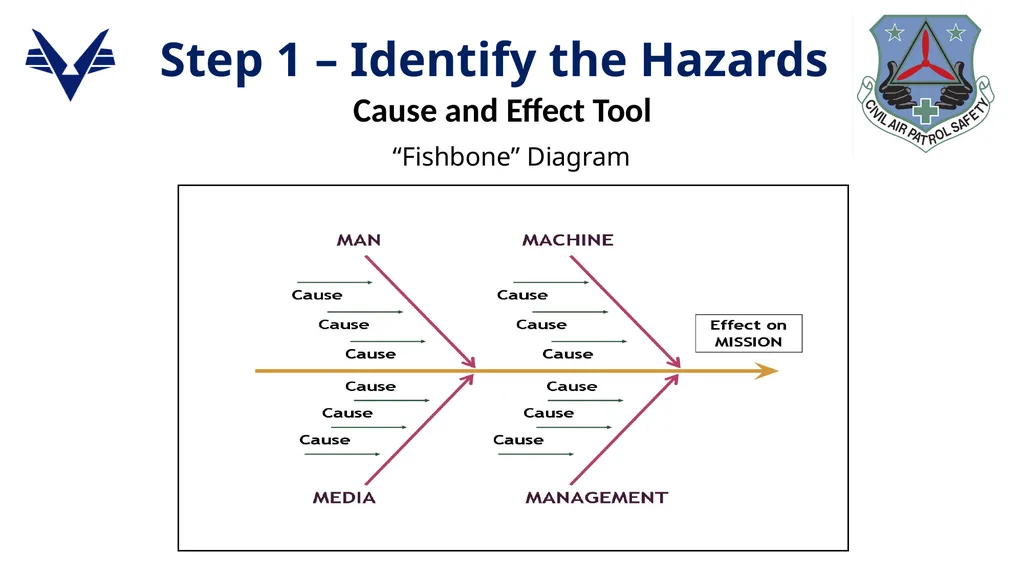
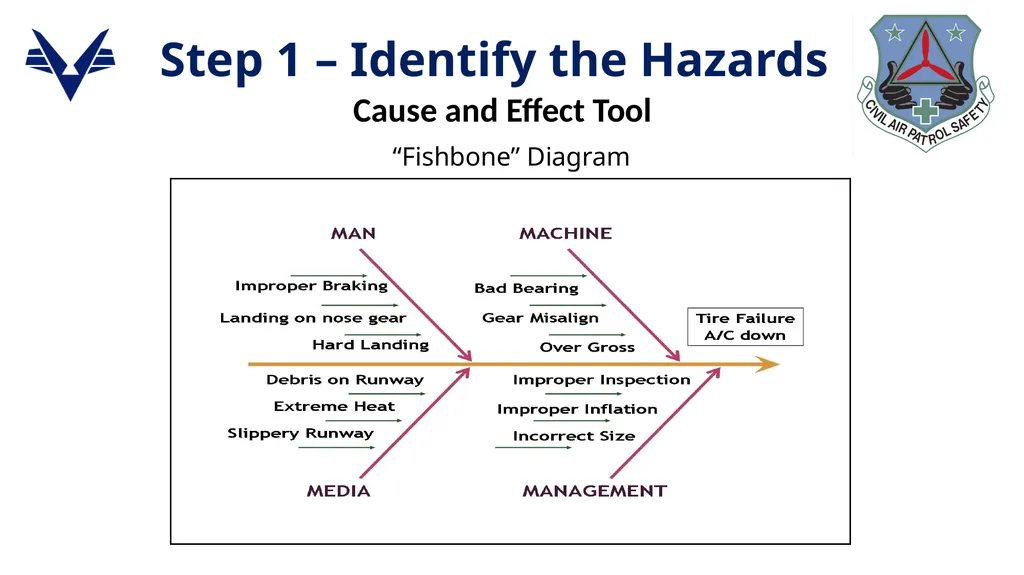
Brainstorming is used to identify causes, using the 5M Model, that may lead to a hazard.
Uses the “Fishbone” or Ishikawa Diagram. Named after the inventor, Professor Kaoru Ishikawa of Tokyo University, a highly regarded expert in quality management.
Illustrates hierarchical relationships between possible causes according to their level of importance
Can be drawn on flip chart or whiteboard
Variation of the Logic Diagram Step 1 – Identify the Hazards Cause and Effect Tool<br>
Uses the “Fishbone” or Ishikawa Diagram. Named after the inventor, Professor Kaoru Ishikawa of Tokyo University, a highly regarded expert in quality management.
Illustrates hierarchical relationships between possible causes according to their level of importance
Can be drawn on flip chart or whiteboard
Variation of the Logic Diagram Step 1 – Identify the Hazards Cause and Effect Tool<br>
19
“Fishbone” Diagram Step 1 – Identify the Hazards Cause and Effect Tool<br>
20
“Fishbone” Diagram Step 1 – Identify the Hazards Cause and Effect Tool<br>
21
USAF identifies 14 specialty hazard ID tools used to enhance the primary tools.
Three are covered here:
The Mapping Tool
The Interface Analysis Tool
Mission Protection Tool Step 1 – Identify the Hazards Road maps, terrain maps, airport diagrams, facility blueprints and schematics are used to identify sources of hazards
Potential hazards are steep terrain, creeks and streams, winding mountainous roads, desert areas, flammables, and high voltage areas
Locate energy sources and other hazards on the map and note distance to operation and resources Specialty Hazard ID Tool<br>
Three are covered here:
The Mapping Tool
The Interface Analysis Tool
Mission Protection Tool Step 1 – Identify the Hazards Road maps, terrain maps, airport diagrams, facility blueprints and schematics are used to identify sources of hazards
Potential hazards are steep terrain, creeks and streams, winding mountainous roads, desert areas, flammables, and high voltage areas
Locate energy sources and other hazards on the map and note distance to operation and resources Specialty Hazard ID Tool<br>
22
Someone who has seen the map object is an invaluable resource to consult. An on-site inspection should occur before the operation begins.
Incorporate these hazards into other Primary Hazard ID Tools The Mapping Tool Step 1 – Identify the Hazards Specialty Hazard ID Tool<br>
Incorporate these hazards into other Primary Hazard ID Tools The Mapping Tool Step 1 – Identify the Hazards Specialty Hazard ID Tool<br>
23
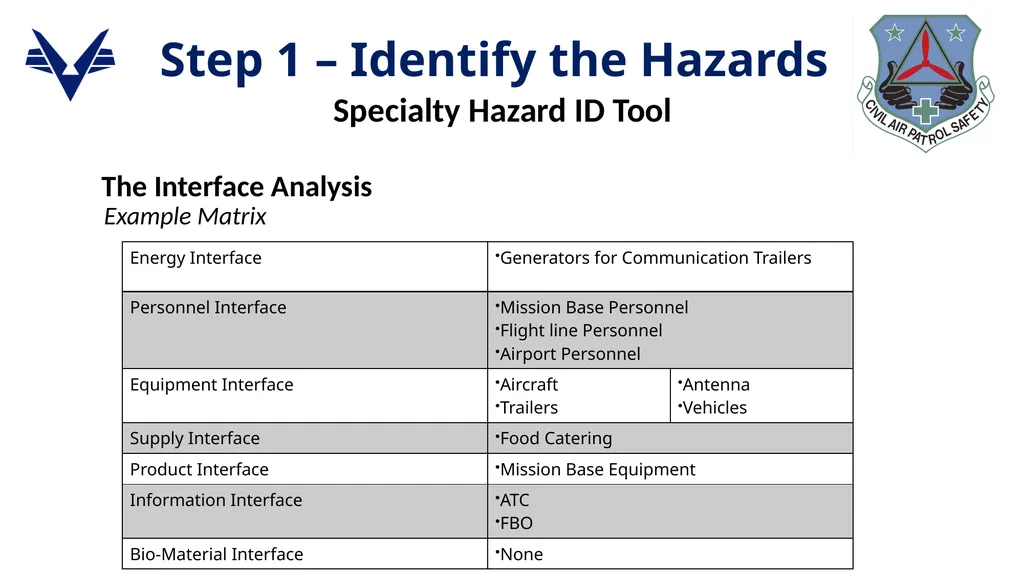
Used to uncover potentially hazardous linkages or interfaces between unrelated activities.
A SAR/SAREX at a local airport may impose hazards to the local airport operations, facilities and pilots.
CAP operations at a airport not used before is a good cue to use the interface analysis and the Primary Hazard ID Change Analysis. The Interface Analysis Step 1 – Identify the Hazards Specialty Hazard ID Tool<br>
A SAR/SAREX at a local airport may impose hazards to the local airport operations, facilities and pilots.
CAP operations at a airport not used before is a good cue to use the interface analysis and the Primary Hazard ID Change Analysis. The Interface Analysis Step 1 – Identify the Hazards Specialty Hazard ID Tool<br>
24
Example Matrix Step 1 – Identify the Hazards Specialty Hazard ID Tool The Interface Analysis<br>
25
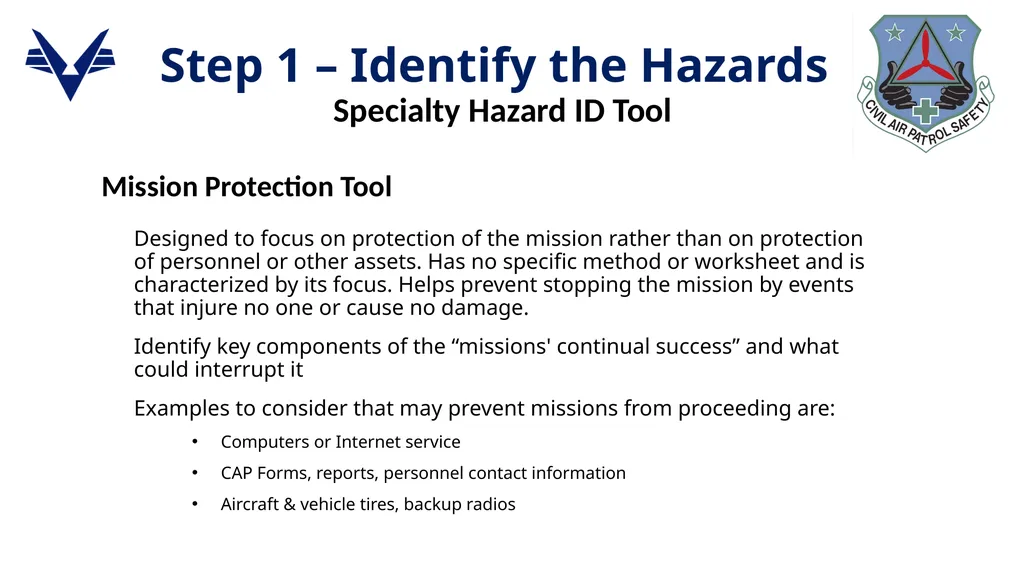
Designed to focus on protection of the mission rather than on protection of personnel or other assets. Has no specific method or worksheet and is characterized by its focus. Helps prevent stopping the mission by events that injure no one or cause no damage.
Identify key components of the “missions' continual success” and what could interrupt it
Examples to consider that may prevent missions from proceeding are:
Computers or Internet service
CAP Forms, reports, personnel contact information
Aircraft & vehicle tires, backup radios Step 1 – Identify the Hazards Specialty Hazard ID Tool Mission Protection Tool<br>
Identify key components of the “missions' continual success” and what could interrupt it
Examples to consider that may prevent missions from proceeding are:
Computers or Internet service
CAP Forms, reports, personnel contact information
Aircraft & vehicle tires, backup radios Step 1 – Identify the Hazards Specialty Hazard ID Tool Mission Protection Tool<br>
26
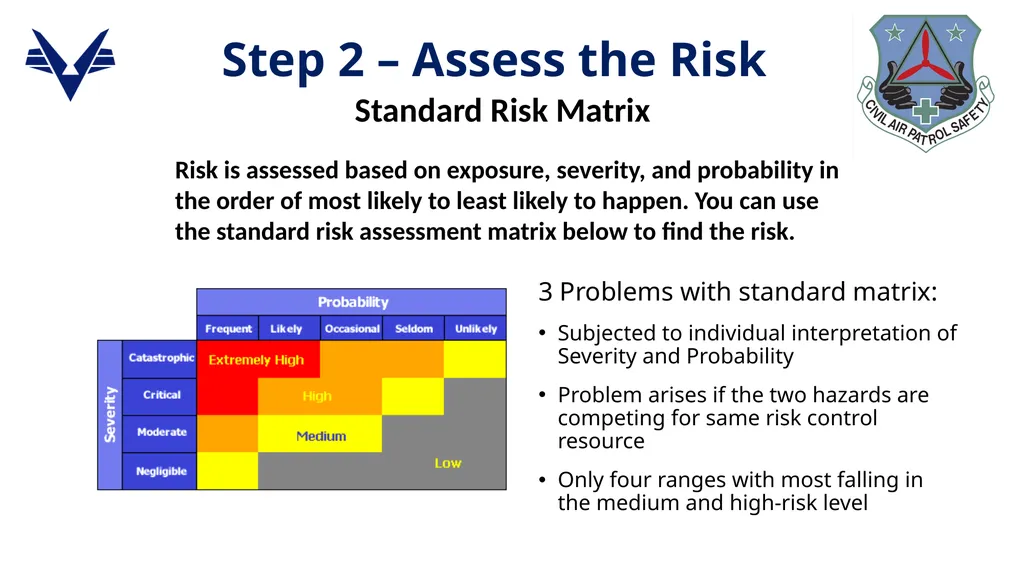
Risk is assessed based on exposure, severity, and probability in the order of most likely to least likely to happen. You can use the standard risk assessment matrix below to find the risk. Step 2 – Assess the Risk 3 Problems with standard matrix:
Subjected to individual interpretation of Severity and Probability
Problem arises if the two hazards are competing for same risk control resource
Only four ranges with most falling in the medium and high-risk level Standard Risk Matrix<br>
Subjected to individual interpretation of Severity and Probability
Problem arises if the two hazards are competing for same risk control resource
Only four ranges with most falling in the medium and high-risk level Standard Risk Matrix<br>
27
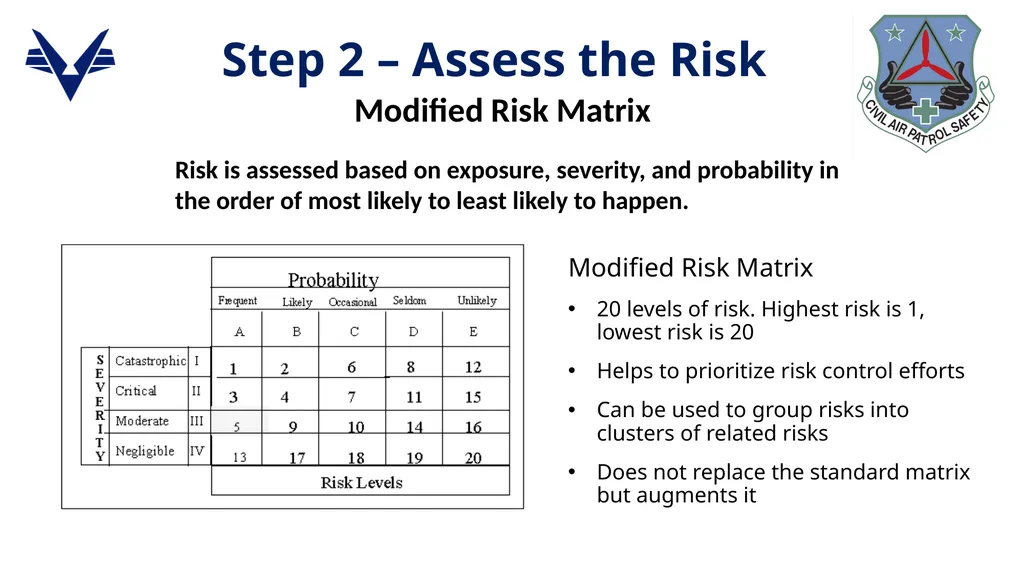
Step 2 – Assess the Risk Modified Risk Matrix
20 levels of risk. Highest risk is 1, lowest risk is 20
Helps to prioritize risk control efforts
Can be used to group risks into clusters of related risks
Does not replace the standard matrix but augments it Modified Risk Matrix Risk is assessed based on exposure, severity, and probability in the order of most likely to least likely to happen.<br>
20 levels of risk. Highest risk is 1, lowest risk is 20
Helps to prioritize risk control efforts
Can be used to group risks into clusters of related risks
Does not replace the standard matrix but augments it Modified Risk Matrix Risk is assessed based on exposure, severity, and probability in the order of most likely to least likely to happen.<br>
28
Analyzing Risk Control Measures involves 3 actions
Identify Control Options
Determine Control Effects
Prioritize Control Measures
Important to keep risk at the best acceptable level using control options, even if risk seems to be at an acceptable level. Step 3 – Analyze Risk Control Measures<br>
Identify Control Options
Determine Control Effects
Prioritize Control Measures
Important to keep risk at the best acceptable level using control options, even if risk seems to be at an acceptable level. Step 3 – Analyze Risk Control Measures<br>
29
Eight major risk control options are designed to have the broadest application: Identify Control Options Reject the Risk
Avoid the Risk
Delay the Risk
Transfer the Risk Spread the Risk
Compensate for the Risk
Accept the Risk
Reducing the Risk Step 3 – Analyze Risk Control Measures<br>
Avoid the Risk
Delay the Risk
Transfer the Risk Spread the Risk
Compensate for the Risk
Accept the Risk
Reducing the Risk Step 3 – Analyze Risk Control Measures<br>
30
Identify Control Options Reject the Risk if overall risks exceed benefits. It is the correct option if you do not have the authority to put proper controls in place.
Avoid the Risk by going around it or by performing the operation in another way.
Delay the Risk is the right answer if there is no urgency to perform the operation. The hazard could go away or the operation may not needed.
Transfer the Risk to another individual or operation. The hazard is not eliminated but may be better controlled with a different operator and/or equipment. Step 3 – Analyze Risk Control Measures<br>
Avoid the Risk by going around it or by performing the operation in another way.
Delay the Risk is the right answer if there is no urgency to perform the operation. The hazard could go away or the operation may not needed.
Transfer the Risk to another individual or operation. The hazard is not eliminated but may be better controlled with a different operator and/or equipment. Step 3 – Analyze Risk Control Measures<br>
31
Identify Control Options Spread the Risk by increasing the exposure distance or increase the time between exposure events.
Compensate for the Risk by having redundant capabilities; extra resources or parts.
Accept the Risk if benefits exceed the cost in personnel and resources. Use risk controls to reduce the risk to it’s lowest possible level.
Reduce the Risk is the most widely used option. Brainstorm to come up with ideas or use the Risk Control Options Matrix. Step 3 – Analyze Risk Control Measures<br>
Compensate for the Risk by having redundant capabilities; extra resources or parts.
Accept the Risk if benefits exceed the cost in personnel and resources. Use risk controls to reduce the risk to it’s lowest possible level.
Reduce the Risk is the most widely used option. Brainstorm to come up with ideas or use the Risk Control Options Matrix. Step 3 – Analyze Risk Control Measures<br>
32
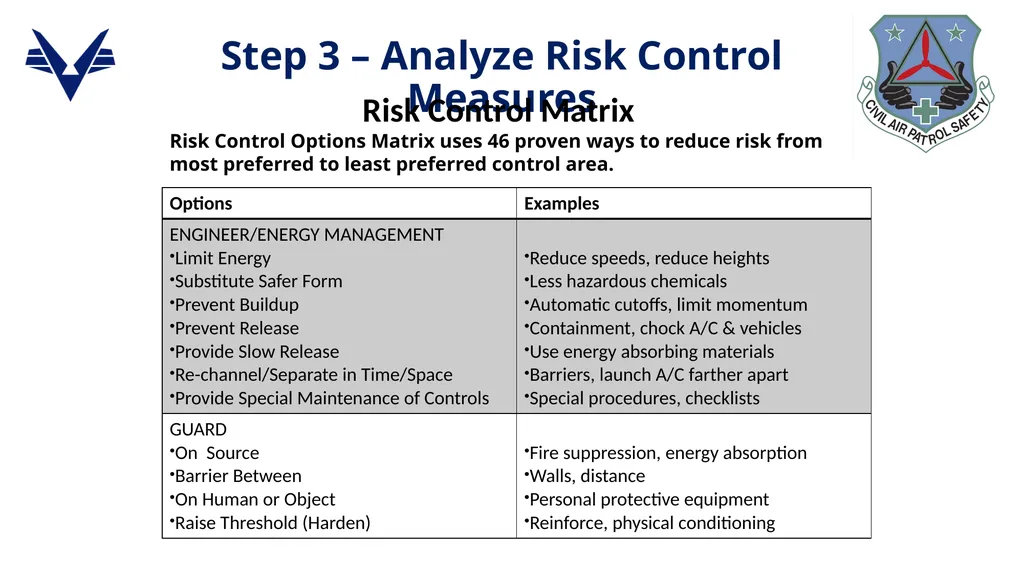
Step 3 – Analyze Risk Control Measures Risk Control Matrix Risk Control Options Matrix uses 46 proven ways to reduce risk from most preferred to least preferred control area.<br>
33
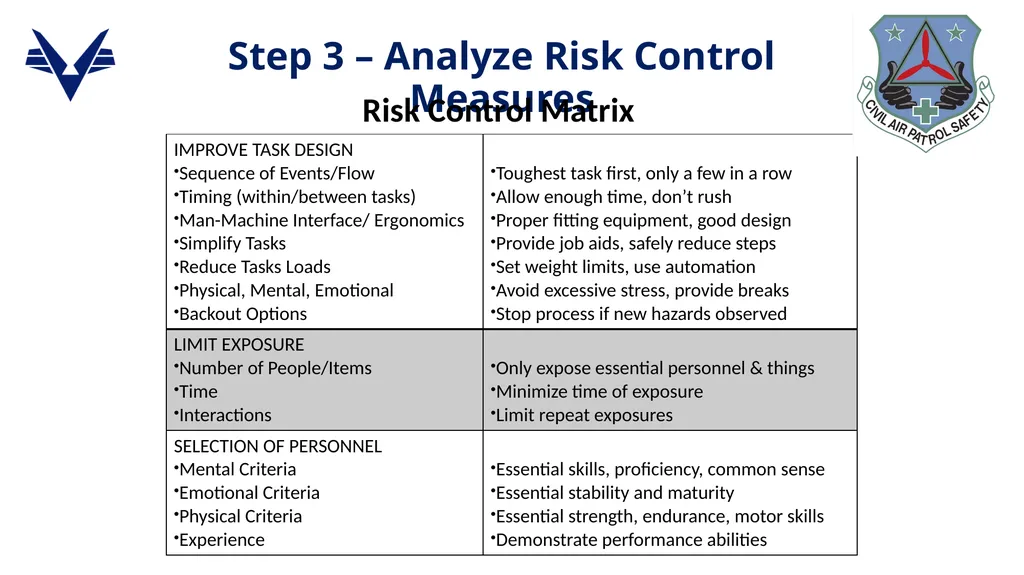
Step 3 – Analyze Risk Control Measures Risk Control Matrix<br>
34
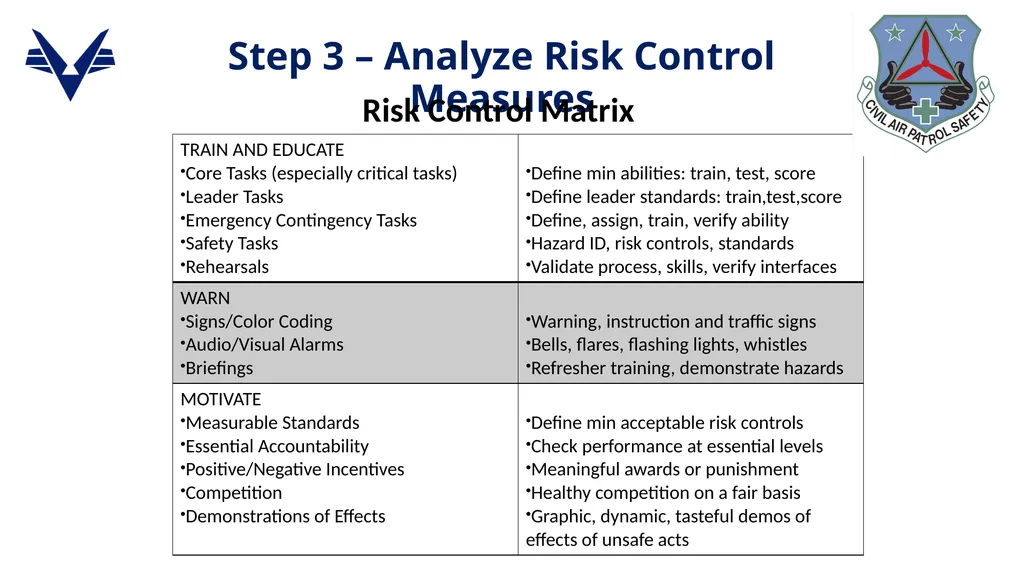
Step 3 – Analyze Risk Control Measures Risk Control Matrix<br>
35
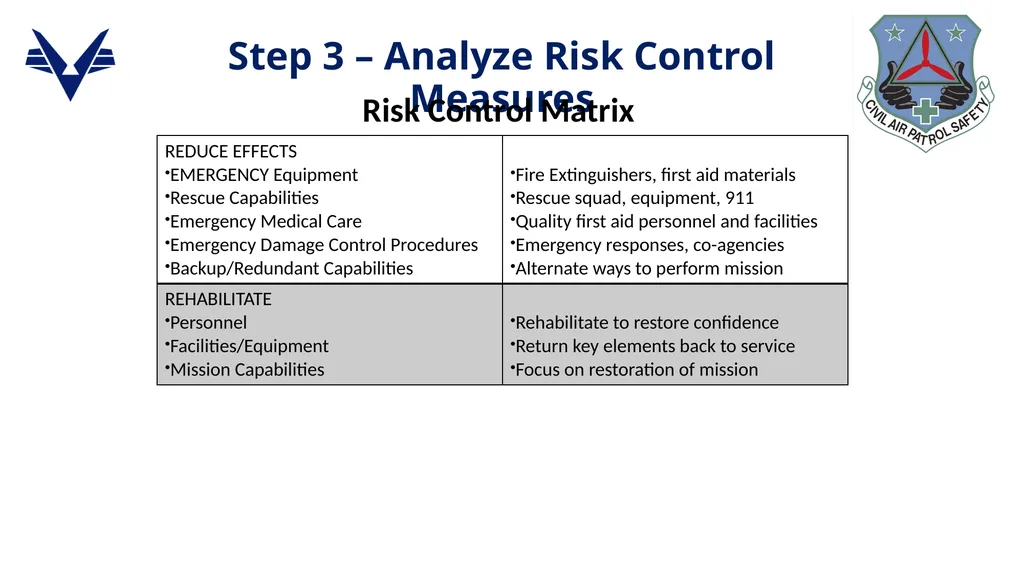
Step 3 – Analyze Risk Control Measures Risk Control Matrix<br>
36
Determine Control Effects
From the control matrix, determine what effect each option will have on the associated hazard.
Prioritize Risk Controls
Controls must be chosen and prioritized that make the most effective and efficient use of mission available resources. Establish guidelines that will direct which control measure to recommend and implement. Step 3 – Analyze Risk Control Measures<br>
From the control matrix, determine what effect each option will have on the associated hazard.
Prioritize Risk Controls
Controls must be chosen and prioritized that make the most effective and efficient use of mission available resources. Establish guidelines that will direct which control measure to recommend and implement. Step 3 – Analyze Risk Control Measures<br>
37
Guidelines for selecting risk control measures
Follow all published directives
Select combinations yielding the most mission-supportive risk level; not necessary the lowest risk as there is a risk of mission ineffectiveness with not taking risks
Avoid incompatible risk controls. Do not have only Gatorade available to combat dehydration if persons are allergic to food additives; have water available also
Choose risk controls that reinforce each other. Discipline safety rule violators and have a special awards program for following safety procedures and being accident free
Evaluate full costs versus full benefits, not isolated areas. Apply controls to activities and personnel at risk
Choose redundant risk controls when it is mission supportive, practical and cost effective, but do not waste resources. The goal is optimum risk control Step 3 – Analyze Risk Control Measures<br>
Follow all published directives
Select combinations yielding the most mission-supportive risk level; not necessary the lowest risk as there is a risk of mission ineffectiveness with not taking risks
Avoid incompatible risk controls. Do not have only Gatorade available to combat dehydration if persons are allergic to food additives; have water available also
Choose risk controls that reinforce each other. Discipline safety rule violators and have a special awards program for following safety procedures and being accident free
Evaluate full costs versus full benefits, not isolated areas. Apply controls to activities and personnel at risk
Choose redundant risk controls when it is mission supportive, practical and cost effective, but do not waste resources. The goal is optimum risk control Step 3 – Analyze Risk Control Measures<br>
38
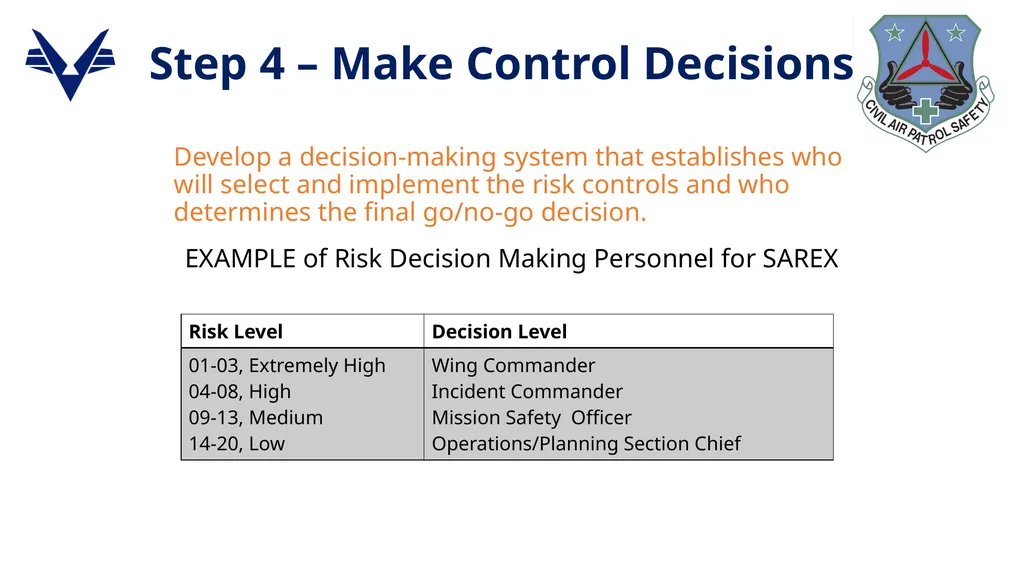
Develop a decision-making system that establishes who will select and implement the risk controls and who determines the final go/no-go decision.
EXAMPLE of Risk Decision Making Personnel for SAREX Step 4 – Make Control Decisions<br>
EXAMPLE of Risk Decision Making Personnel for SAREX Step 4 – Make Control Decisions<br>
39
Must pick the controls and oversee their implementation
Decide how much to spend
Be responsible for the outcome of the operation
Be able to obtain resources needed
Be in control of the resources
Have authority in the chain of command Step 4 – Make Control Decisions The Person Making Decisions<br>
Decide how much to spend
Be responsible for the outcome of the operation
Be able to obtain resources needed
Be in control of the resources
Have authority in the chain of command Step 4 – Make Control Decisions The Person Making Decisions<br>
40
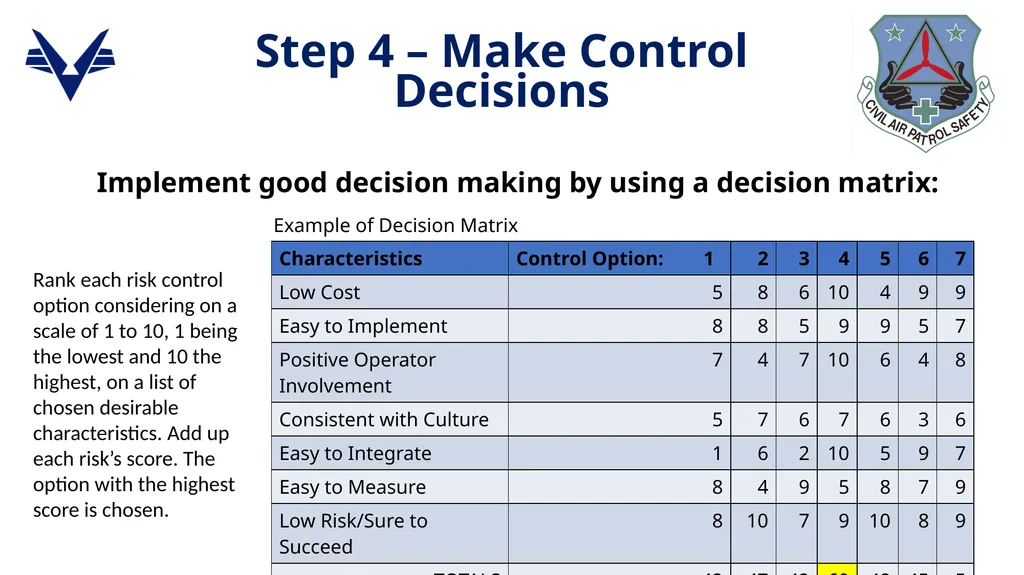
Example of Decision Matrix Step 4 – Make Control Decisions Implement good decision making by using a decision matrix: Rank each risk control option considering on a scale of 1 to 10, 1 being the lowest and 10 the highest, on a list of chosen desirable characteristics. Add up each risk’s score. The option with the highest score is chosen.<br>
41
Once the risk control decision is made, assets must be made available to implement specific controls.
To implement risk controls:
Develop a complete action plan
Establish accountability
Provide a means of resource support Step 5 – Implement Risk Controls<br>
To implement risk controls:
Develop a complete action plan
Establish accountability
Provide a means of resource support Step 5 – Implement Risk Controls<br>
42
Step 5 – Implement Risk Controls Develop an Action Plan Develop an action plan to manage the control options:
Determine all manpower and resources needed
Estimate cost to implement each control
Set a timeline that clearly sets milestones and goals
Assign tasks and due-dates to specific personnel
Enlist user input to establishment ownership
Provide job aids, tools and examples to make implementation clear to everyone
Measure performance
Document any outside support given<br>
Determine all manpower and resources needed
Estimate cost to implement each control
Set a timeline that clearly sets milestones and goals
Assign tasks and due-dates to specific personnel
Enlist user input to establishment ownership
Provide job aids, tools and examples to make implementation clear to everyone
Measure performance
Document any outside support given<br>
43
Levels of accountability:
Identify person responsible for successful implementation of each control measure.
Identify unit or operations level person responsible for the implementation.
Combine the power of command with leadership to maintain accountability.
Establish motivation and create meaningful and positive incentives for success.
Involve persons affected by the controls during implementation. Step 5 – Implement Risk Controls Establish Accountability<br>
Identify person responsible for successful implementation of each control measure.
Identify unit or operations level person responsible for the implementation.
Combine the power of command with leadership to maintain accountability.
Establish motivation and create meaningful and positive incentives for success.
Involve persons affected by the controls during implementation. Step 5 – Implement Risk Controls Establish Accountability<br>
44
Resource support includes 6 components:
Policy support with operating instructions, technical orders, and any standard operating procedures
Command support showing the absolute backing of the leadership
Training support for personnel implementing controls
Tools support including job aids, checklists, decision guides and instructions
Measurement support to determine if timelines, schedules and standards are being met
Motivation support providing the positive and negative incentives for a successful risk control Step 5 – Implement Risk Controls Resource Support<br>
Policy support with operating instructions, technical orders, and any standard operating procedures
Command support showing the absolute backing of the leadership
Training support for personnel implementing controls
Tools support including job aids, checklists, decision guides and instructions
Measurement support to determine if timelines, schedules and standards are being met
Motivation support providing the positive and negative incentives for a successful risk control Step 5 – Implement Risk Controls Resource Support<br>
45
Determining the effectiveness of risk control involves setting a goal, knowing where you are in relation to the goal, and a plan in place to reach the goal.
This last step of ORM involves
Supervise
Review
Feedback Step 6 – Supervise & Review Resource Support<br>
This last step of ORM involves
Supervise
Review
Feedback Step 6 – Supervise & Review Resource Support<br>
46
Supervise the implementation plan, insure all are in place, monitor all controls and make certain they are effective.
Controls are effective if they bring about favorable changes to the physical condition or personal behavior.
If a control is ineffective, correct or discontinue.
Use the Change Analysis Tool from Step 1 to reevaluate any changes that require further risk management. Step 6 – Supervise & Review Supervise<br>
Controls are effective if they bring about favorable changes to the physical condition or personal behavior.
If a control is ineffective, correct or discontinue.
Use the Change Analysis Tool from Step 1 to reevaluate any changes that require further risk management. Step 6 – Supervise & Review Supervise<br>
47
Review the total cost verses total benefits the controls provide; for each control consider both physical and behavioral changes.
Costs should be in line with expectations. The benefits in risk reduction should be greater than the cost of the control measure
Benefits or effectiveness of controls should be compared to forecasted goals
A simple cost vs. benefit matrix is recommended Step 6 – Supervise & Review Review<br>
Costs should be in line with expectations. The benefits in risk reduction should be greater than the cost of the control measure
Benefits or effectiveness of controls should be compared to forecasted goals
A simple cost vs. benefit matrix is recommended Step 6 – Supervise & Review Review<br>
48
Feedback is the essential element in Step 6. It provides the ability to share success and failure. One of the basic rules of ORM is to stop reinventing the wheel and learn from past practices and from the mistakes of others.
Feedback should go to all personnel; from new cadets to commanders. Effective risk controls that increase the overall mission success should be a part of every CAP member’s lessons learned file. Step 6 – Supervise & Review Feedback<br>
Feedback should go to all personnel; from new cadets to commanders. Effective risk controls that increase the overall mission success should be a part of every CAP member’s lessons learned file. Step 6 – Supervise & Review Feedback<br>
49
To fully realize all the benefits from Operational Risk Management, it must be integrated into every aspect of CAP’s organization and it’s missions.
All levels of CAP should proactively promote and use Operational Risk Management.
Its use will benefit everyone by improving mission capability, enhancing better decision making, reducing accidents and injuries, and preserving our assets. Conclusion<br>
All levels of CAP should proactively promote and use Operational Risk Management.
Its use will benefit everyone by improving mission capability, enhancing better decision making, reducing accidents and injuries, and preserving our assets. Conclusion<br>
50
Air Force Policy Directive 90-9, Operational Risk Management
Air Force Instruction 90-901, Operational Risk Management
Air Force Pamphlet 90-902, Operational Risk Management (ORM) Guidelines and Tools References<br>
Air Force Instruction 90-901, Operational Risk Management
Air Force Pamphlet 90-902, Operational Risk Management (ORM) Guidelines and Tools References<br>
51
51 Civil Air Patrol wishes to thank the USAF Safety Center for the use of their information in the creation of this presentation. Thank You!<br>
52
52 Quiz Time! Close the presentation.
Verify that you have read the required material then click the “Start Quiz” button.
Thank your for your support of CAP’s safety program.<br>
Verify that you have read the required material then click the “Start Quiz” button.
Thank your for your support of CAP’s safety program.<br>