
1 ‘Intergenerational Mobility in UK, life chances

Description: 1 Intergenerational Mobility in UK, life chances and the Role of Inequality and Education Paul Gregg Presentation to IFS Poverty Review Workshop 7th Sept 2010 2 Introduction Background Most people are willing to accept wide inequalities
Related Topics
Download Presentation
"1 ‘Intergenerational Mobility in UK, life chances" is the property of its rightful owner. Permission is granted to download and print the materials on this website for personal, non-commercial use only, and to display it on your personal computer provided you do not modify the materials and that you retain all copyright notices contained in the materials. By downloading content from our website, you accept the terms of this agreement.
Presentation Transcript
slide1. 1 ‘Intergenerational Mobility in UK, life chances and the Role of Inequality and Education
Paul Gregg Presentation to IFS Poverty Review Workshop
7th Sept 2010<br>
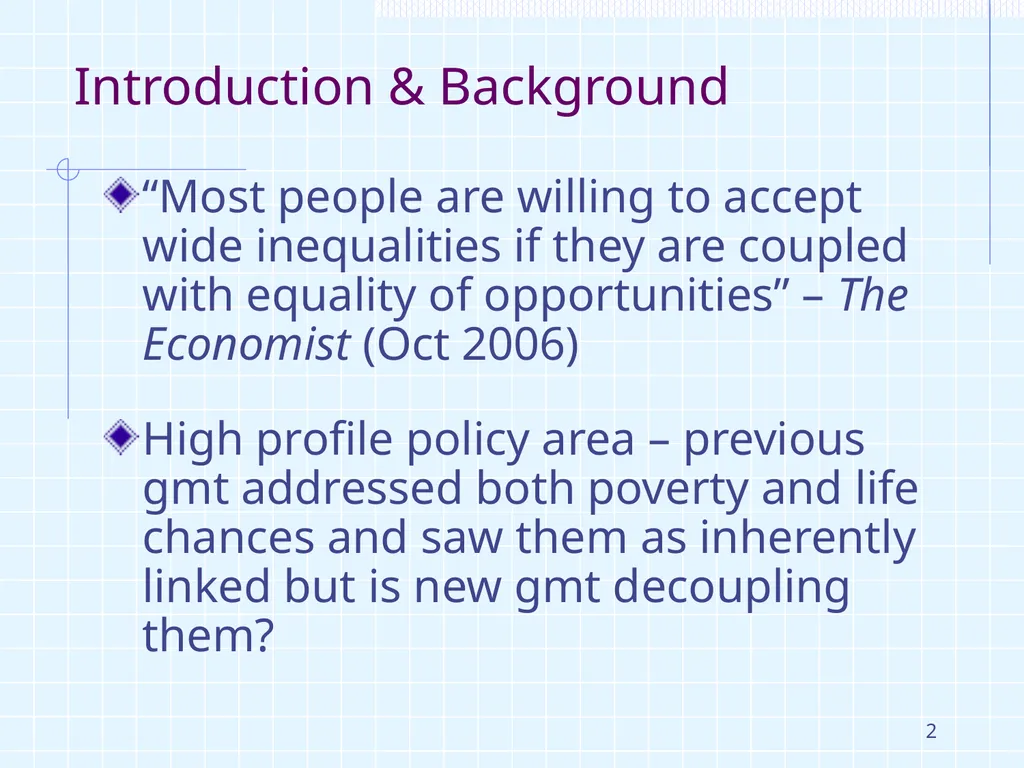
slide2. 2 Introduction & Background “Most people are willing to accept wide inequalities if they are coupled with equality of opportunities” – The Economist (Oct 2006)
High profile policy area – previous gmt addressed both poverty and life chances and saw them as inherently linked but is new gmt decoupling them?<br>
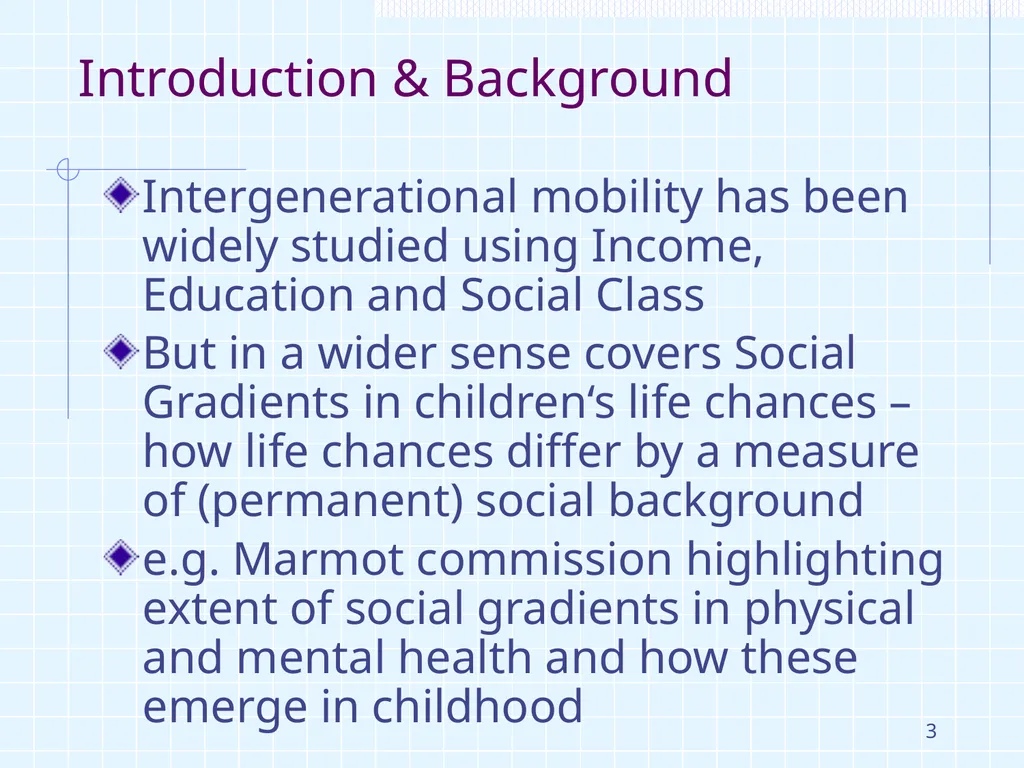
slide3. 3 Introduction & Background Intergenerational mobility has been widely studied using Income, Education and Social Class
But in a wider sense covers Social Gradients in children‘s life chances – how life chances differ by a measure of (permanent) social background
e.g. Marmot commission highlighting extent of social gradients in physical and mental health and how these emerge in childhood<br>
slide4. Concepts Original concept of Intergenerational Earnings mobility is ideally comparison of life time (permanent) earnings of father and sons
This is very data intensive so shorter tem earnings measures used
More recently the question has shifted towards childhood experience and later life chances which has shifted emphasis toward family income in childhood
This also allows for absentee fathers which varies across cohorts in a non-random way<br>
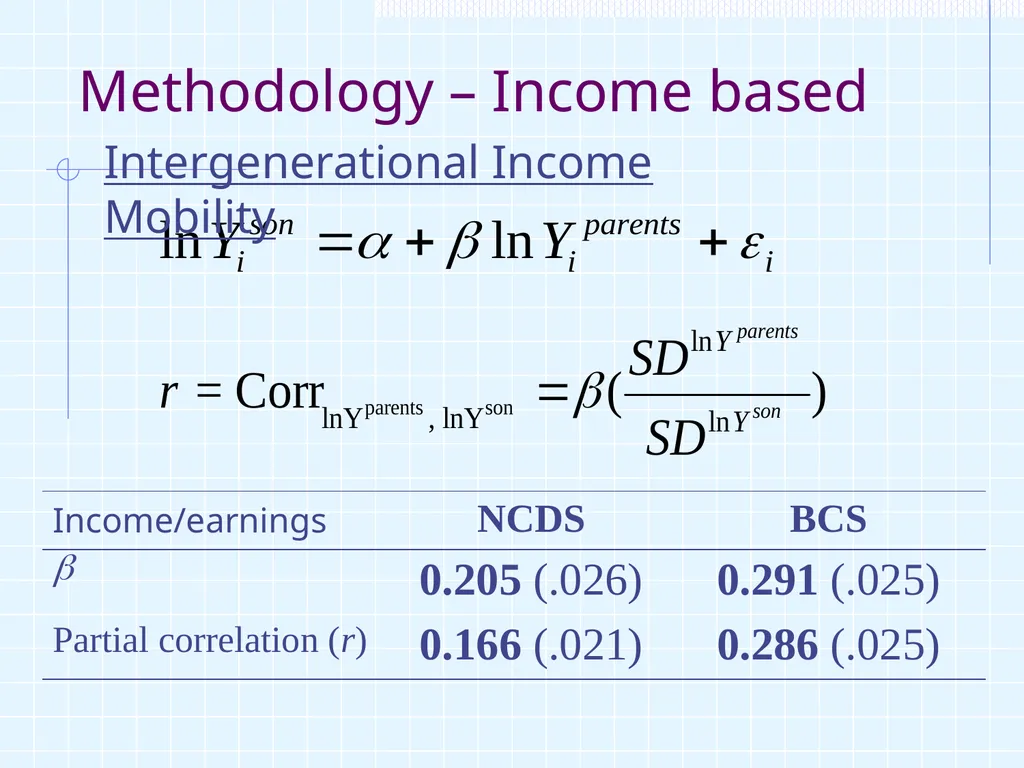
slide5. Methodology – Income based Intergenerational Income Mobility<br>
slide6. Measurement I Early earnings based research had highlight high levels of mobility but concerns raised over biases generated by measurement error and life cycle stage
So using American data NLSY single period income = 0.32, average over 3 periods = 0.45 implies true estimate = 0.54
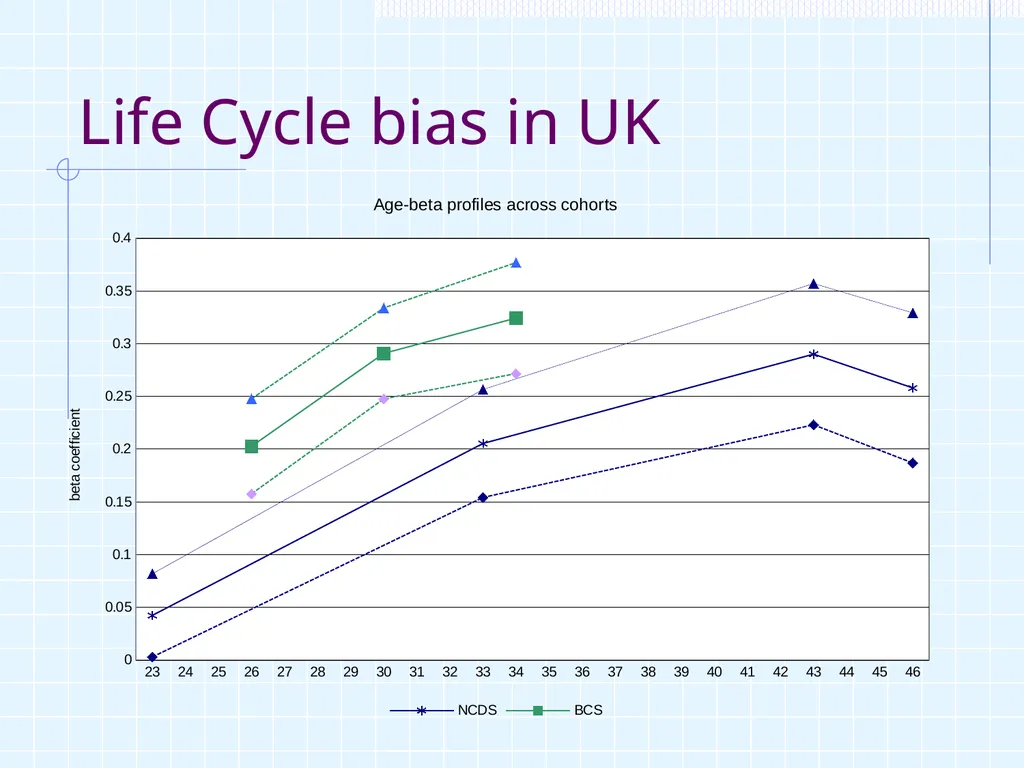
Life cycle bias comes from the age(s) at which earnings are measured and how good a proxy they are for lifetime earnings
When earnings is measured early or late in life course it is a less good proxy for lifetime earnings (optimal is at about 40)<br>
slide7. Life Cycle bias in UK<br>
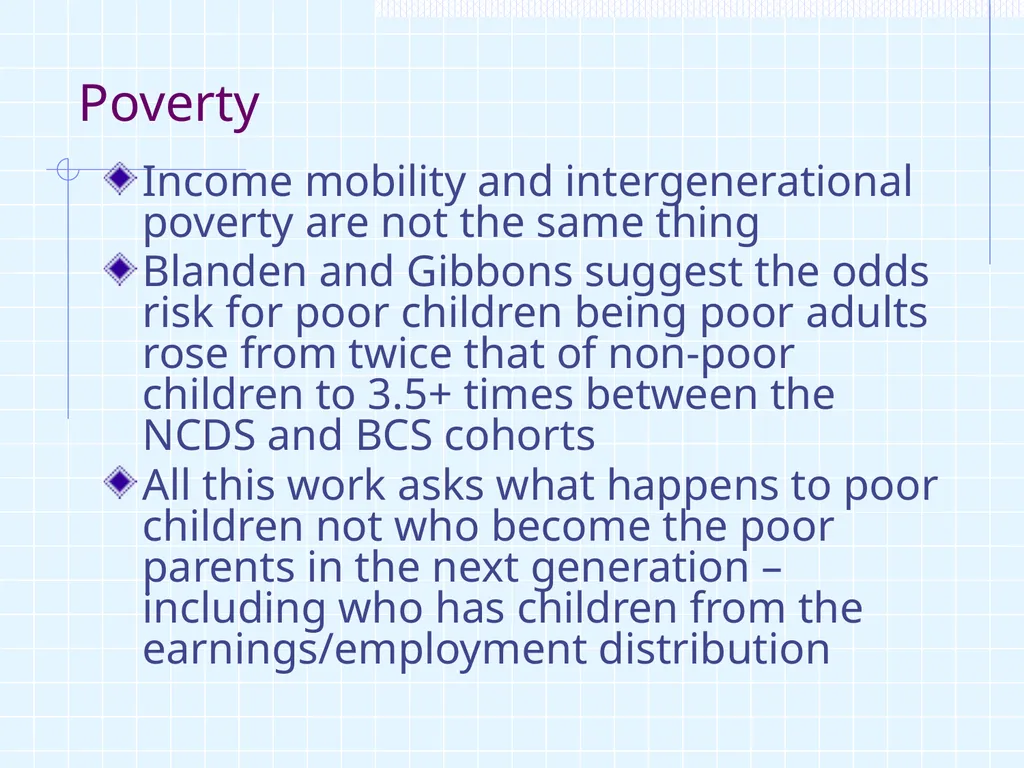
slide8. Poverty Income mobility and intergenerational poverty are not the same thing
Blanden and Gibbons suggest the odds risk for poor children being poor adults rose from twice that of non-poor children to 3.5+ times between the NCDS and BCS cohorts
All this work asks what happens to poor children not who become the poor parents in the next generation – including who has children from the earnings/employment distribution<br>
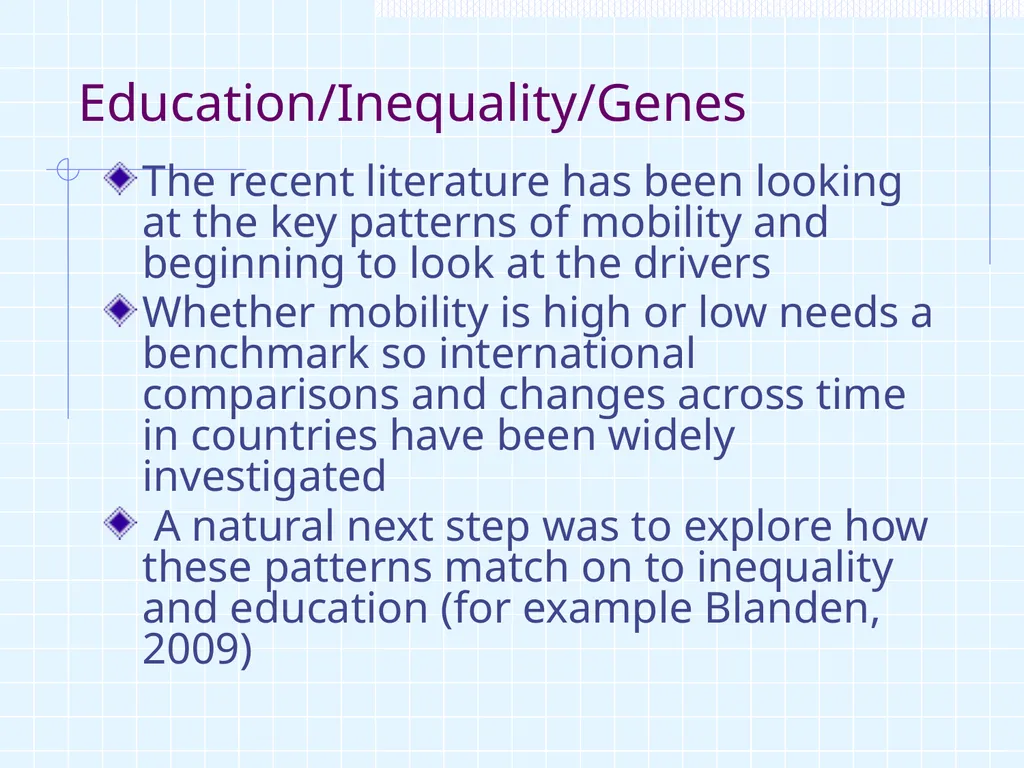
slide9. Education/Inequality/Genes The recent literature has been looking at the key patterns of mobility and beginning to look at the drivers
Whether mobility is high or low needs a benchmark so international comparisons and changes across time in countries have been widely investigated
A natural next step was to explore how these patterns match on to inequality and education (for example Blanden, 2009)<br>
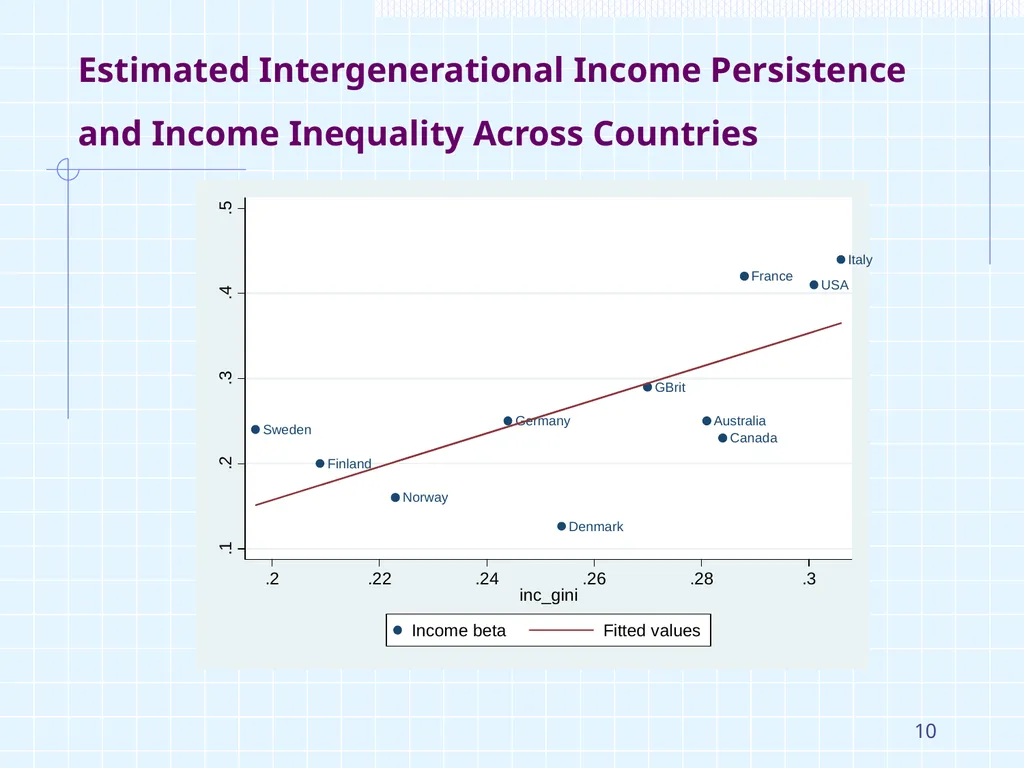
slide10. 10 Estimated Intergenerational Income Persistence and Income Inequality Across Countries<br>
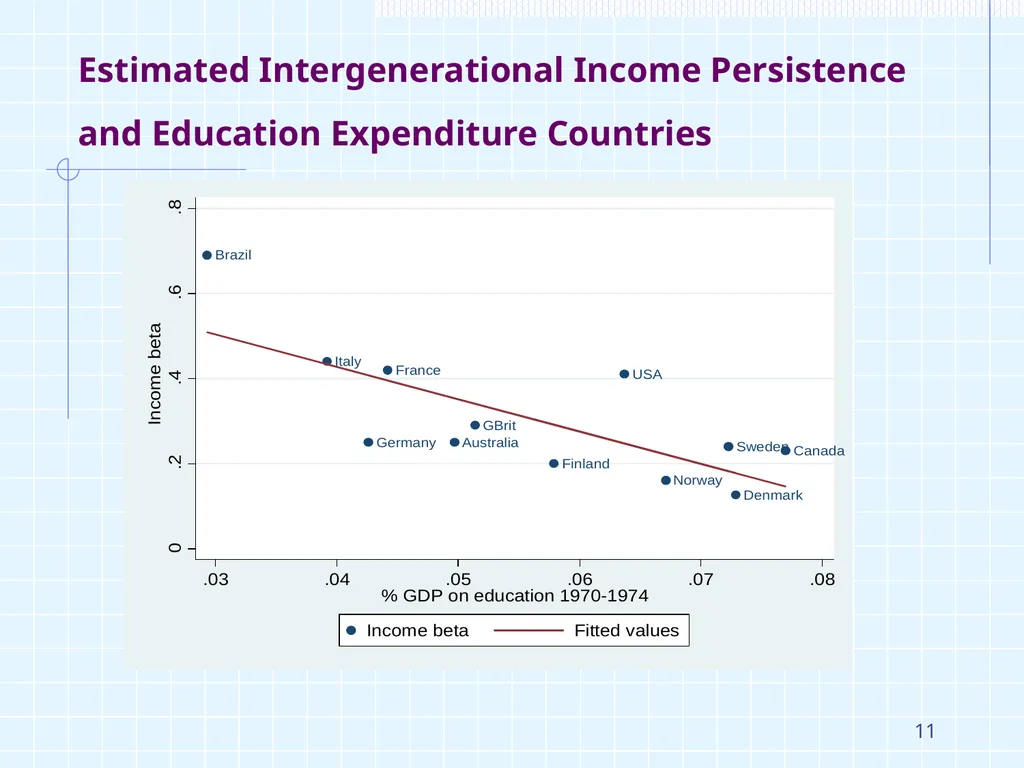
slide11. 11 Estimated Intergenerational Income Persistence and Education Expenditure Countries<br>
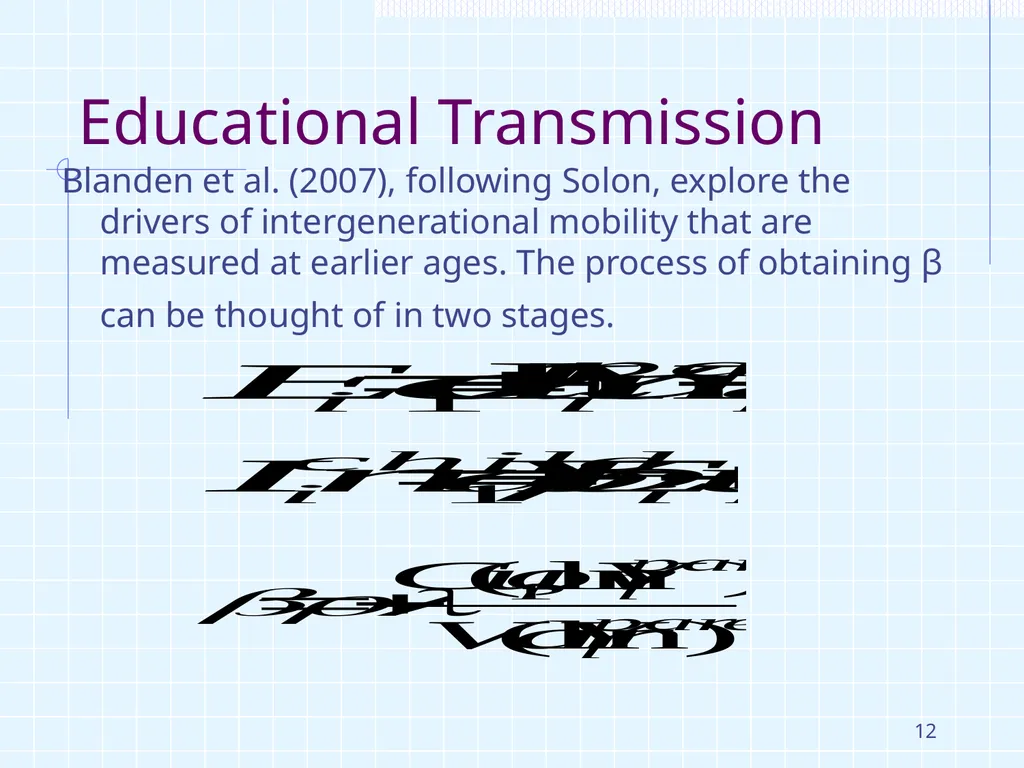
slide12. 12 Educational Transmission Blanden et al. (2007), following Solon, explore the drivers of intergenerational mobility that are measured at earlier ages. The process of obtaining β can be thought of in two stages.<br>
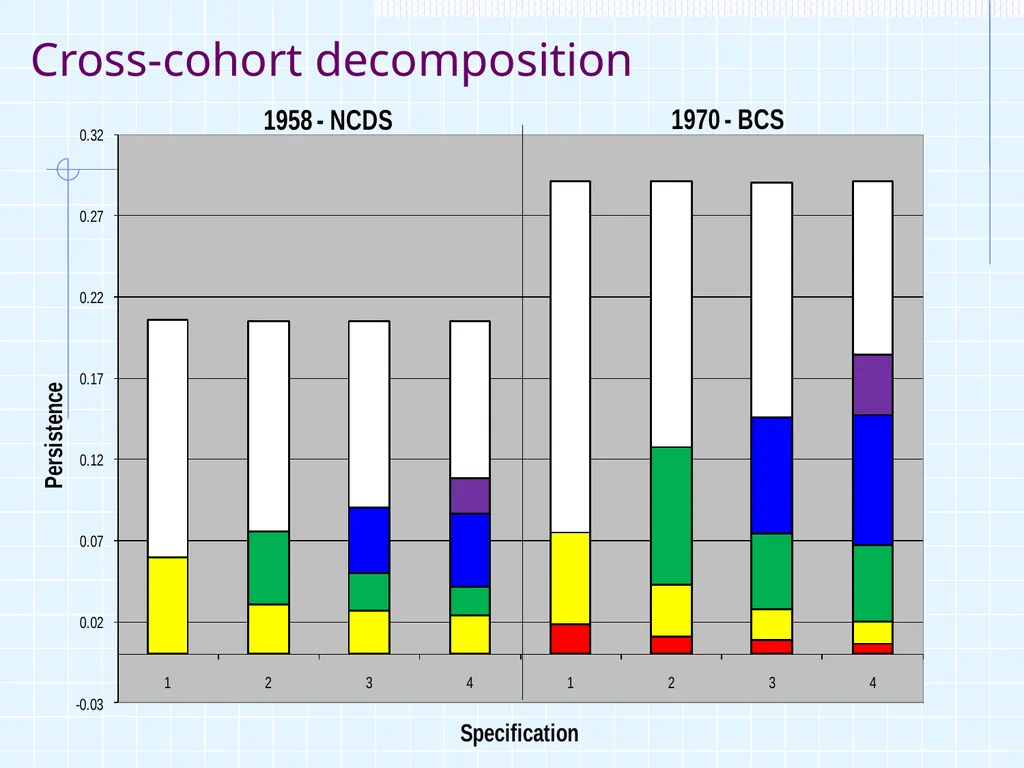
slide13. Cross-cohort decomposition<br>
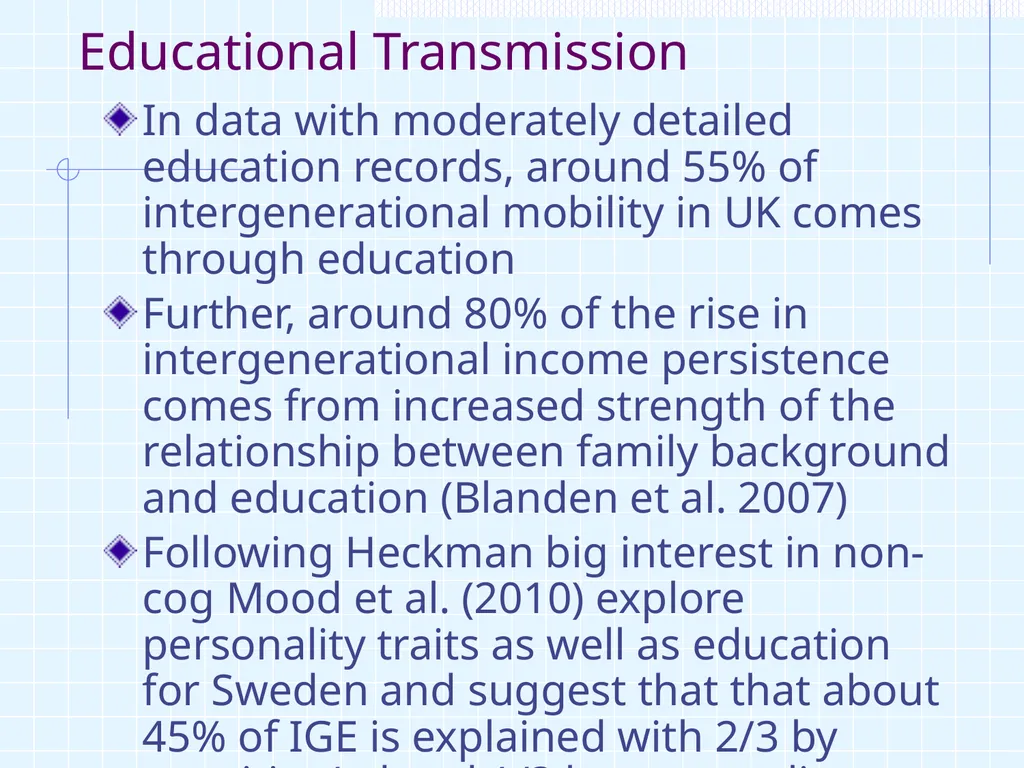
slide14. Educational Transmission In data with moderately detailed education records, around 55% of intergenerational mobility in UK comes through education
Further, around 80% of the rise in intergenerational income persistence comes from increased strength of the relationship between family background and education (Blanden et al. 2007)
Following Heckman big interest in non-cog Mood et al. (2010) explore personality traits as well as education for Sweden and suggest that that about 45% of IGE is explained with 2/3 by cognitive/ed and 1/3 by personality measures<br>
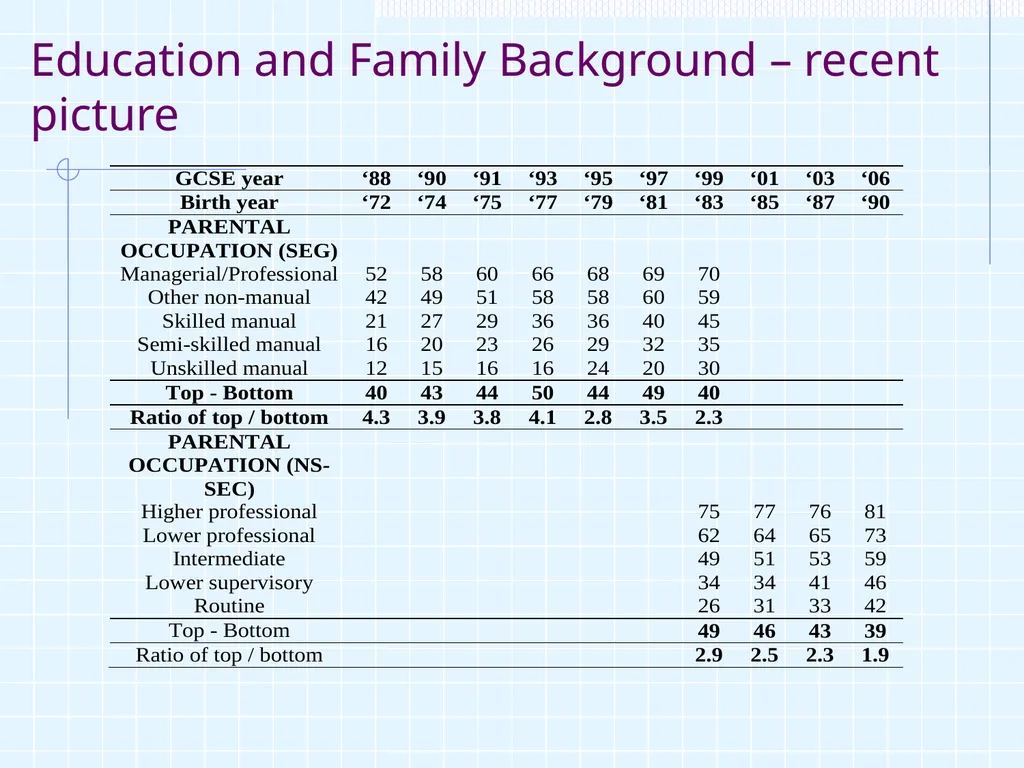
slide15. Education and Family Background – recent picture<br>
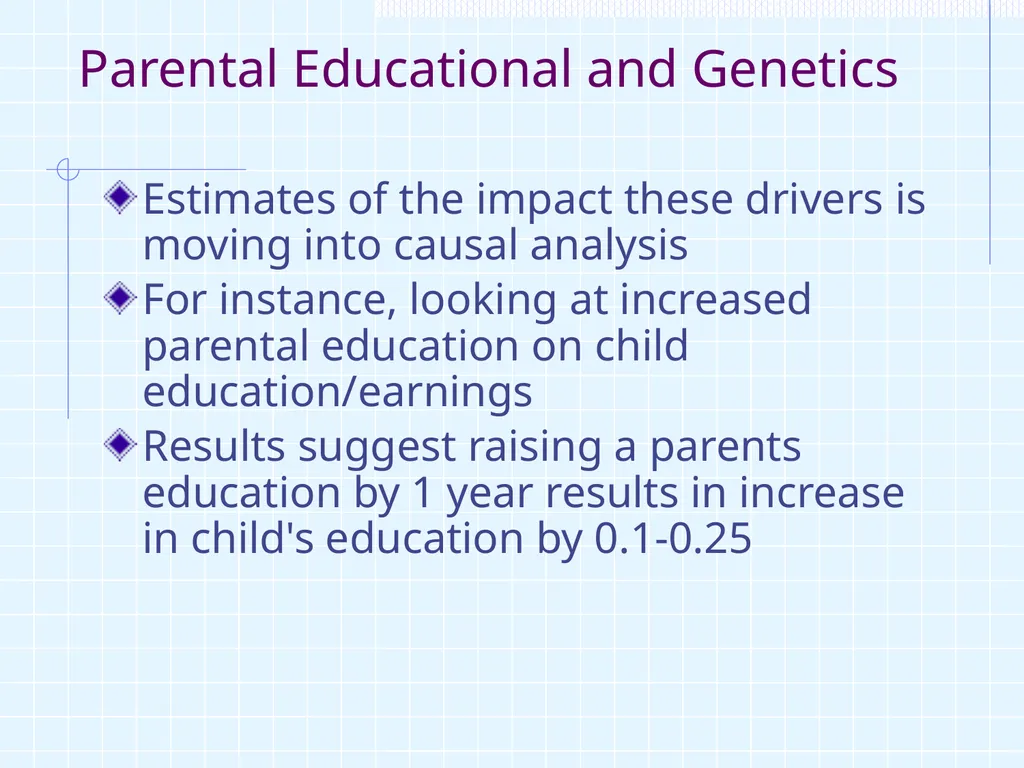
slide16. Parental Educational and Genetics Estimates of the impact these drivers is moving into causal analysis
For instance, looking at increased parental education on child education/earnings
Results suggest raising a parents education by 1 year results in increase in child's education by 0.1-0.25<br>
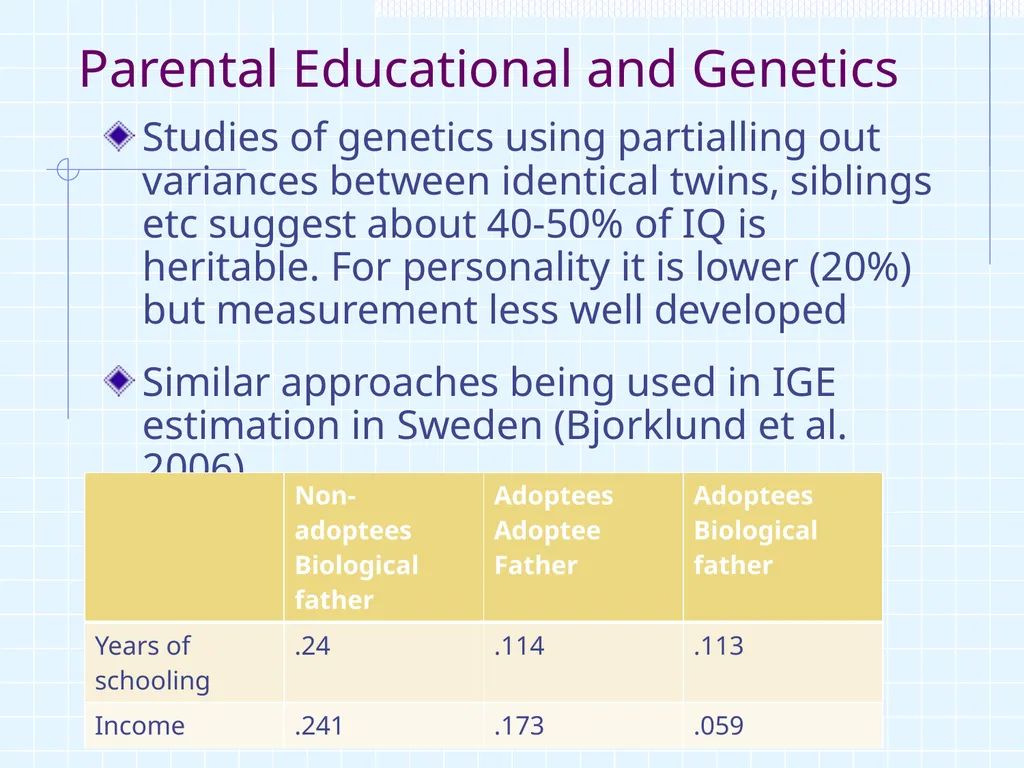
slide17. Parental Educational and Genetics Studies of genetics using partialling out variances between identical twins, siblings etc suggest about 40-50% of IQ is heritable. For personality it is lower (20%) but measurement less well developed
Similar approaches being used in IGE estimation in Sweden (Bjorklund et al. 2006)<br>
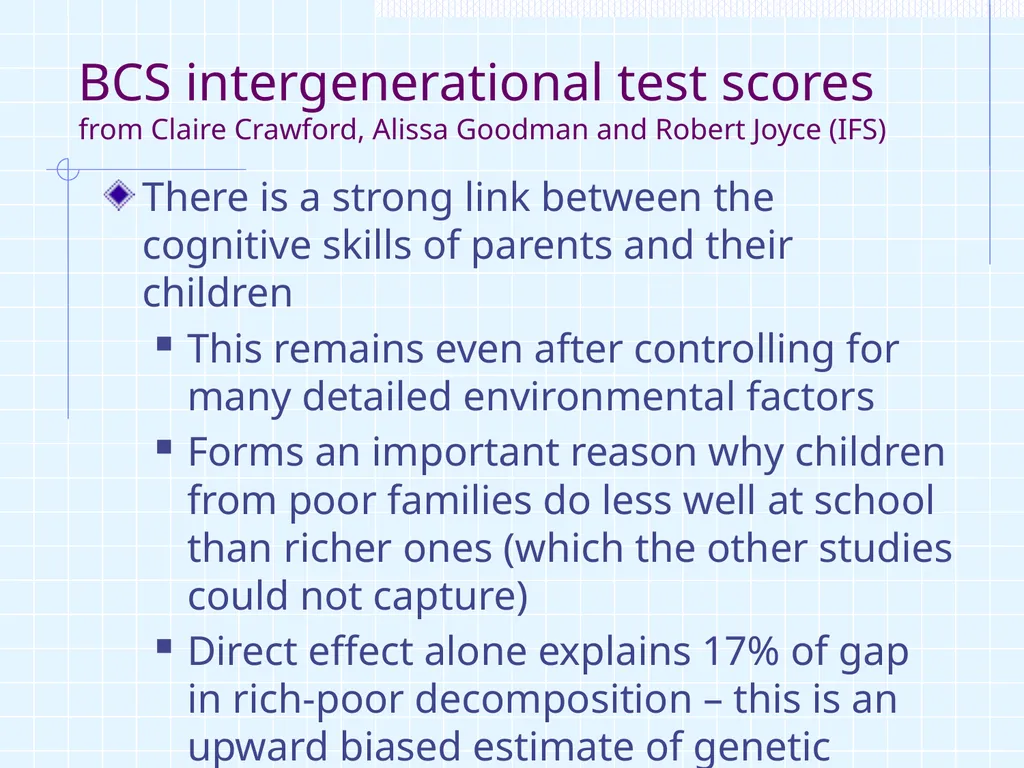
slide18. BCS intergenerational test scores from Claire Crawford, Alissa Goodman and Robert Joyce (IFS) There is a strong link between the cognitive skills of parents and their children
This remains even after controlling for many detailed environmental factors
Forms an important reason why children from poor families do less well at school than richer ones (which the other studies could not capture)
Direct effect alone explains 17% of gap in rich-poor decomposition – this is an upward biased estimate of genetic influence<br>
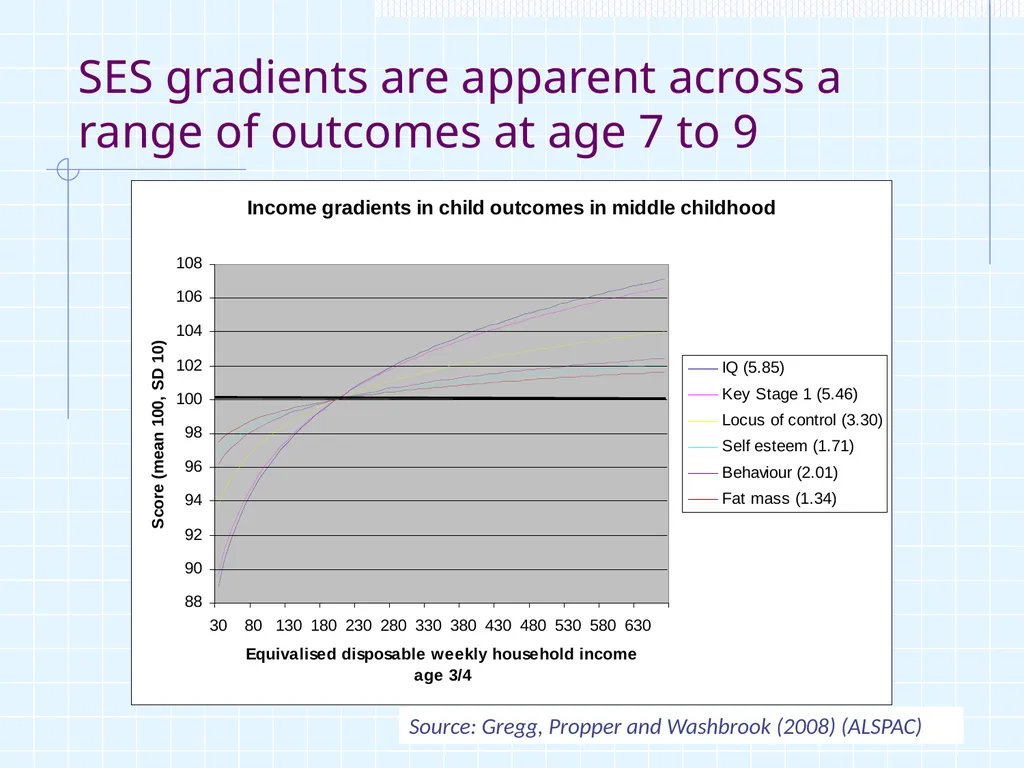
slide19. SES gradients are apparent across a range of outcomes at age 7 to 9 Source: Gregg, Propper and Washbrook (2008) (ALSPAC)<br>
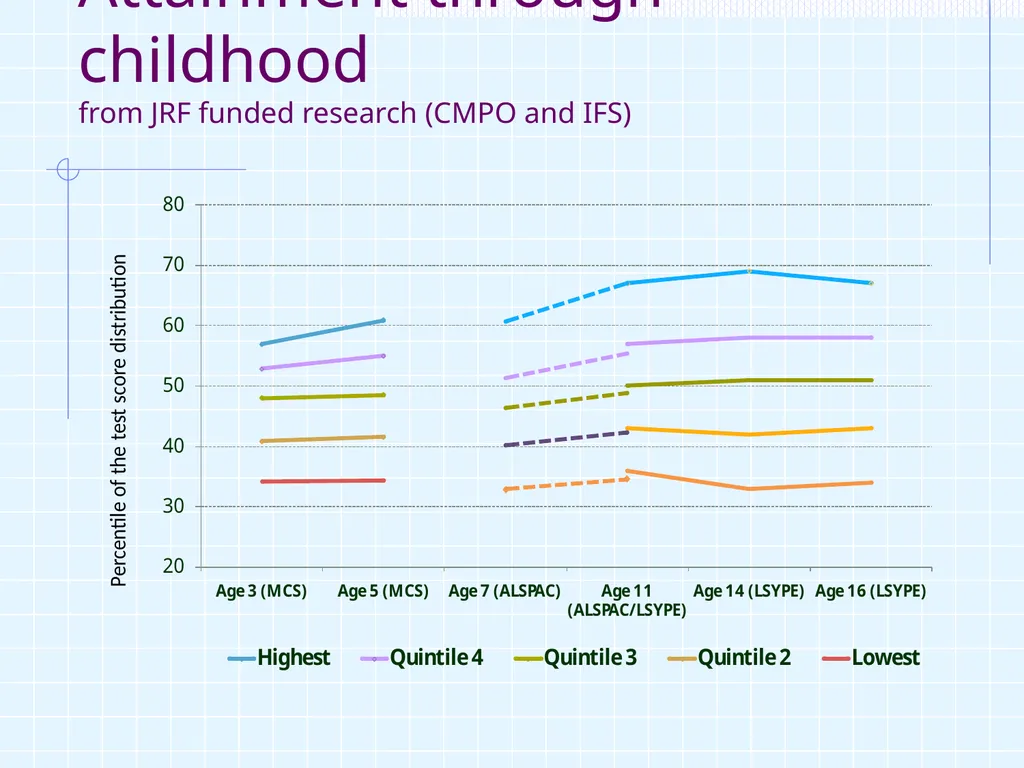
slide20. Attainment through childhood from JRF funded research (CMPO and IFS)<br>
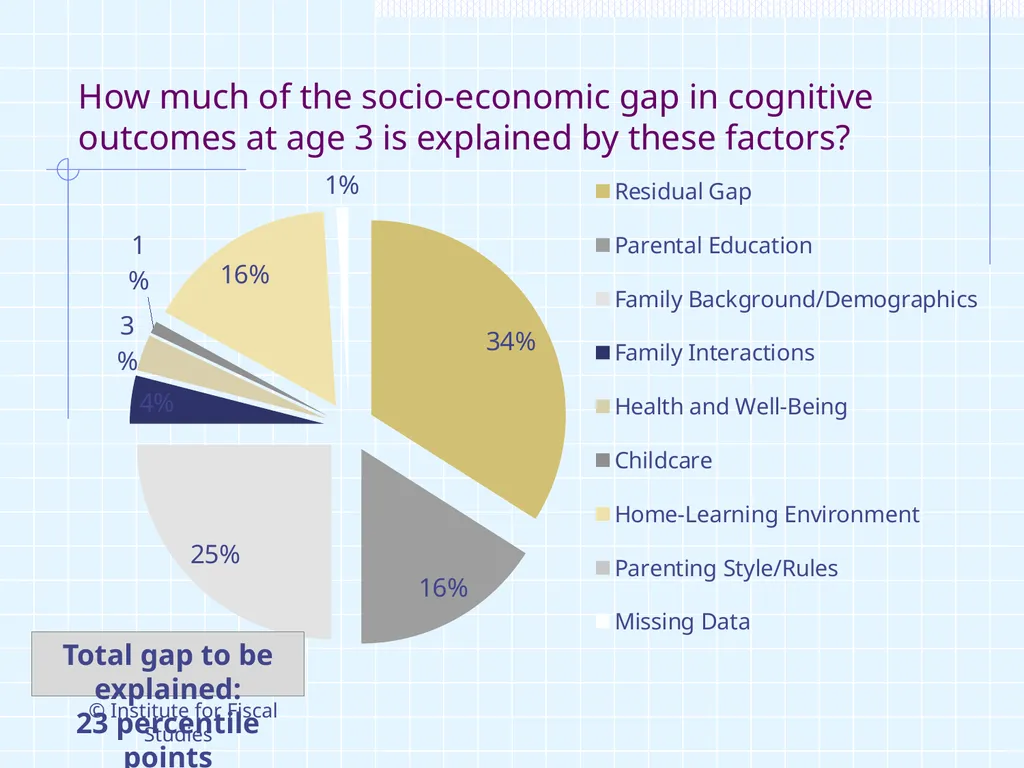
slide21. How much of the socio-economic gap in cognitive outcomes at age 3 is explained by these factors? © Institute for Fiscal Studies Total gap to be explained:
23 percentile points<br>
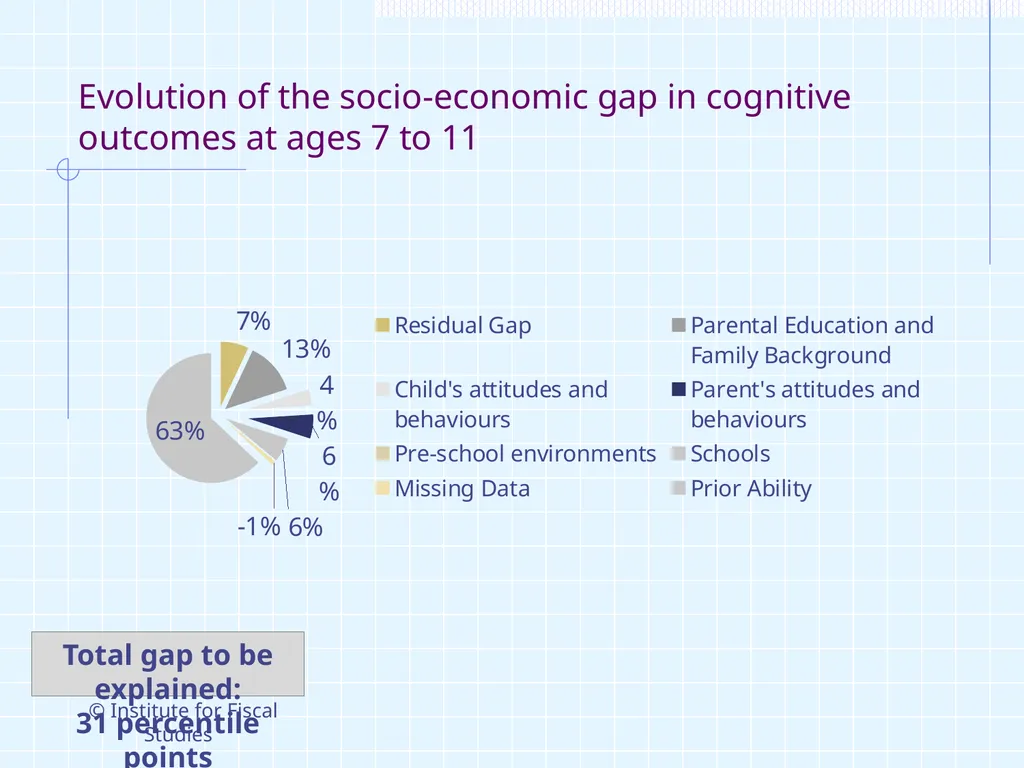
slide22. Evolution of the socio-economic gap in cognitive outcomes at ages 7 to 11 © Institute for Fiscal Studies Total gap to be explained:
31 percentile points<br>
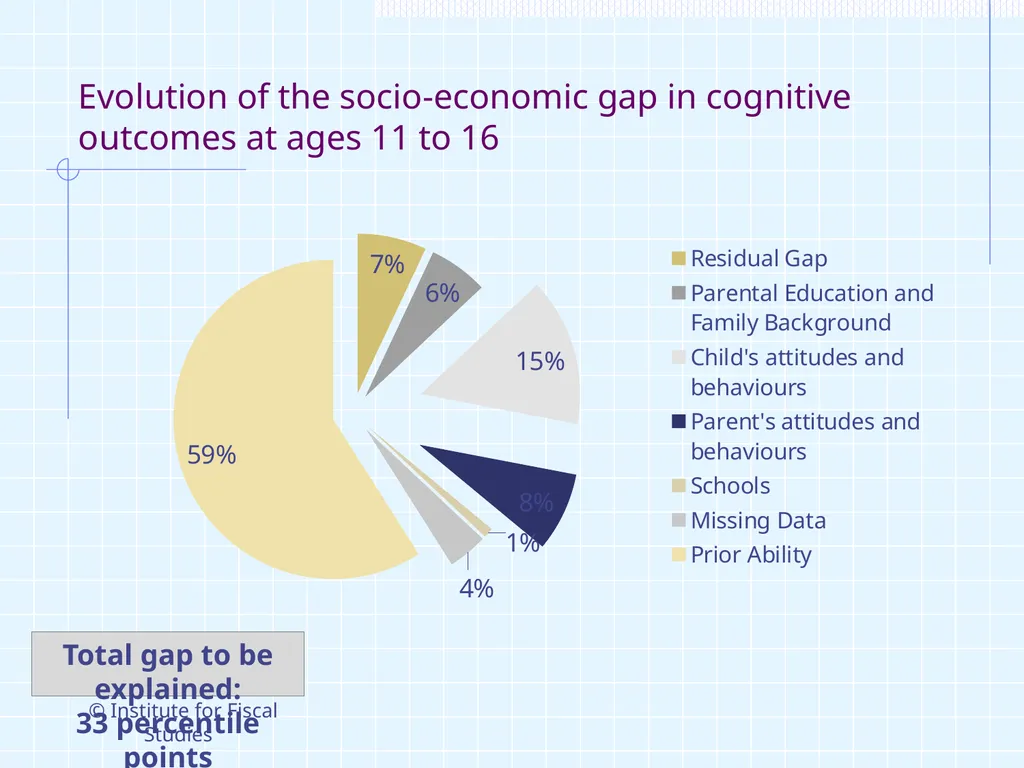
slide23. Evolution of the socio-economic gap in cognitive outcomes at ages 11 to 16 © Institute for Fiscal Studies Total gap to be explained:
33 percentile points<br>
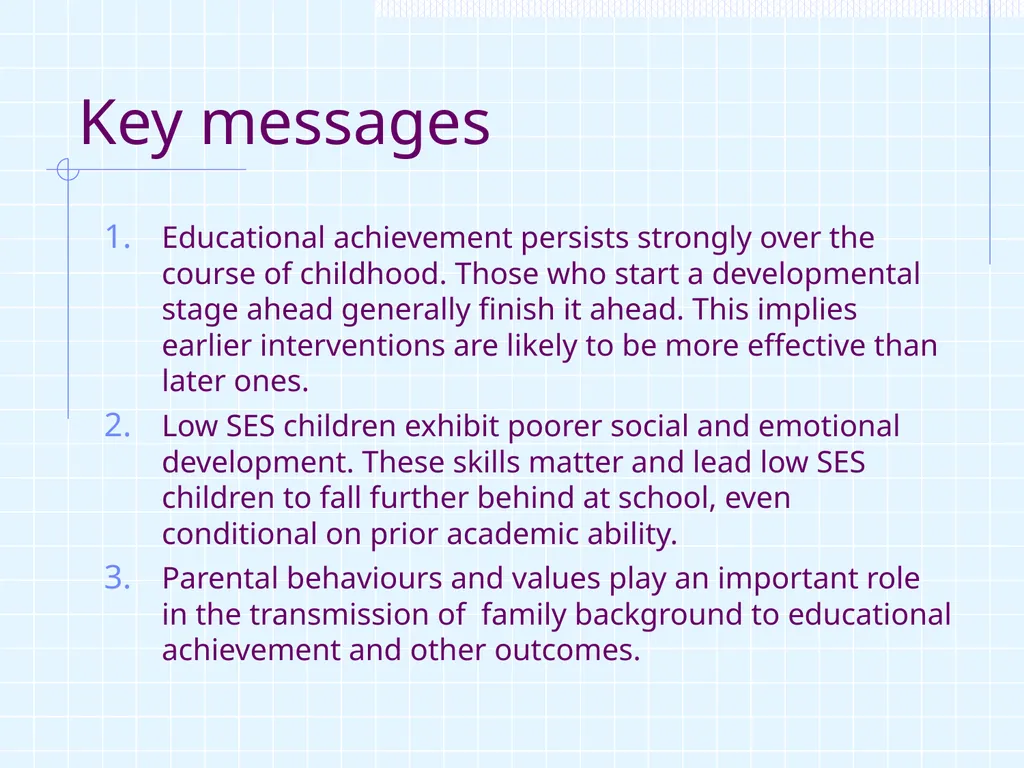
slide24. Key messages Educational achievement persists strongly over the course of childhood. Those who start a developmental stage ahead generally finish it ahead. This implies earlier interventions are likely to be more effective than later ones.
Low SES children exhibit poorer social and emotional development. These skills matter and lead low SES children to fall further behind at school, even conditional on prior academic ability.
Parental behaviours and values play an important role in the transmission of family background to educational achievement and other outcomes.<br>
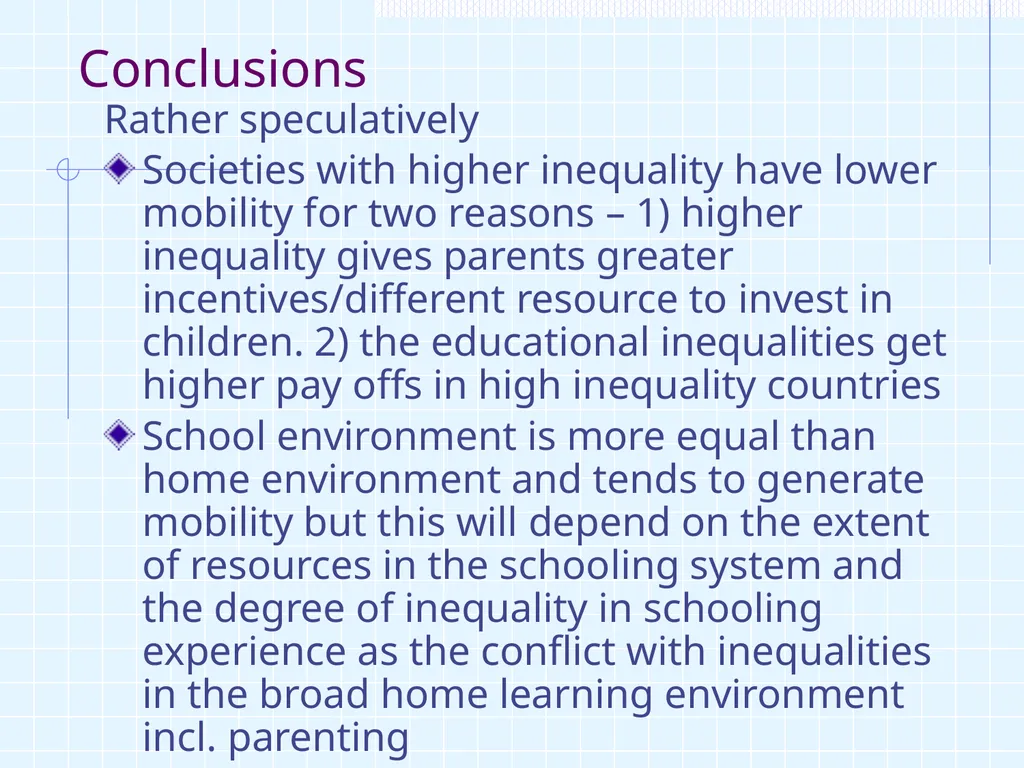
slide25. Conclusions Rather speculatively
Societies with higher inequality have lower mobility for two reasons – 1) higher inequality gives parents greater incentives/different resource to invest in children. 2) the educational inequalities get higher pay offs in high inequality countries
School environment is more equal than home environment and tends to generate mobility but this will depend on the extent of resources in the schooling system and the degree of inequality in schooling experience as the conflict with inequalities in the broad home learning environment incl. parenting<br>
slide26. Additional slides<br>
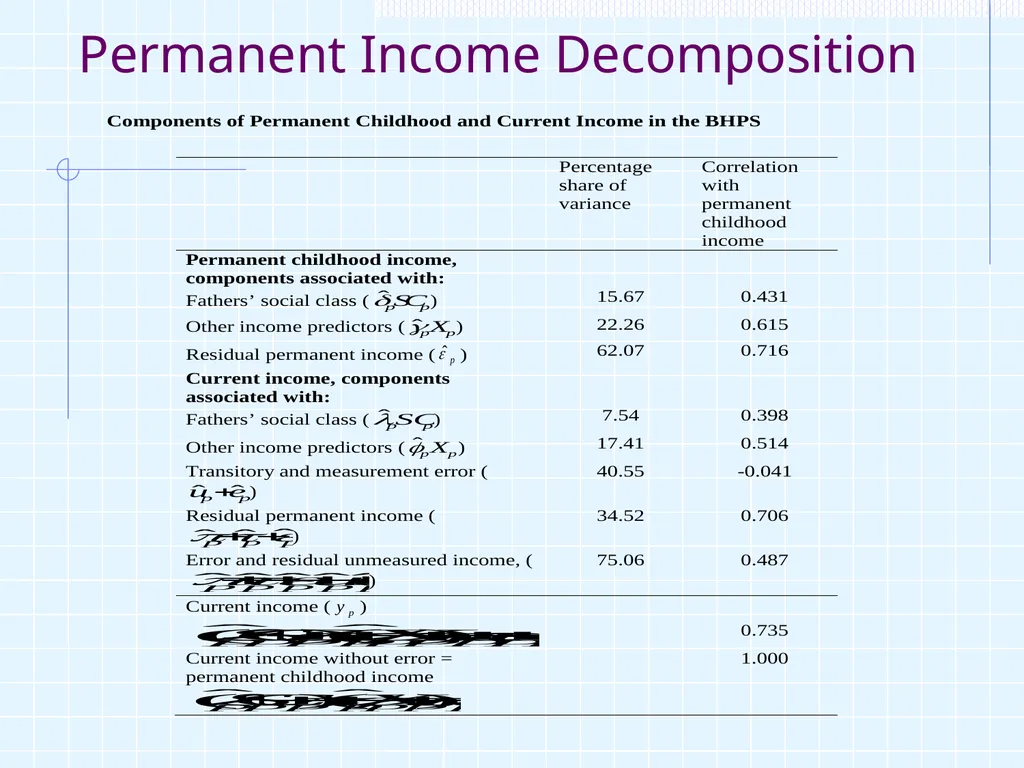
slide27. Permanent Income Decomposition<br>
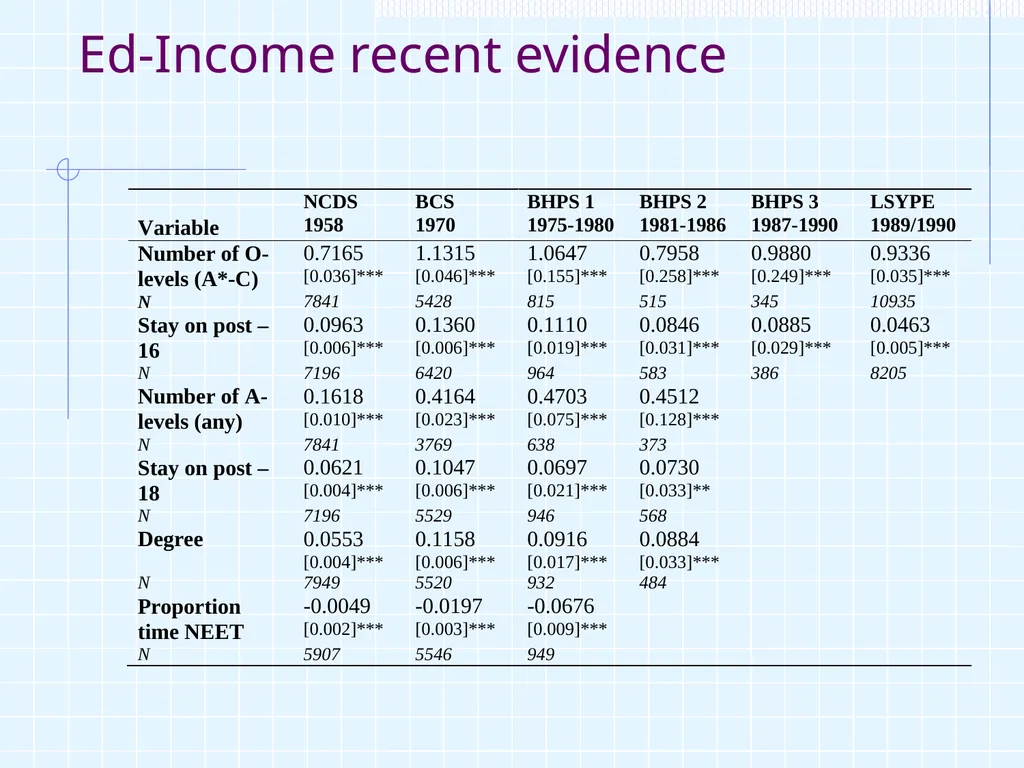
slide28. Ed-Income recent evidence<br>
Paul Gregg Presentation to IFS Poverty Review Workshop
7th Sept 2010<br>
slide2. 2 Introduction & Background “Most people are willing to accept wide inequalities if they are coupled with equality of opportunities” – The Economist (Oct 2006)
High profile policy area – previous gmt addressed both poverty and life chances and saw them as inherently linked but is new gmt decoupling them?<br>
slide3. 3 Introduction & Background Intergenerational mobility has been widely studied using Income, Education and Social Class
But in a wider sense covers Social Gradients in children‘s life chances – how life chances differ by a measure of (permanent) social background
e.g. Marmot commission highlighting extent of social gradients in physical and mental health and how these emerge in childhood<br>
slide4. Concepts Original concept of Intergenerational Earnings mobility is ideally comparison of life time (permanent) earnings of father and sons
This is very data intensive so shorter tem earnings measures used
More recently the question has shifted towards childhood experience and later life chances which has shifted emphasis toward family income in childhood
This also allows for absentee fathers which varies across cohorts in a non-random way<br>
slide5. Methodology – Income based Intergenerational Income Mobility<br>
slide6. Measurement I Early earnings based research had highlight high levels of mobility but concerns raised over biases generated by measurement error and life cycle stage
So using American data NLSY single period income = 0.32, average over 3 periods = 0.45 implies true estimate = 0.54
Life cycle bias comes from the age(s) at which earnings are measured and how good a proxy they are for lifetime earnings
When earnings is measured early or late in life course it is a less good proxy for lifetime earnings (optimal is at about 40)<br>
slide7. Life Cycle bias in UK<br>
slide8. Poverty Income mobility and intergenerational poverty are not the same thing
Blanden and Gibbons suggest the odds risk for poor children being poor adults rose from twice that of non-poor children to 3.5+ times between the NCDS and BCS cohorts
All this work asks what happens to poor children not who become the poor parents in the next generation – including who has children from the earnings/employment distribution<br>
slide9. Education/Inequality/Genes The recent literature has been looking at the key patterns of mobility and beginning to look at the drivers
Whether mobility is high or low needs a benchmark so international comparisons and changes across time in countries have been widely investigated
A natural next step was to explore how these patterns match on to inequality and education (for example Blanden, 2009)<br>
slide10. 10 Estimated Intergenerational Income Persistence and Income Inequality Across Countries<br>
slide11. 11 Estimated Intergenerational Income Persistence and Education Expenditure Countries<br>
slide12. 12 Educational Transmission Blanden et al. (2007), following Solon, explore the drivers of intergenerational mobility that are measured at earlier ages. The process of obtaining β can be thought of in two stages.<br>
slide13. Cross-cohort decomposition<br>
slide14. Educational Transmission In data with moderately detailed education records, around 55% of intergenerational mobility in UK comes through education
Further, around 80% of the rise in intergenerational income persistence comes from increased strength of the relationship between family background and education (Blanden et al. 2007)
Following Heckman big interest in non-cog Mood et al. (2010) explore personality traits as well as education for Sweden and suggest that that about 45% of IGE is explained with 2/3 by cognitive/ed and 1/3 by personality measures<br>
slide15. Education and Family Background – recent picture<br>
slide16. Parental Educational and Genetics Estimates of the impact these drivers is moving into causal analysis
For instance, looking at increased parental education on child education/earnings
Results suggest raising a parents education by 1 year results in increase in child's education by 0.1-0.25<br>
slide17. Parental Educational and Genetics Studies of genetics using partialling out variances between identical twins, siblings etc suggest about 40-50% of IQ is heritable. For personality it is lower (20%) but measurement less well developed
Similar approaches being used in IGE estimation in Sweden (Bjorklund et al. 2006)<br>
slide18. BCS intergenerational test scores from Claire Crawford, Alissa Goodman and Robert Joyce (IFS) There is a strong link between the cognitive skills of parents and their children
This remains even after controlling for many detailed environmental factors
Forms an important reason why children from poor families do less well at school than richer ones (which the other studies could not capture)
Direct effect alone explains 17% of gap in rich-poor decomposition – this is an upward biased estimate of genetic influence<br>
slide19. SES gradients are apparent across a range of outcomes at age 7 to 9 Source: Gregg, Propper and Washbrook (2008) (ALSPAC)<br>
slide20. Attainment through childhood from JRF funded research (CMPO and IFS)<br>
slide21. How much of the socio-economic gap in cognitive outcomes at age 3 is explained by these factors? © Institute for Fiscal Studies Total gap to be explained:
23 percentile points<br>
slide22. Evolution of the socio-economic gap in cognitive outcomes at ages 7 to 11 © Institute for Fiscal Studies Total gap to be explained:
31 percentile points<br>
slide23. Evolution of the socio-economic gap in cognitive outcomes at ages 11 to 16 © Institute for Fiscal Studies Total gap to be explained:
33 percentile points<br>
slide24. Key messages Educational achievement persists strongly over the course of childhood. Those who start a developmental stage ahead generally finish it ahead. This implies earlier interventions are likely to be more effective than later ones.
Low SES children exhibit poorer social and emotional development. These skills matter and lead low SES children to fall further behind at school, even conditional on prior academic ability.
Parental behaviours and values play an important role in the transmission of family background to educational achievement and other outcomes.<br>
slide25. Conclusions Rather speculatively
Societies with higher inequality have lower mobility for two reasons – 1) higher inequality gives parents greater incentives/different resource to invest in children. 2) the educational inequalities get higher pay offs in high inequality countries
School environment is more equal than home environment and tends to generate mobility but this will depend on the extent of resources in the schooling system and the degree of inequality in schooling experience as the conflict with inequalities in the broad home learning environment incl. parenting<br>
slide26. Additional slides<br>
slide27. Permanent Income Decomposition<br>
slide28. Ed-Income recent evidence<br>