1 Objectives Understand the likelihood of events using a probability scale Calculate simple probability as a fraction, decimal or percentage, including from a table Identify and correct common misconceptions Lesson 12: Probability Level 1 2
"1 Objectives Understand the likelihood of events" is the property of its rightful owner. Permission is granted to
download and print the materials on this website for personal, non-commercial use only, and to display it
on your personal computer provided you do not modify the materials and that you retain all copyright
notices contained in the materials. By downloading content from our website, you accept the terms of this
agreement.
Presentation Transcript
01
1 Objectives
Understand the likelihood of events using a probability scale
Calculate simple probability as a fraction, decimal or percentage, including from a table
Identify and correct common misconceptions Lesson 12: Probability
Level 1<br>
02
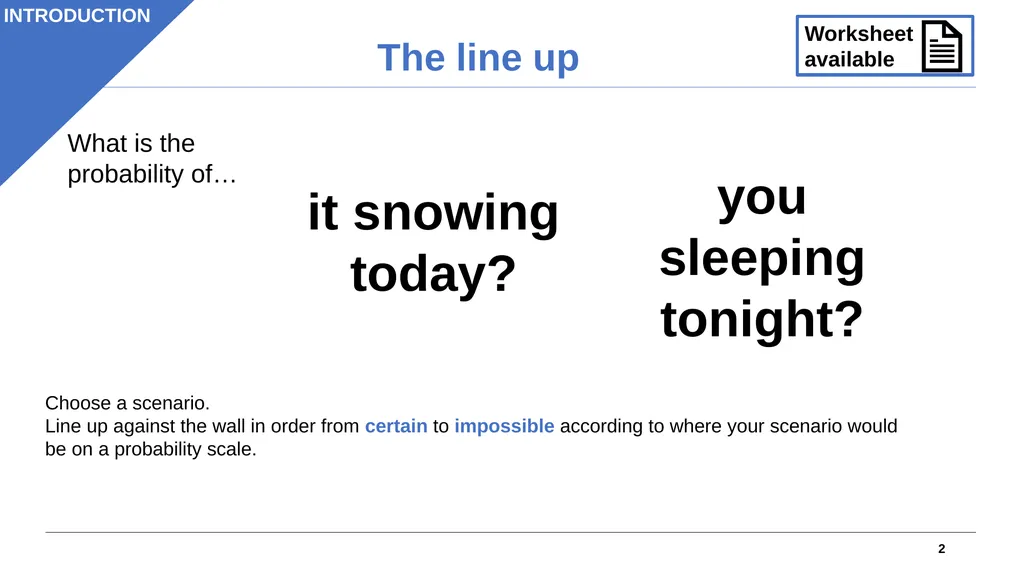
2 The line up Choose a scenario.
Line up against the wall in order from certain to impossible according to where your scenario would be on a probability scale. What is the probability of… it snowing today? you sleeping tonight?<br>
03
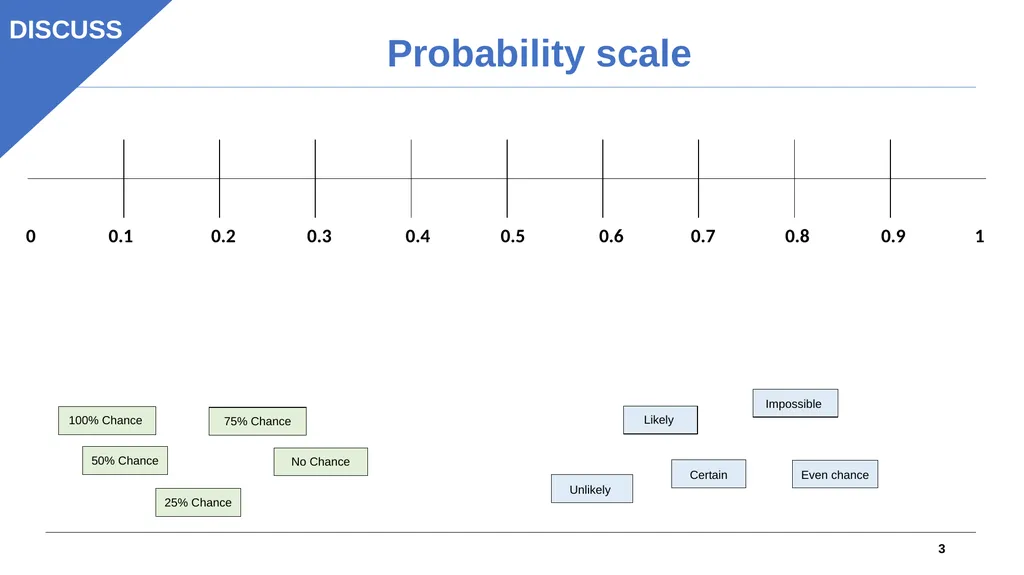
3 Probability scale 100% Chance 50% Chance 75% Chance 25% Chance No Chance Unlikely Likely Certain Even chance Impossible<br>
04
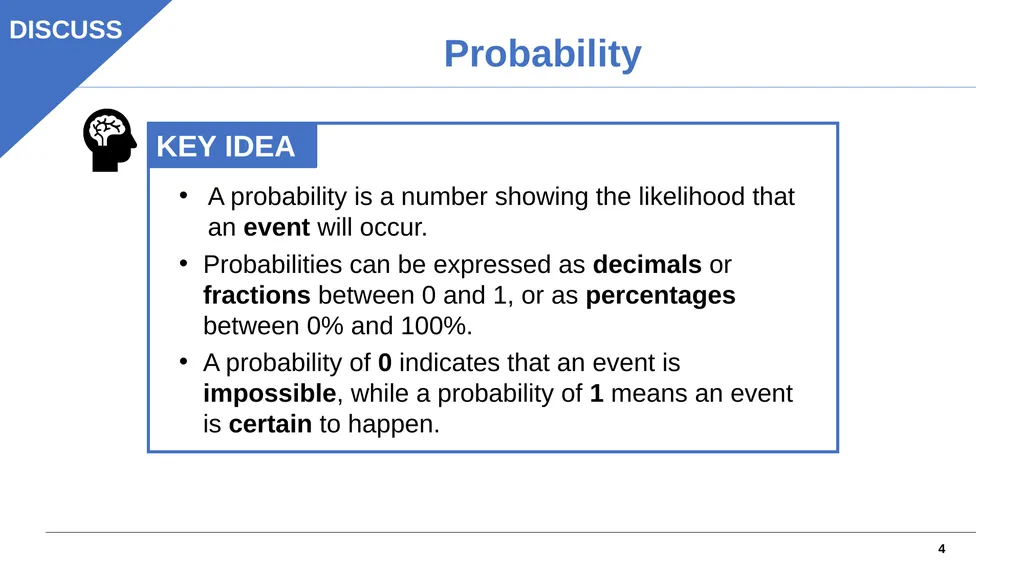
4 Probability A probability is a number showing the likelihood that an event will occur.
Probabilities can be expressed as decimals or fractions between 0 and 1, or as percentages between 0% and 100%.
A probability of 0 indicates that an event is impossible, while a probability of 1 means an event is certain to happen.<br>
05
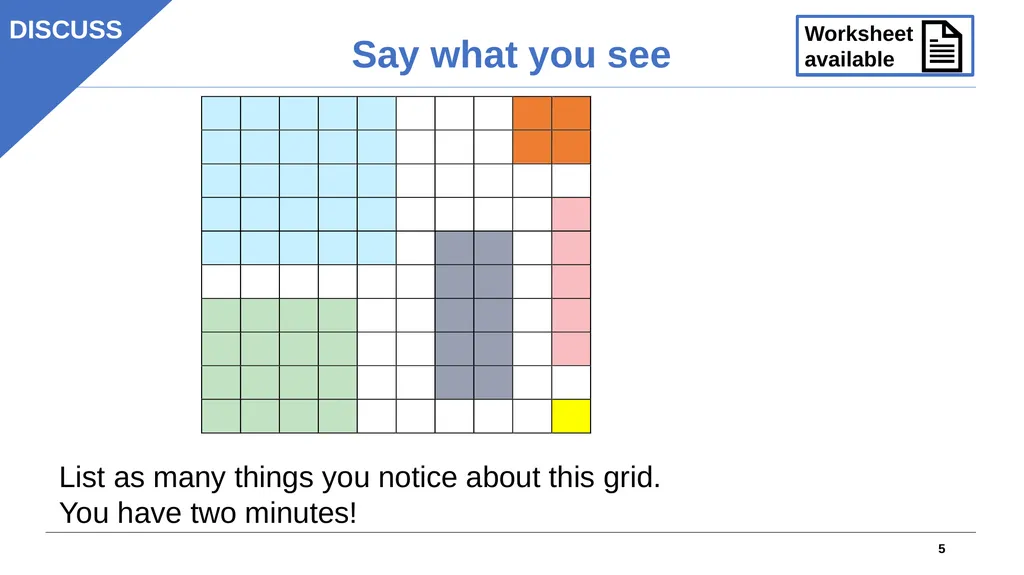
5 Say what you see List as many things you notice about this grid.
You have two minutes!<br>
06
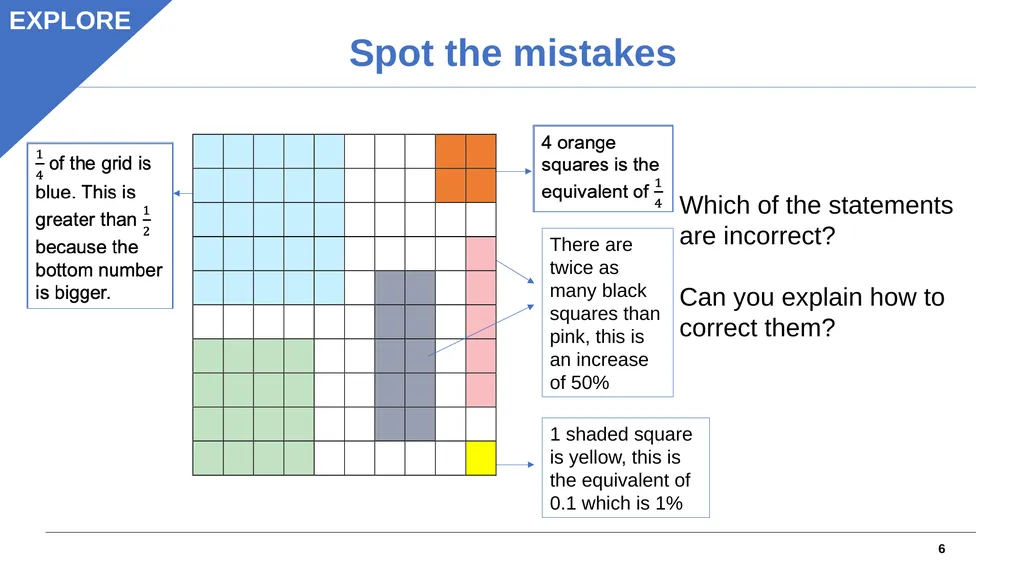
6 Spot the mistakes 1 shaded square is yellow, this is the equivalent of 0.1 which is 1% There are twice as many black squares than pink, this is an increase of 50% Which of the statements are incorrect?
Can you explain how to correct them?<br>
07
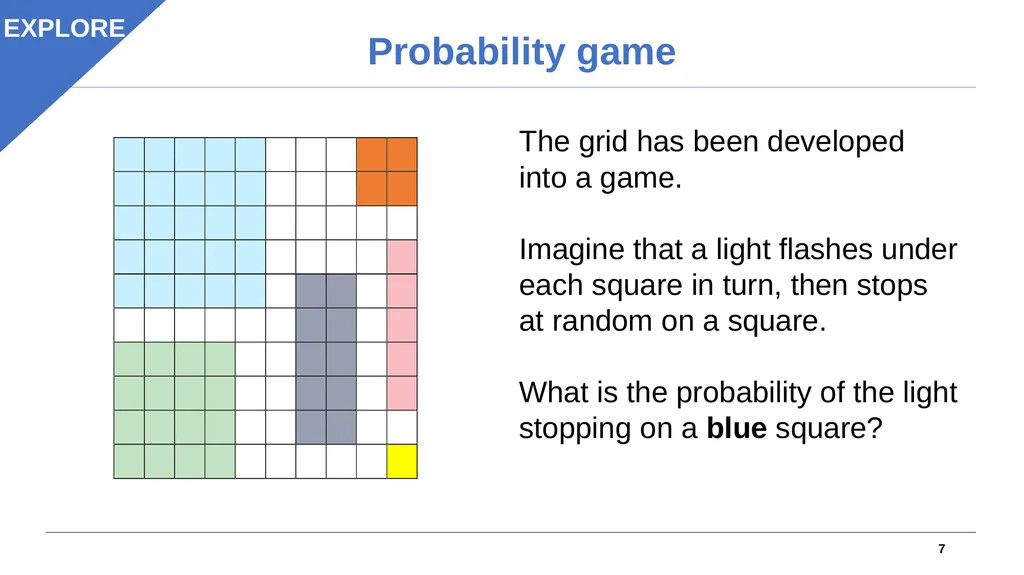
7 Probability game The grid has been developed into a game.
Imagine that a light flashes under each square in turn, then stops at random on a square.
What is the probability of the light stopping on a blue square? EXPLORE<br>
08
8 Writing questions YOUR
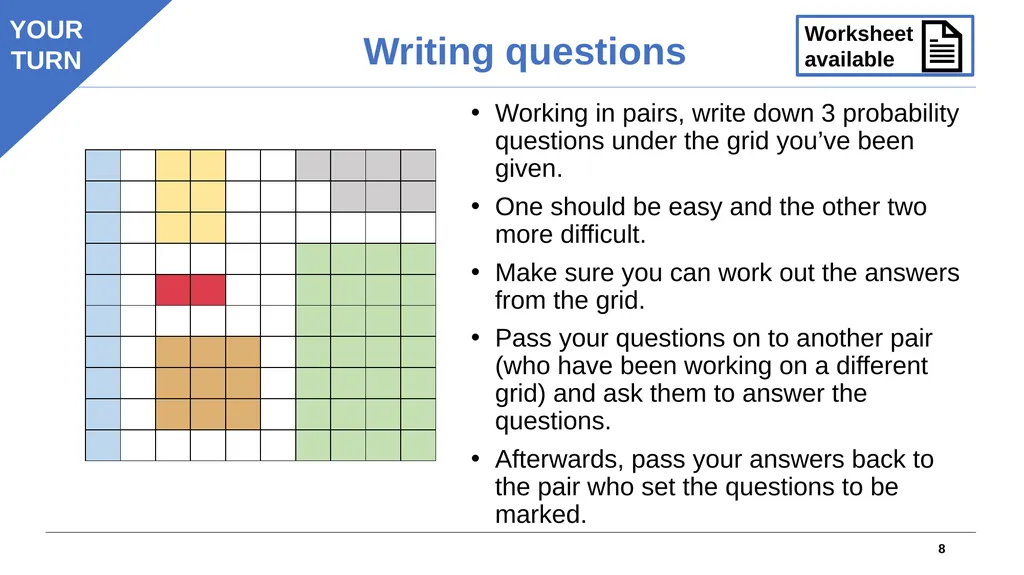
TURN Working in pairs, write down 3 probability questions under the grid you’ve been given.
One should be easy and the other two more difficult.
Make sure you can work out the answers from the grid.
Pass your questions on to another pair (who have been working on a different grid) and ask them to answer the questions.
Afterwards, pass your answers back to the pair who set the questions to be marked.<br>
09
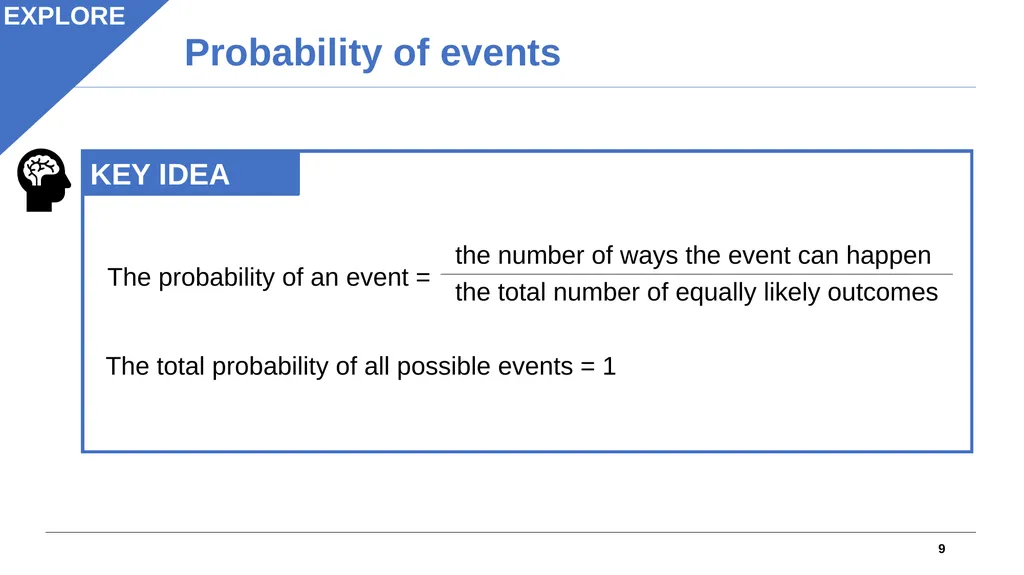
9 Probability of events the number of ways the event can happen
the total number of equally likely outcomes
The total probability of all possible events = 1 EXPLORE The probability of an event =<br>
10
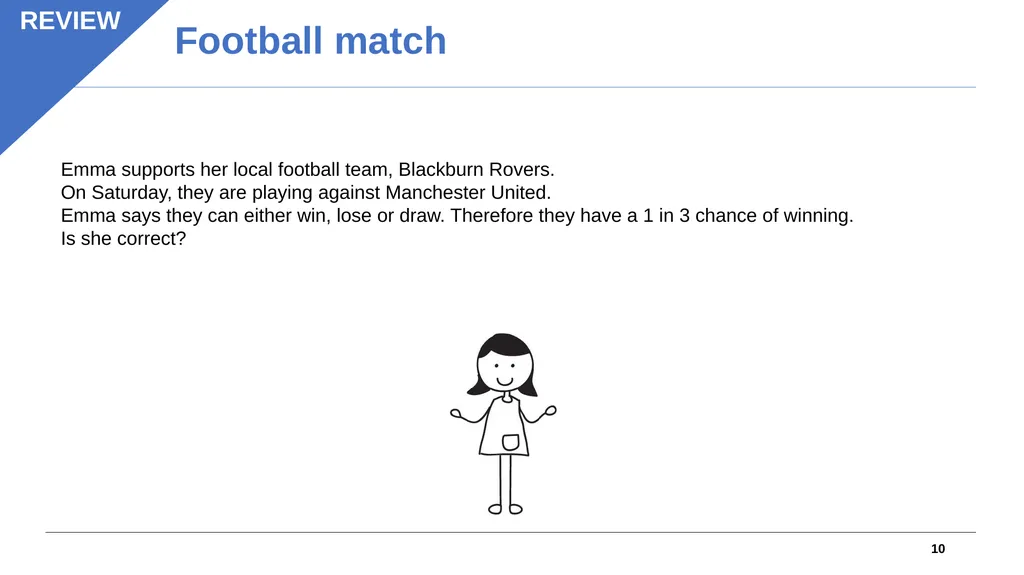
Emma supports her local football team, Blackburn Rovers.
On Saturday, they are playing against Manchester United.
Emma says they can either win, lose or draw. Therefore they have a 1 in 3 chance of winning.
Is she correct? 10 Football match REVIEW<br>
11
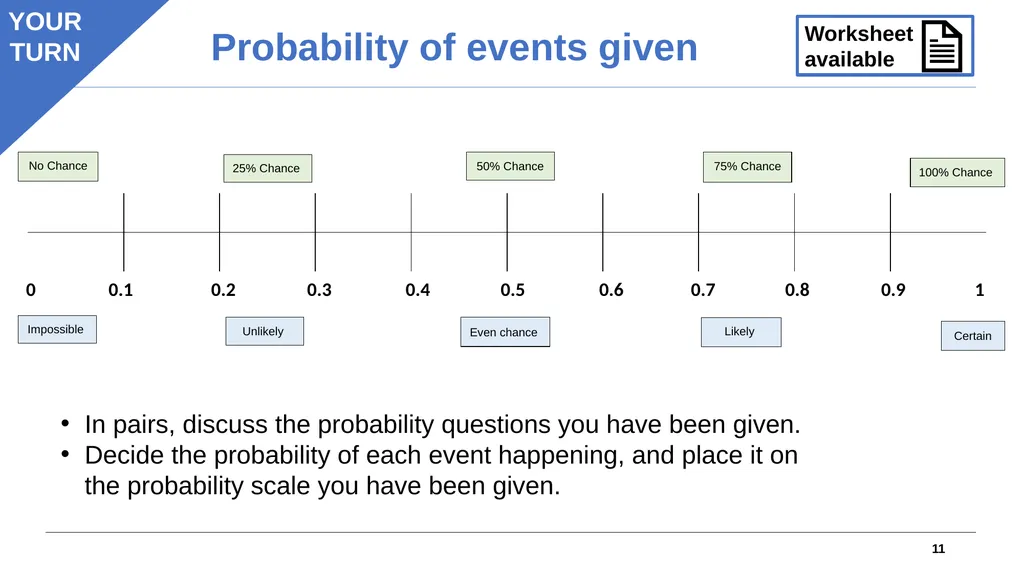
11 Probability of events given 100% Chance 50% Chance 75% Chance 25% Chance No Chance Unlikely Likely Certain Even chance Impossible YOUR
TURN In pairs, discuss the probability questions you have been given.
Decide the probability of each event happening, and place it on the probability scale you have been given.<br>
12
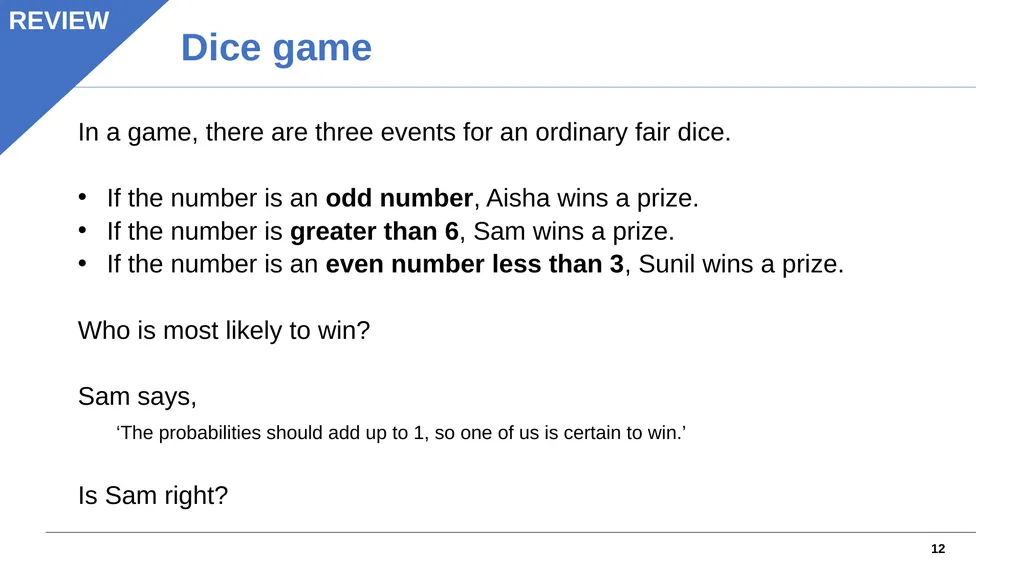
12 Dice game In a game, there are three events for an ordinary fair dice.
If the number is an odd number, Aisha wins a prize.
If the number is greater than 6, Sam wins a prize.
If the number is an even number less than 3, Sunil wins a prize.
Who is most likely to win?
Sam says,
‘The probabilities should add up to 1, so one of us is certain to win.’
Is Sam right? REVIEW<br>
13
13 Sum of all possible events The total probability of all possible events = 1<br>
14
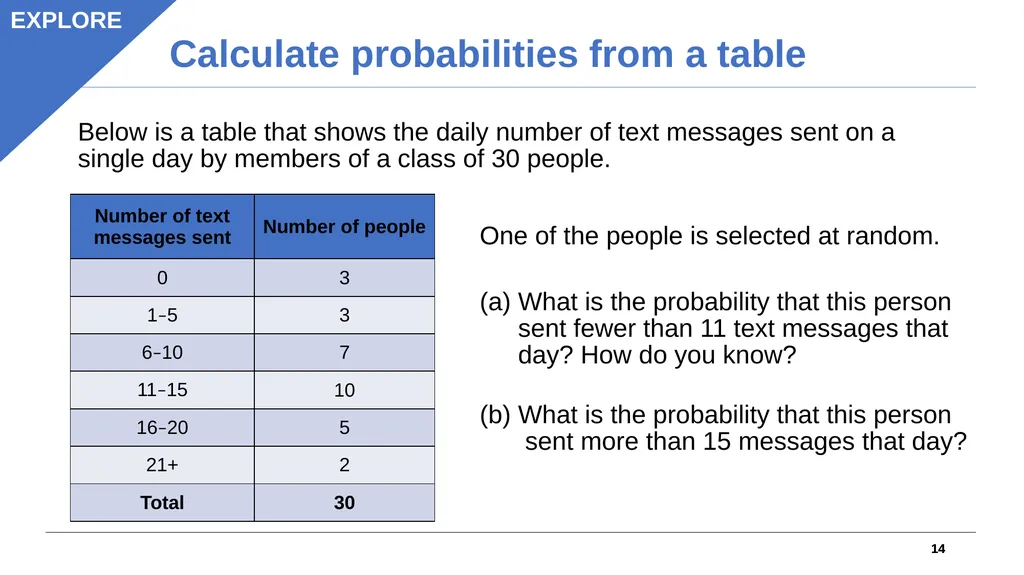
14 Calculate probabilities from a table 14 Below is a table that shows the daily number of text messages sent on a single day by members of a class of 30 people. One of the people is selected at random.
What is the probability that this person sent fewer than 11 text messages that day? How do you know?
What is the probability that this person sent more than 15 messages that day? EXPLORE<br>
15
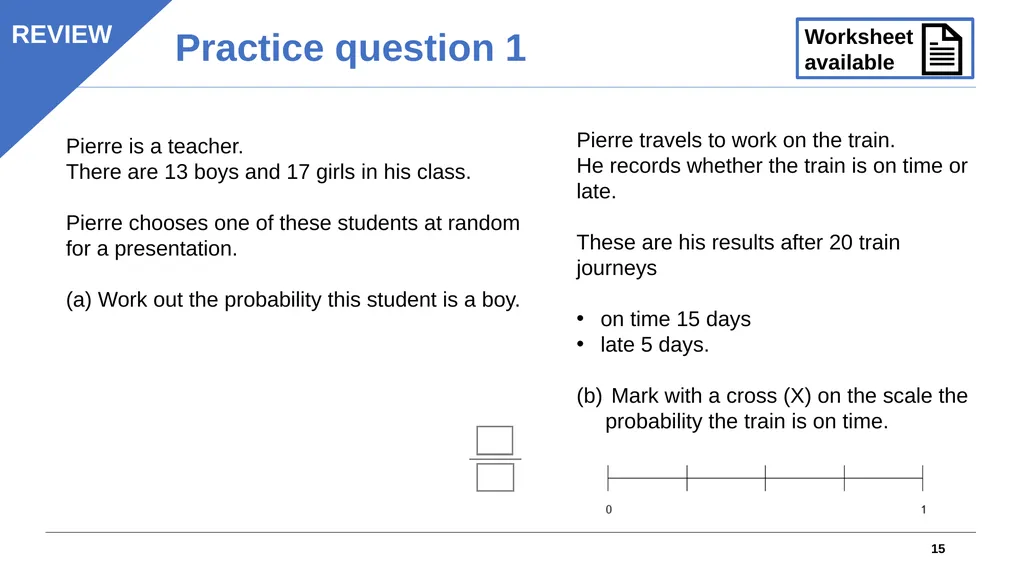
15 Practice question 1 REVIEW Pierre is a teacher.
There are 13 boys and 17 girls in his class.
Pierre chooses one of these students at random for a presentation.
(a) Work out the probability this student is a boy. Pierre travels to work on the train.
He records whether the train is on time or late.
These are his results after 20 train journeys
on time 15 days
late 5 days.
Mark with a cross (X) on the scale the probability the train is on time.<br>
16
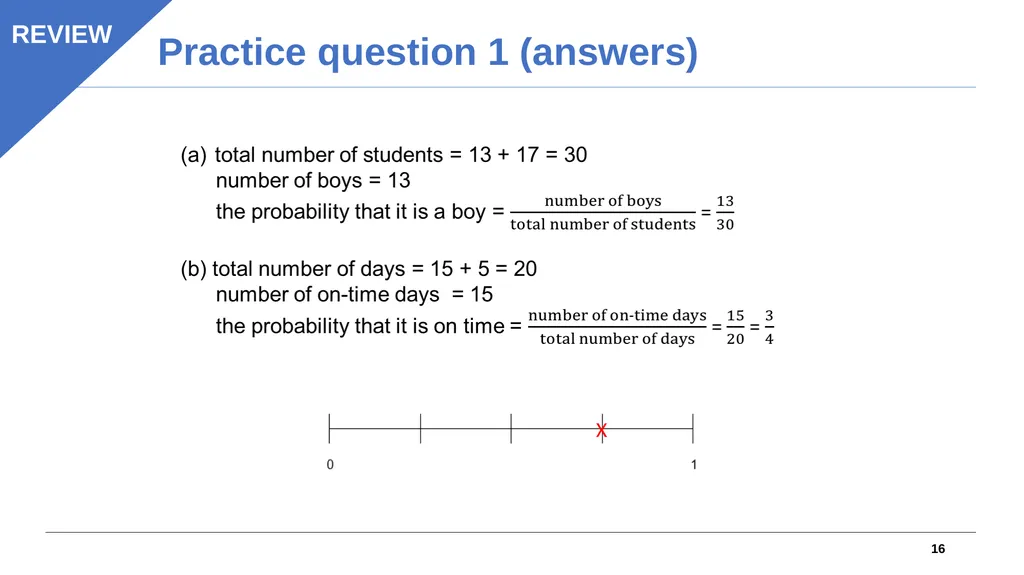
16 Practice question 1 (answers) REVIEW X<br>
17
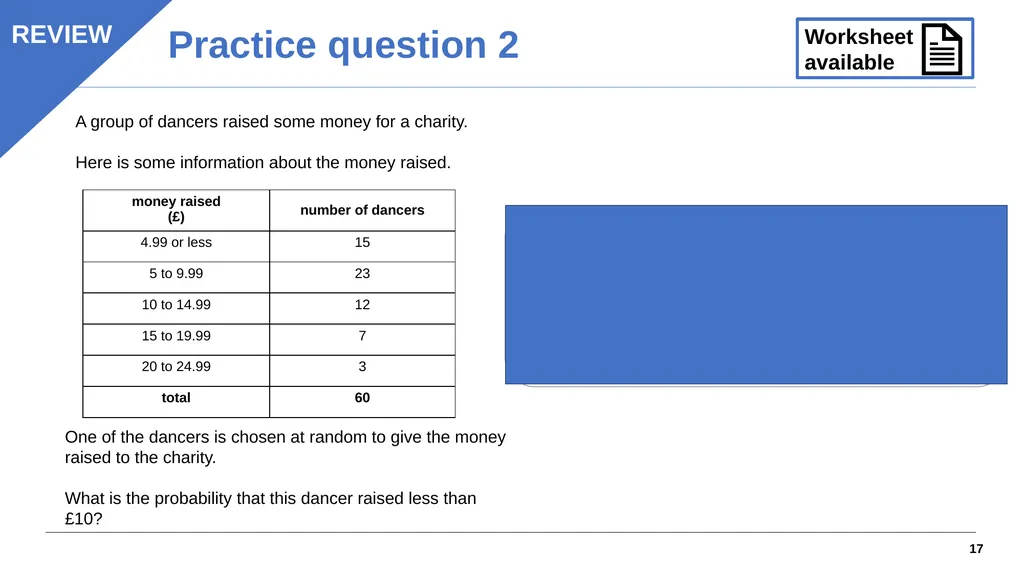
17 Practice question 2 REVIEW A group of dancers raised some money for a charity.
Here is some information about the money raised. One of the dancers is chosen at random to give the money raised to the charity.
What is the probability that this dancer raised less than £10?<br>
18
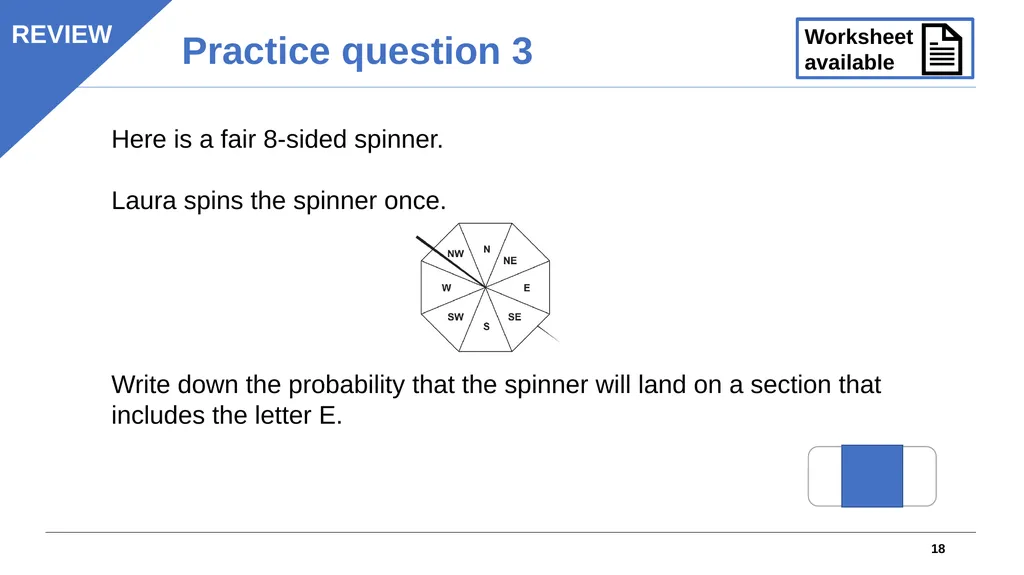
18 Practice question 3 REVIEW Here is a fair 8-sided spinner.
Laura spins the spinner once.
Write down the probability that the spinner will land on a section that includes the letter E.<br>
19
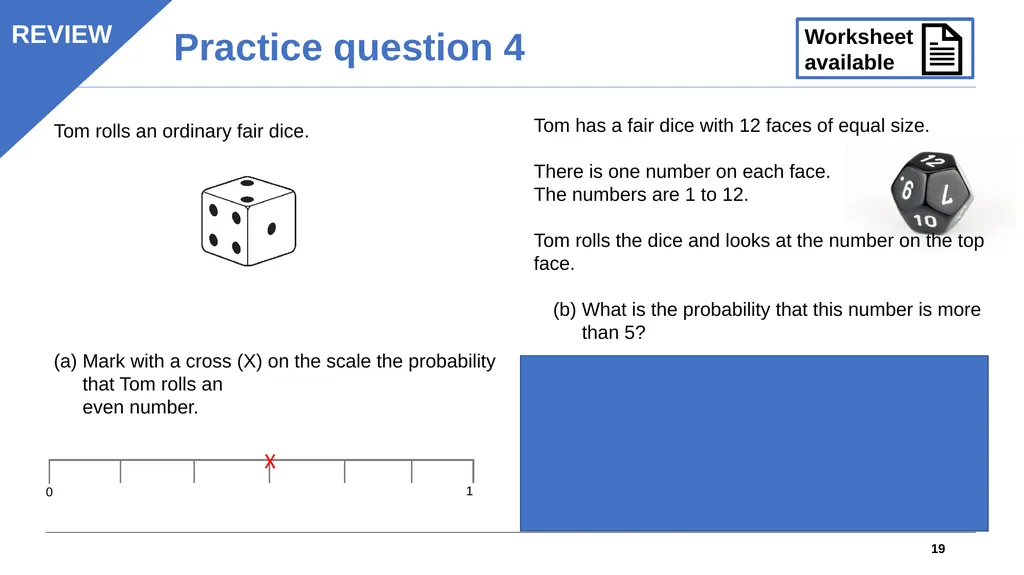
Tom has a fair dice with 12 faces of equal size.
There is one number on each face.
The numbers are 1 to 12.
Tom rolls the dice and looks at the number on the top face.
What is the probability that this number is more than 5? Tom rolls an ordinary fair dice.
Mark with a cross (X) on the scale the probability that Tom rolls an
even number. 19 Practice question 4 REVIEW 0 1 X<br>
20
Lesson review: Probability Level 1 20 Objectives
Understand the likelihood of events using a probability scale
Calculate simple probability as a fraction, decimal or percentage, including from a table
Identify and correct common misconceptions<br>
21
Lesson 12: Credits 21 Photo acknowledgements
Shutterstock.com: Vectorfair.com
Text acknowledgements
Pearson Edexcel Functional Skills, Past Paper 3 Mathematics Level 1 (Calculator) PMAT1/C03 Question 8, Pearson Edexcel Functional Skills, Practice Paper 1 Mathematics Set 1 (Calculator) PRACL1 /01 Question 8, Pearson Edexcel Functional Skills, Past Paper 4 Mathematics Level 1 (Calculator) PMAT1/C04 Question 10<br>