
1 Structured Expert Elicitation – Example Training
KL
Published · 52 slides · 0 views

1 / 1


Description
1 Structured Expert Elicitation Example Training Deck Last updated: November 2023 Using this deck 2 This slide deck is intended to be used as a basis for live, facilitated training of experts participating in a structured expert
Related Topics
Share
Embed code
Download this presentation From Below
"1 Structured Expert Elicitation – Example Training" is the property of its rightful owner. Permission is granted to download and print the materials on this website for personal, non-commercial use only, and to display it on your personal computer provided you do not modify the materials and that you retain all copyright notices contained in the materials. By downloading content from our website, you accept the terms of this agreement.
Presentation Transcript
01
1 Structured Expert Elicitation – Example Training Deck Last updated: November 2023<br>
02
Using this deck 2 This slide deck is intended to be used as a basis for live, facilitated training of experts participating in a structured expert elicitation exercise.
Slides are intended to be adjusted according to individual needs.
Information is provided on four key methods:
Option 1: Chips and bins
Option 2: Quartiles
Option 3: Tertiles
Option 4: Bisection
Slides relating to methods not being used in your exercise should be deleted<br>
Slides are intended to be adjusted according to individual needs.
Information is provided on four key methods:
Option 1: Chips and bins
Option 2: Quartiles
Option 3: Tertiles
Option 4: Bisection
Slides relating to methods not being used in your exercise should be deleted<br>
03
3<br>
04
4<br>
05
Study objectives 5 Summary of study objectives to be added here<br>
06
Study purpose 6 Summary of motivations for the study to be added here<br>
07
How will the results be used? 7 Summary to be added here<br>
08
8<br>
09
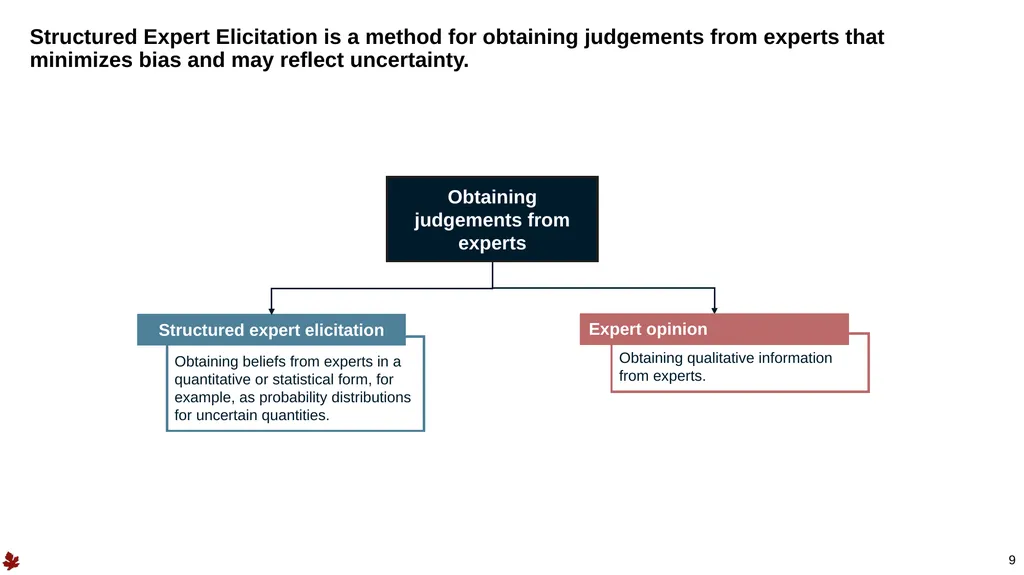
Structured Expert Elicitation is a method for obtaining judgements from experts that minimizes bias and may reflect uncertainty. 9 Obtaining judgements from experts<br>
10
WINNING TIME IN THE PARIS
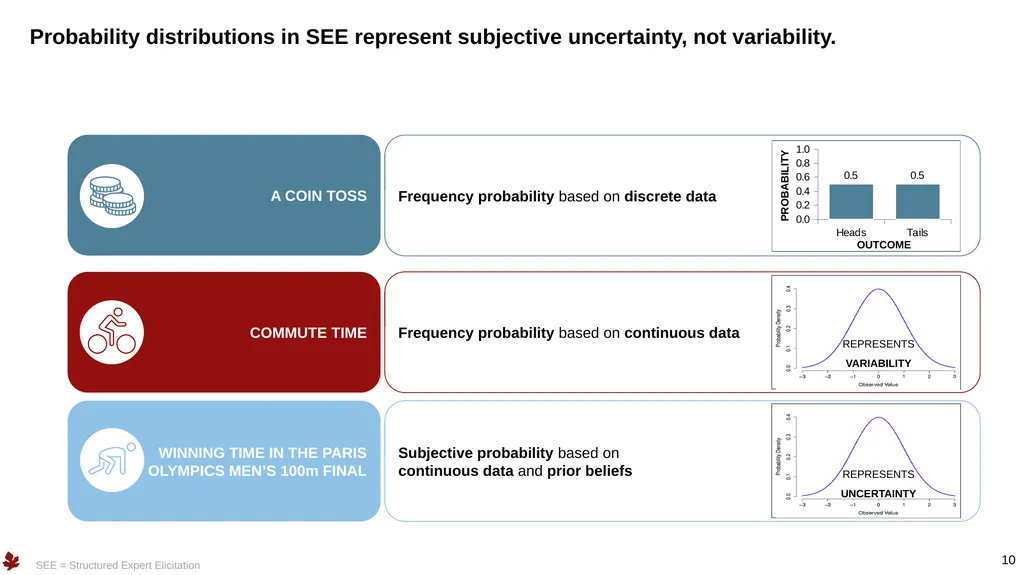
OLYMPICS MEN’S 100m FINAL COMMUTE TIME A COIN TOSS Probability distributions in SEE represent subjective uncertainty, not variability. 10 SEE = Structured Expert Elicitation Frequency probability based on discrete data Frequency probability based on continuous data Subjective probability based on
continuous data and prior beliefs REPRESENTS
VARIABILITY REPRESENTS
UNCERTAINTY<br>
VARIABILITY REPRESENTS
UNCERTAINTY<br>
11
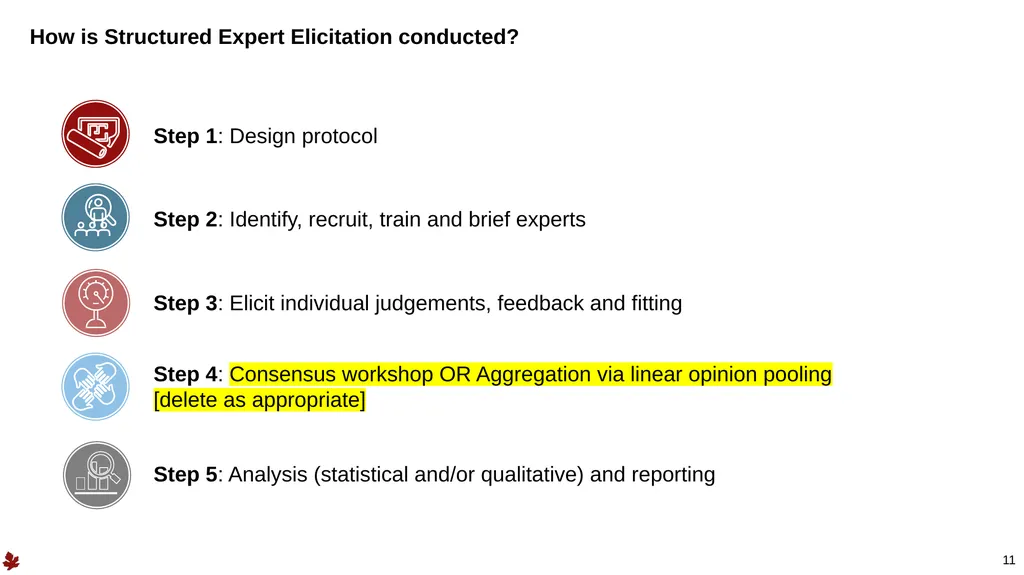
How is Structured Expert Elicitation conducted? 11 Step 1: Design protocol Step 2: Identify, recruit, train and brief experts Step 3: Elicit individual judgements, feedback and fitting Step 4: Consensus workshop OR Aggregation via linear opinion pooling [delete as appropriate] Step 5: Analysis (statistical and/or qualitative) and reporting<br>
12
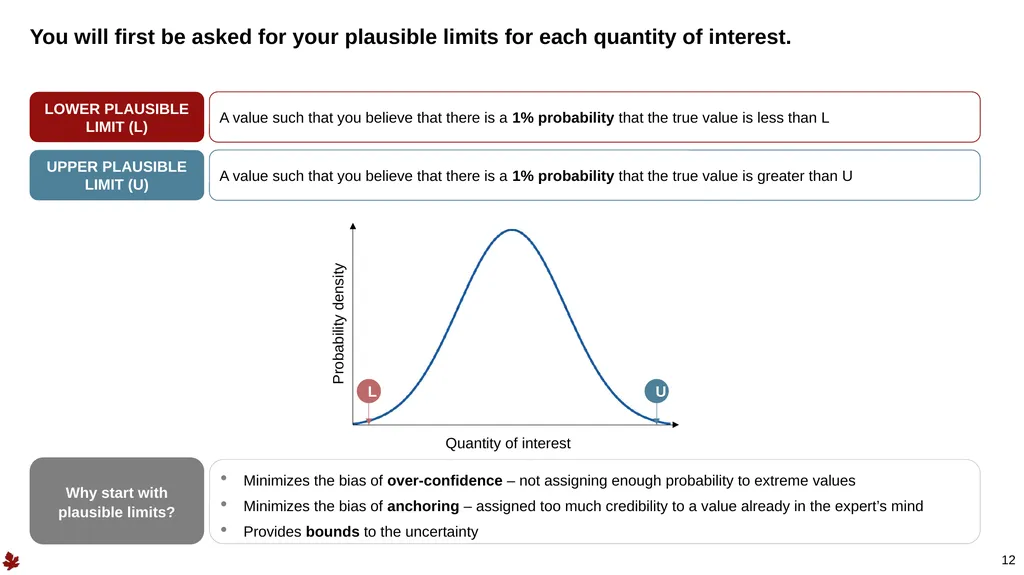
You will first be asked for your plausible limits for each quantity of interest. 12 LOWER PLAUSIBLE LIMIT (L) UPPER PLAUSIBLE LIMIT (U) A value such that you believe that there is a 1% probability that the true value is less than L A value such that you believe that there is a 1% probability that the true value is greater than U Quantity of interest Probability density L U Minimizes the bias of over-confidence – not assigning enough probability to extreme values
Minimizes the bias of anchoring – assigned too much credibility to a value already in the expert’s mind
Provides bounds to the uncertainty Why start with plausible limits?<br>
Minimizes the bias of anchoring – assigned too much credibility to a value already in the expert’s mind
Provides bounds to the uncertainty Why start with plausible limits?<br>
13
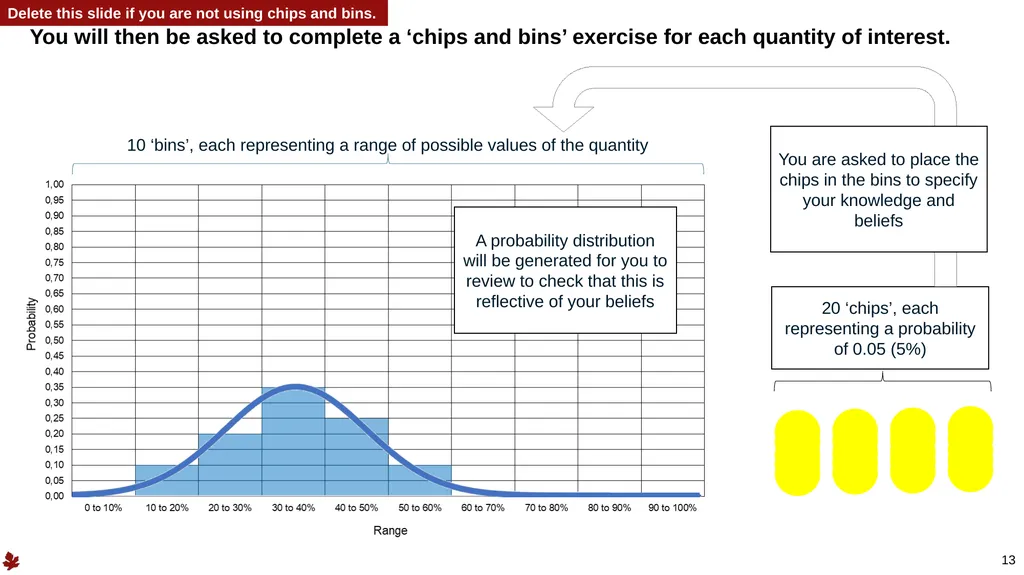
You will then be asked to complete a ‘chips and bins’ exercise for each quantity of interest. 13 20 ‘chips’, each representing a probability of 0.05 (5%) 10 ‘bins’, each representing a range of possible values of the quantity You are asked to place the chips in the bins to specify your knowledge and beliefs A probability distribution will be generated for you to review to check that this is reflective of your beliefs Delete this slide if you are not using chips and bins.<br>
14
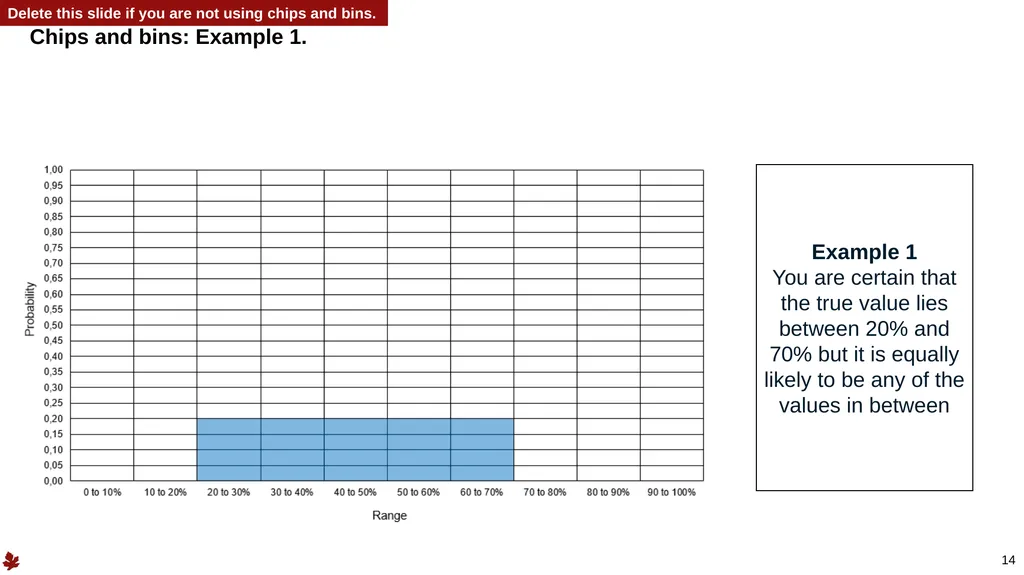
Chips and bins: Example 1. 14 Delete this slide if you are not using chips and bins. Example 1
You are certain that the true value lies between 20% and 70% but it is equally likely to be any of the values in between<br>
You are certain that the true value lies between 20% and 70% but it is equally likely to be any of the values in between<br>
15
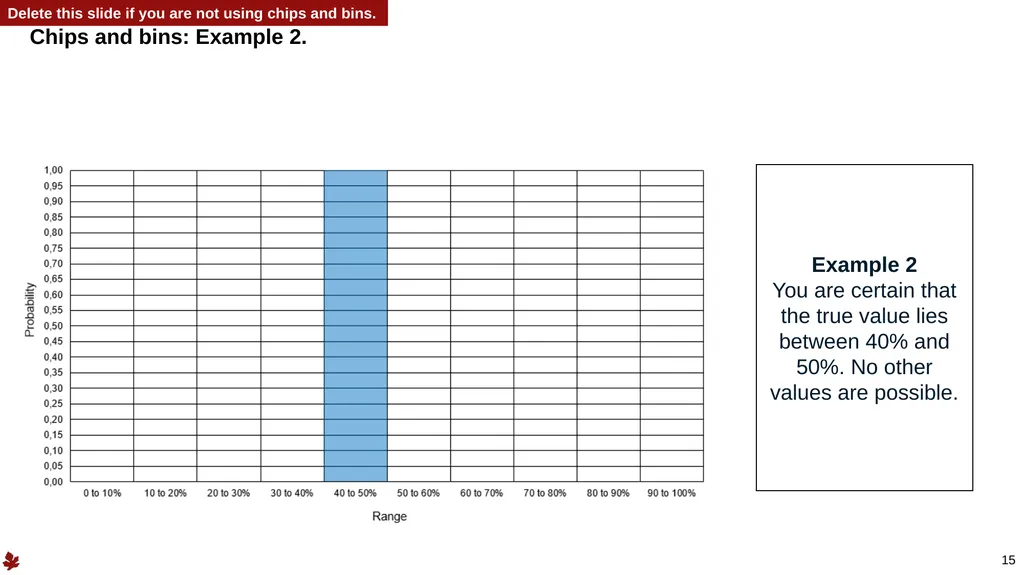
Chips and bins: Example 2. 15 Delete this slide if you are not using chips and bins. Example 2
You are certain that the true value lies between 40% and 50%. No other values are possible.<br>
You are certain that the true value lies between 40% and 50%. No other values are possible.<br>
16
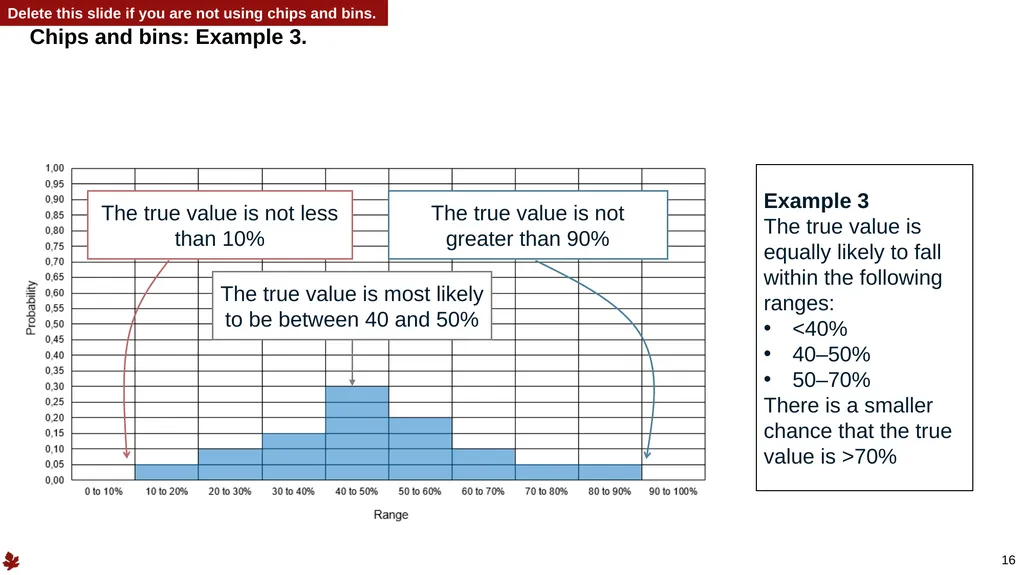
Chips and bins: Example 3. 16 Delete this slide if you are not using chips and bins. Example 3
The true value is equally likely to fall within the following ranges:
<40%
40–50%
50–70%
There is a smaller chance that the true value is >70% The true value is not less than 10% The true value is most likely to be between 40 and 50% The true value is not greater than 90%<br>
The true value is equally likely to fall within the following ranges:
<40%
40–50%
50–70%
There is a smaller chance that the true value is >70% The true value is not less than 10% The true value is most likely to be between 40 and 50% The true value is not greater than 90%<br>
17
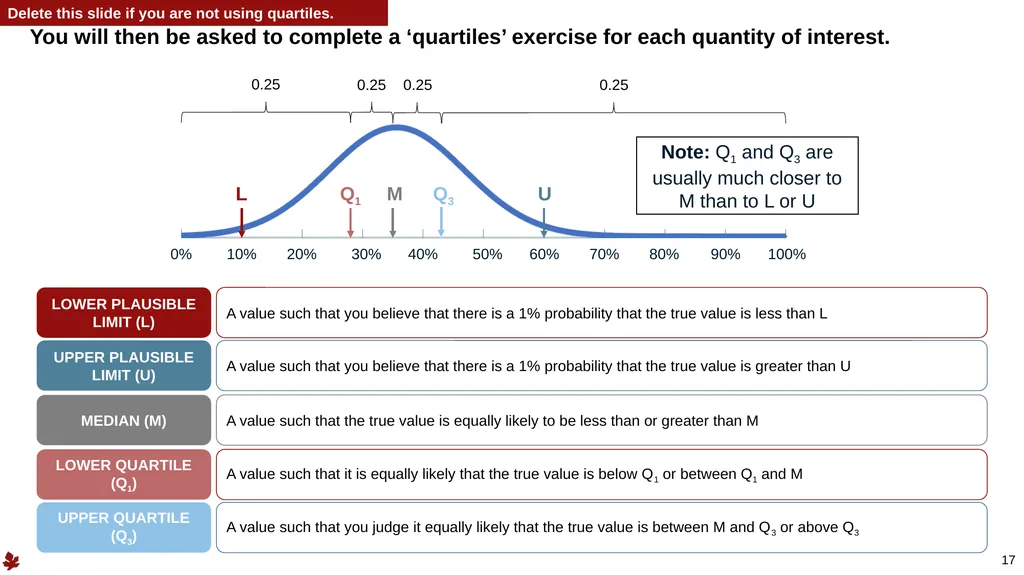
You will then be asked to complete a ‘quartiles’ exercise for each quantity of interest. 17 Delete this slide if you are not using quartiles. Note: Q1 and Q3 are usually much closer to M than to L or U LOWER PLAUSIBLE LIMIT (L) UPPER PLAUSIBLE LIMIT (U) A value such that you believe that there is a 1% probability that the true value is less than L A value such that you believe that there is a 1% probability that the true value is greater than U MEDIAN (M) A value such that the true value is equally likely to be less than or greater than M LOWER QUARTILE (Q1) UPPER QUARTILE (Q3) A value such that it is equally likely that the true value is below Q1 or between Q1 and M A value such that you judge it equally likely that the true value is between M and Q3 or above Q3<br>
18
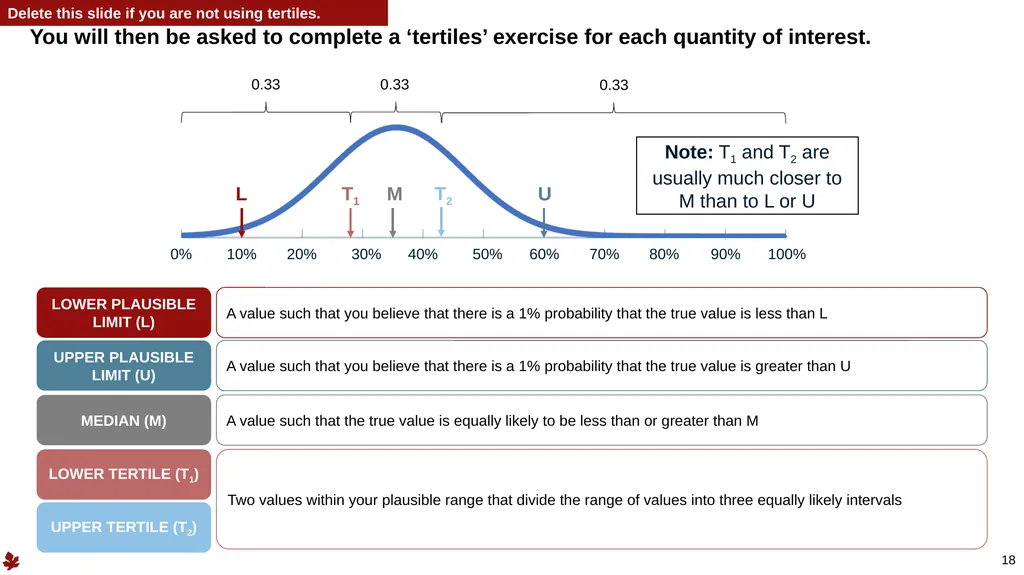
You will then be asked to complete a ‘tertiles’ exercise for each quantity of interest. 18 Delete this slide if you are not using tertiles. Note: T1 and T2 are usually much closer to M than to L or U LOWER PLAUSIBLE LIMIT (L) UPPER PLAUSIBLE LIMIT (U) A value such that you believe that there is a 1% probability that the true value is less than L A value such that you believe that there is a 1% probability that the true value is greater than U MEDIAN (M) A value such that the true value is equally likely to be less than or greater than M LOWER TERTILE (T1) UPPER TERTILE (T2) Two values within your plausible range that divide the range of values into three equally likely intervals<br>
19
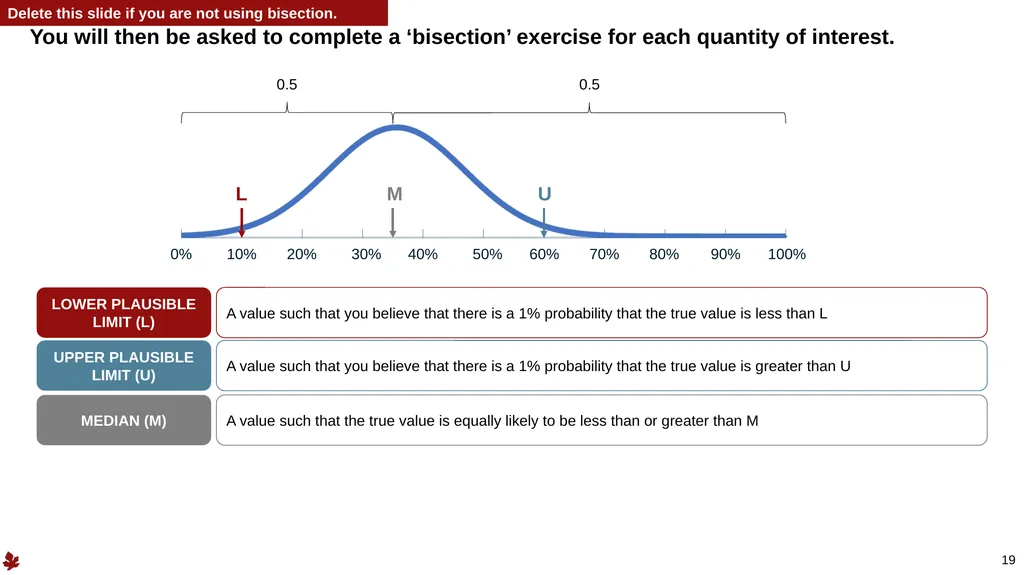
You will then be asked to complete a ‘bisection’ exercise for each quantity of interest. 19 Delete this slide if you are not using bisection. LOWER PLAUSIBLE LIMIT (L) UPPER PLAUSIBLE LIMIT (U) A value such that you believe that there is a 1% probability that the true value is less than L A value such that you believe that there is a 1% probability that the true value is greater than U MEDIAN (M) A value such that the true value is equally likely to be less than or greater than M<br>
20
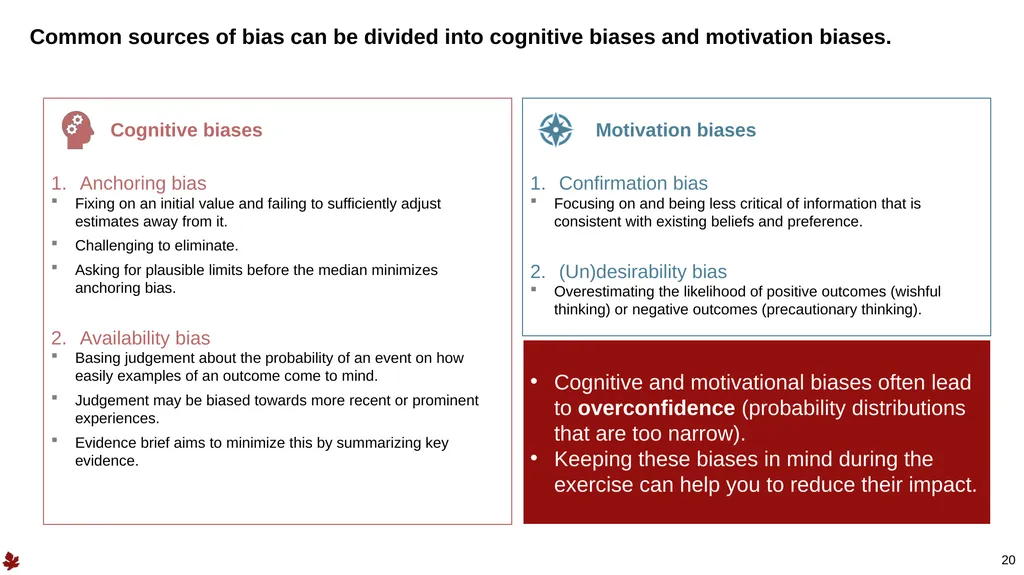
Common sources of bias can be divided into cognitive biases and motivation biases. 20 Confirmation bias
Focusing on and being less critical of information that is consistent with existing beliefs and preference.
(Un)desirability bias
Overestimating the likelihood of positive outcomes (wishful thinking) or negative outcomes (precautionary thinking). Anchoring bias
Fixing on an initial value and failing to sufficiently adjust estimates away from it.
Challenging to eliminate.
Asking for plausible limits before the median minimizes anchoring bias.
Availability bias
Basing judgement about the probability of an event on how easily examples of an outcome come to mind.
Judgement may be biased towards more recent or prominent experiences.
Evidence brief aims to minimize this by summarizing key evidence. Cognitive biases Motivation biases Cognitive and motivational biases often lead to overconfidence (probability distributions that are too narrow).
Keeping these biases in mind during the exercise can help you to reduce their impact.<br>
Focusing on and being less critical of information that is consistent with existing beliefs and preference.
(Un)desirability bias
Overestimating the likelihood of positive outcomes (wishful thinking) or negative outcomes (precautionary thinking). Anchoring bias
Fixing on an initial value and failing to sufficiently adjust estimates away from it.
Challenging to eliminate.
Asking for plausible limits before the median minimizes anchoring bias.
Availability bias
Basing judgement about the probability of an event on how easily examples of an outcome come to mind.
Judgement may be biased towards more recent or prominent experiences.
Evidence brief aims to minimize this by summarizing key evidence. Cognitive biases Motivation biases Cognitive and motivational biases often lead to overconfidence (probability distributions that are too narrow).
Keeping these biases in mind during the exercise can help you to reduce their impact.<br>
21
21<br>
22
Practice question 1 What is the mean age of today’s group of experts?<br>
23
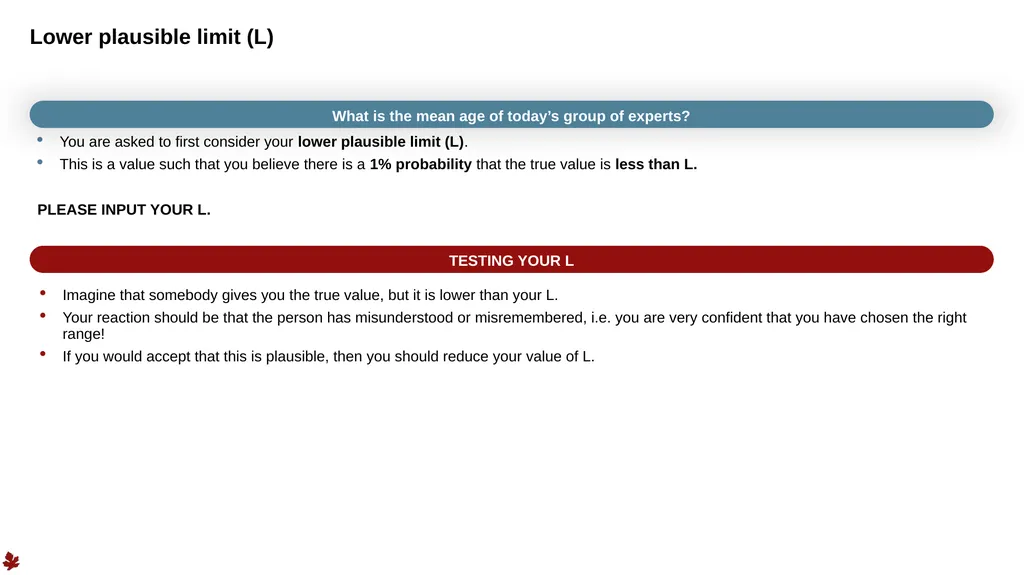
Lower plausible limit (L) You are asked to first consider your lower plausible limit (L).
This is a value such that you believe there is a 1% probability that the true value is less than L.
PLEASE INPUT YOUR L. Imagine that somebody gives you the true value, but it is lower than your L.
Your reaction should be that the person has misunderstood or misremembered, i.e. you are very confident that you have chosen the right range!
If you would accept that this is plausible, then you should reduce your value of L. What is the mean age of today’s group of experts? TESTING YOUR L<br>
This is a value such that you believe there is a 1% probability that the true value is less than L.
PLEASE INPUT YOUR L. Imagine that somebody gives you the true value, but it is lower than your L.
Your reaction should be that the person has misunderstood or misremembered, i.e. you are very confident that you have chosen the right range!
If you would accept that this is plausible, then you should reduce your value of L. What is the mean age of today’s group of experts? TESTING YOUR L<br>
24
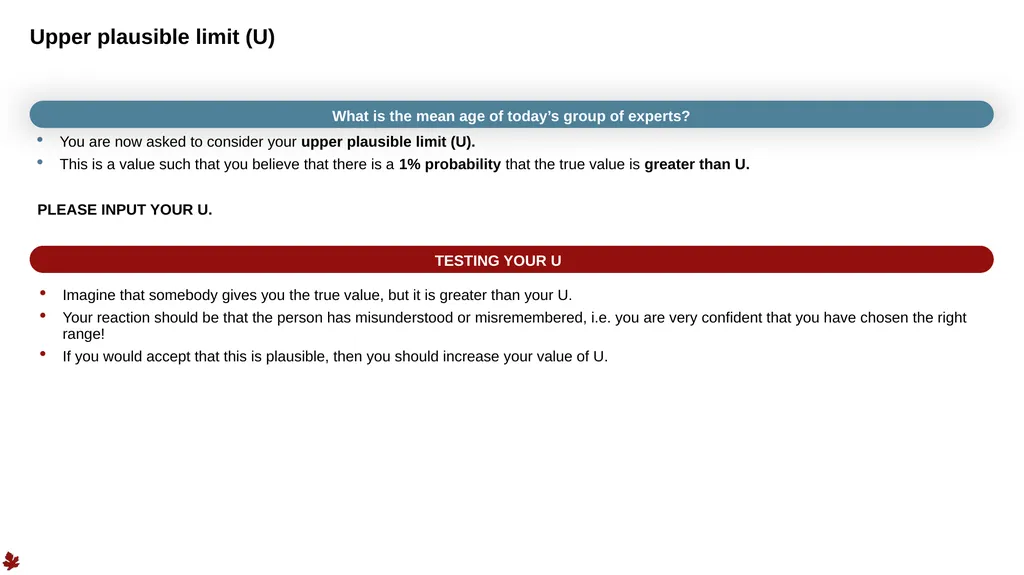
Upper plausible limit (U) You are now asked to consider your upper plausible limit (U).
This is a value such that you believe that there is a 1% probability that the true value is greater than U.
PLEASE INPUT YOUR U. Imagine that somebody gives you the true value, but it is greater than your U.
Your reaction should be that the person has misunderstood or misremembered, i.e. you are very confident that you have chosen the right range!
If you would accept that this is plausible, then you should increase your value of U. What is the mean age of today’s group of experts? TESTING YOUR U<br>
This is a value such that you believe that there is a 1% probability that the true value is greater than U.
PLEASE INPUT YOUR U. Imagine that somebody gives you the true value, but it is greater than your U.
Your reaction should be that the person has misunderstood or misremembered, i.e. you are very confident that you have chosen the right range!
If you would accept that this is plausible, then you should increase your value of U. What is the mean age of today’s group of experts? TESTING YOUR U<br>
25
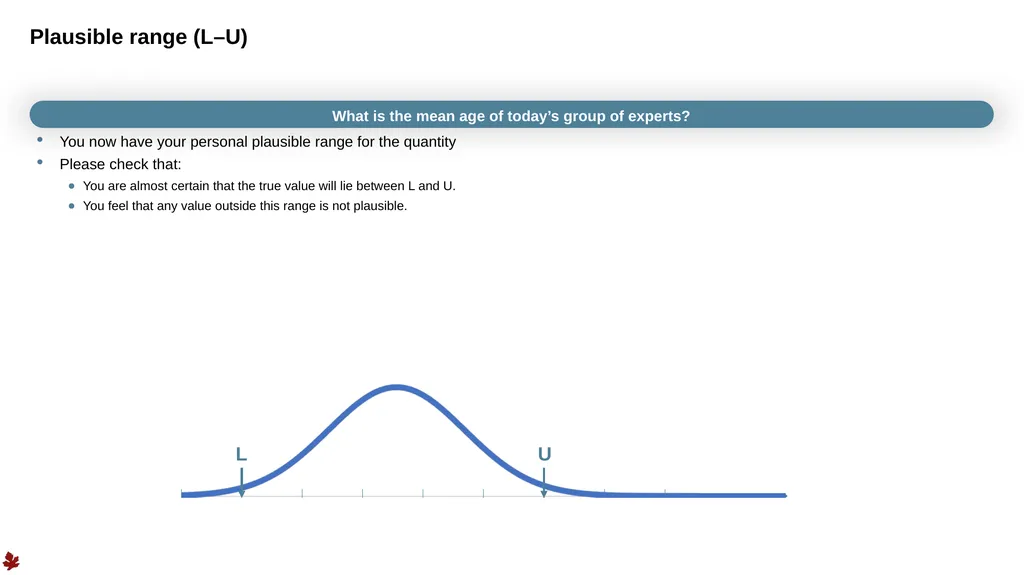
Plausible range (L–U) You now have your personal plausible range for the quantity
Please check that:
You are almost certain that the true value will lie between L and U.
You feel that any value outside this range is not plausible. What is the mean age of today’s group of experts? L U<br>
Please check that:
You are almost certain that the true value will lie between L and U.
You feel that any value outside this range is not plausible. What is the mean age of today’s group of experts? L U<br>
26
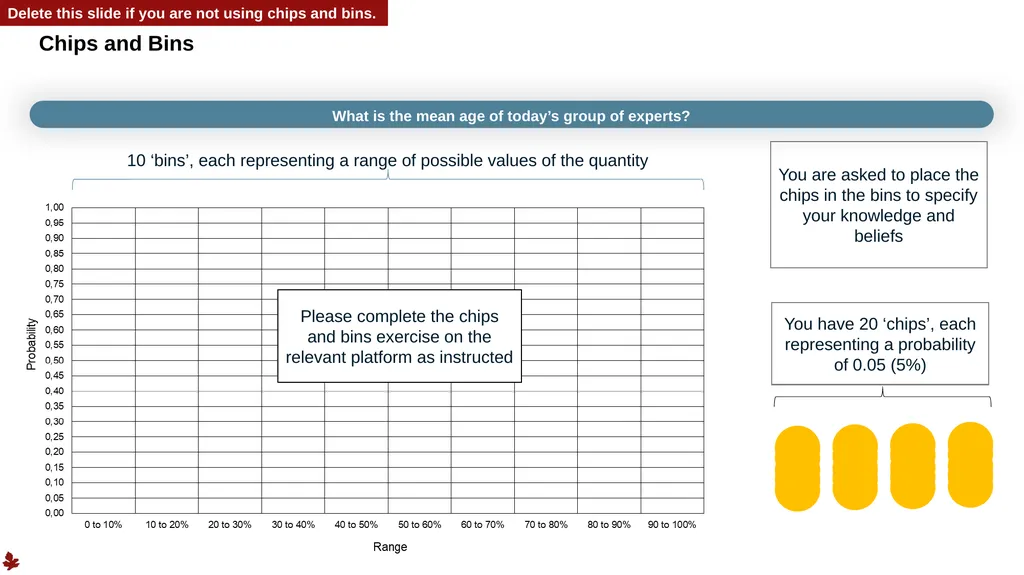
Chips and Bins You have 20 ‘chips’, each representing a probability of 0.05 (5%) 10 ‘bins’, each representing a range of possible values of the quantity You are asked to place the chips in the bins to specify your knowledge and beliefs Delete this slide if you are not using chips and bins. What is the mean age of today’s group of experts? Please complete the chips and bins exercise on the relevant platform as instructed<br>
27
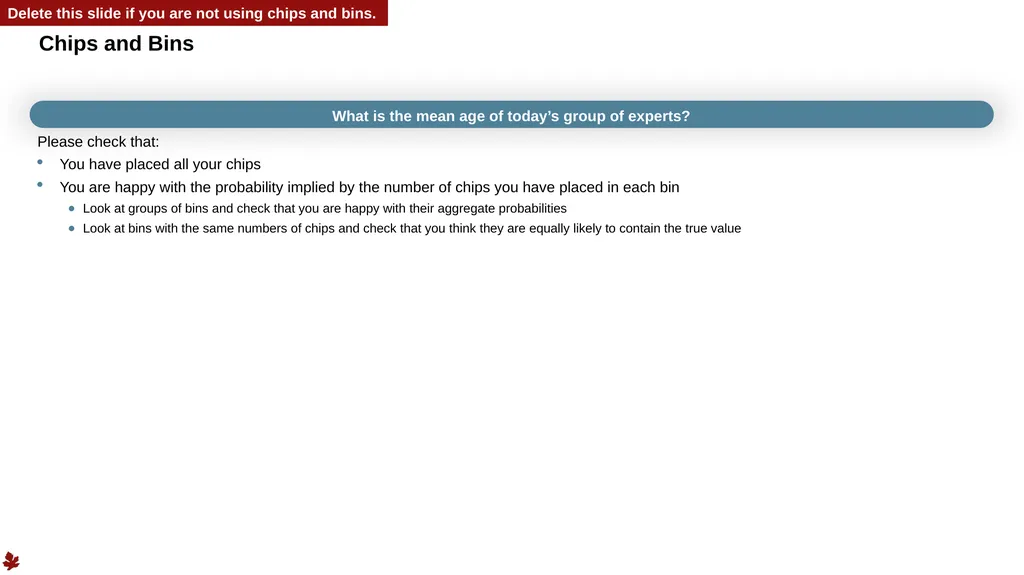
Please check that:
You have placed all your chips
You are happy with the probability implied by the number of chips you have placed in each bin
Look at groups of bins and check that you are happy with their aggregate probabilities
Look at bins with the same numbers of chips and check that you think they are equally likely to contain the true value What is the mean age of today’s group of experts? Chips and Bins Delete this slide if you are not using chips and bins.<br>
You have placed all your chips
You are happy with the probability implied by the number of chips you have placed in each bin
Look at groups of bins and check that you are happy with their aggregate probabilities
Look at bins with the same numbers of chips and check that you think they are equally likely to contain the true value What is the mean age of today’s group of experts? Chips and Bins Delete this slide if you are not using chips and bins.<br>
28
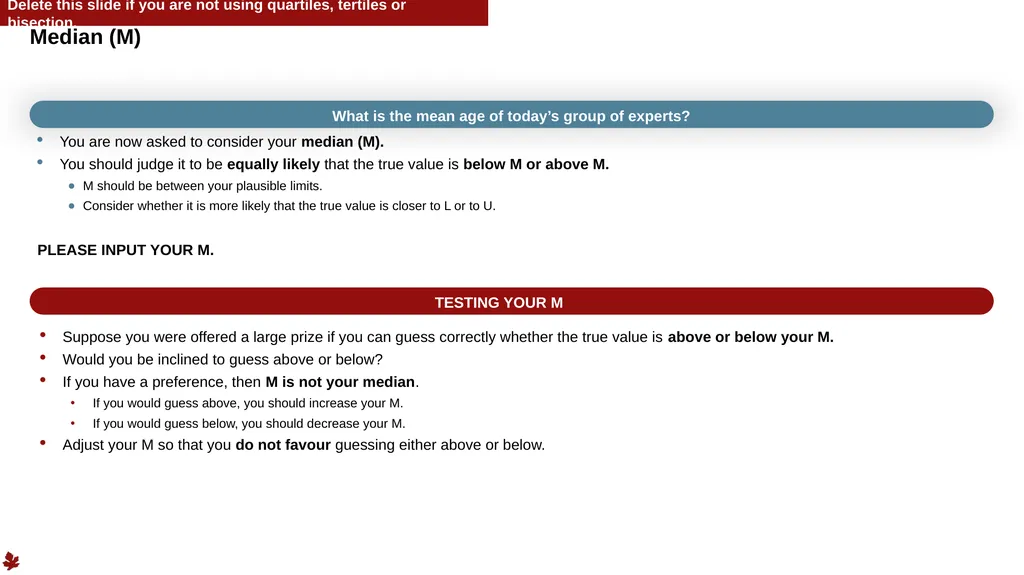
Median (M) You are now asked to consider your median (M).
You should judge it to be equally likely that the true value is below M or above M.
M should be between your plausible limits.
Consider whether it is more likely that the true value is closer to L or to U.
PLEASE INPUT YOUR M. Suppose you were offered a large prize if you can guess correctly whether the true value is above or below your M.
Would you be inclined to guess above or below?
If you have a preference, then M is not your median.
If you would guess above, you should increase your M.
If you would guess below, you should decrease your M.
Adjust your M so that you do not favour guessing either above or below. What is the mean age of today’s group of experts? TESTING YOUR M Delete this slide if you are not using quartiles, tertiles or bisection.<br>
You should judge it to be equally likely that the true value is below M or above M.
M should be between your plausible limits.
Consider whether it is more likely that the true value is closer to L or to U.
PLEASE INPUT YOUR M. Suppose you were offered a large prize if you can guess correctly whether the true value is above or below your M.
Would you be inclined to guess above or below?
If you have a preference, then M is not your median.
If you would guess above, you should increase your M.
If you would guess below, you should decrease your M.
Adjust your M so that you do not favour guessing either above or below. What is the mean age of today’s group of experts? TESTING YOUR M Delete this slide if you are not using quartiles, tertiles or bisection.<br>
29
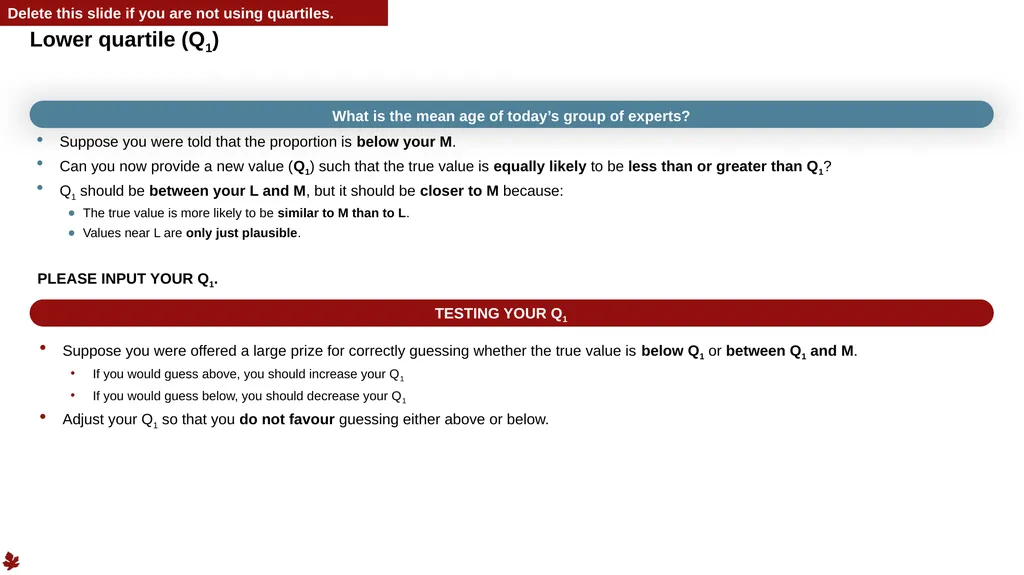
Lower quartile (Q1) Suppose you were told that the proportion is below your M.
Can you now provide a new value (Q1) such that the true value is equally likely to be less than or greater than Q1?
Q1 should be between your L and M, but it should be closer to M because:
The true value is more likely to be similar to M than to L.
Values near L are only just plausible.
PLEASE INPUT YOUR Q1. Suppose you were offered a large prize for correctly guessing whether the true value is below Q1 or between Q1 and M.
If you would guess above, you should increase your Q1
If you would guess below, you should decrease your Q1
Adjust your Q1 so that you do not favour guessing either above or below. What is the mean age of today’s group of experts? TESTING YOUR Q1 Delete this slide if you are not using quartiles.<br>
Can you now provide a new value (Q1) such that the true value is equally likely to be less than or greater than Q1?
Q1 should be between your L and M, but it should be closer to M because:
The true value is more likely to be similar to M than to L.
Values near L are only just plausible.
PLEASE INPUT YOUR Q1. Suppose you were offered a large prize for correctly guessing whether the true value is below Q1 or between Q1 and M.
If you would guess above, you should increase your Q1
If you would guess below, you should decrease your Q1
Adjust your Q1 so that you do not favour guessing either above or below. What is the mean age of today’s group of experts? TESTING YOUR Q1 Delete this slide if you are not using quartiles.<br>
30
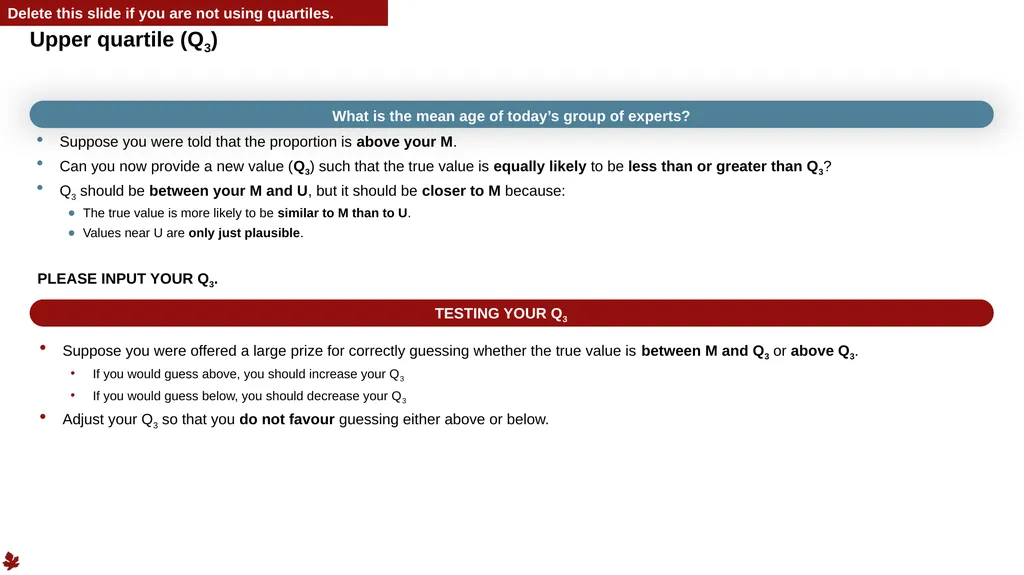
Upper quartile (Q3) Suppose you were told that the proportion is above your M.
Can you now provide a new value (Q3) such that the true value is equally likely to be less than or greater than Q3?
Q3 should be between your M and U, but it should be closer to M because:
The true value is more likely to be similar to M than to U.
Values near U are only just plausible.
PLEASE INPUT YOUR Q3. Suppose you were offered a large prize for correctly guessing whether the true value is between M and Q3 or above Q3.
If you would guess above, you should increase your Q3
If you would guess below, you should decrease your Q3
Adjust your Q3 so that you do not favour guessing either above or below. What is the mean age of today’s group of experts? TESTING YOUR Q3 Delete this slide if you are not using quartiles.<br>
Can you now provide a new value (Q3) such that the true value is equally likely to be less than or greater than Q3?
Q3 should be between your M and U, but it should be closer to M because:
The true value is more likely to be similar to M than to U.
Values near U are only just plausible.
PLEASE INPUT YOUR Q3. Suppose you were offered a large prize for correctly guessing whether the true value is between M and Q3 or above Q3.
If you would guess above, you should increase your Q3
If you would guess below, you should decrease your Q3
Adjust your Q3 so that you do not favour guessing either above or below. What is the mean age of today’s group of experts? TESTING YOUR Q3 Delete this slide if you are not using quartiles.<br>
31
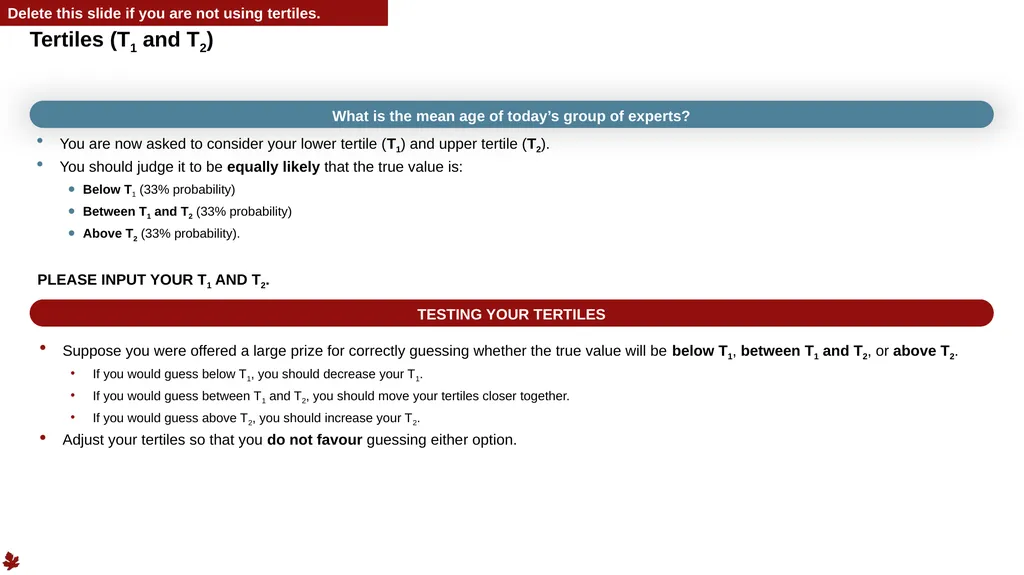
Tertiles (T1 and T2) You are now asked to consider your lower tertile (T1) and upper tertile (T2).
You should judge it to be equally likely that the true value is:
Below T1 (33% probability)
Between T1 and T2 (33% probability)
Above T2 (33% probability).
PLEASE INPUT YOUR T1 AND T2. Suppose you were offered a large prize for correctly guessing whether the true value will be below T1, between T1 and T2, or above T2.
If you would guess below T1, you should decrease your T1.
If you would guess between T1 and T2, you should move your tertiles closer together.
If you would guess above T2, you should increase your T2.
Adjust your tertiles so that you do not favour guessing either option. What is the mean age of today’s group of experts? TESTING YOUR TERTILES Delete this slide if you are not using tertiles.<br>
You should judge it to be equally likely that the true value is:
Below T1 (33% probability)
Between T1 and T2 (33% probability)
Above T2 (33% probability).
PLEASE INPUT YOUR T1 AND T2. Suppose you were offered a large prize for correctly guessing whether the true value will be below T1, between T1 and T2, or above T2.
If you would guess below T1, you should decrease your T1.
If you would guess between T1 and T2, you should move your tertiles closer together.
If you would guess above T2, you should increase your T2.
Adjust your tertiles so that you do not favour guessing either option. What is the mean age of today’s group of experts? TESTING YOUR TERTILES Delete this slide if you are not using tertiles.<br>
32
32 Time for a 5-minute break.<br>
33
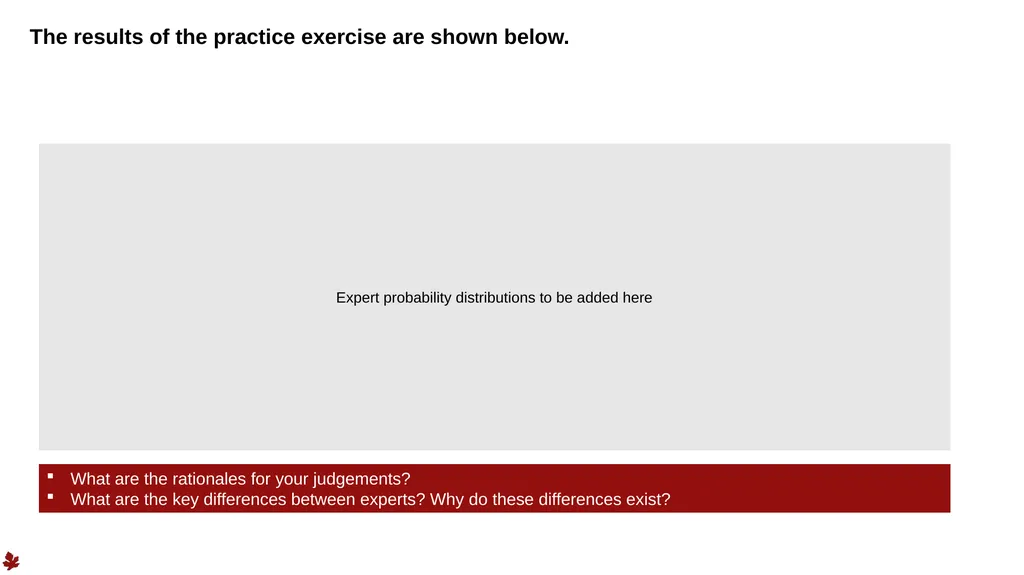
The results of the practice exercise are shown below. What are the rationales for your judgements?
What are the key differences between experts? Why do these differences exist? Expert probability distributions to be added here<br>
What are the key differences between experts? Why do these differences exist? Expert probability distributions to be added here<br>
34
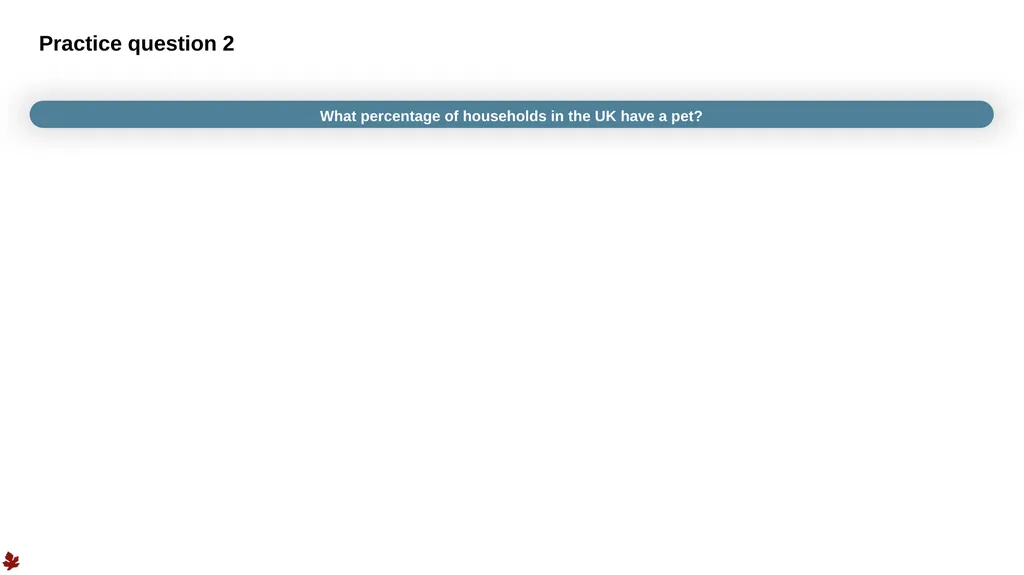
Practice question 2 What percentage of households in the UK have a pet?<br>
35
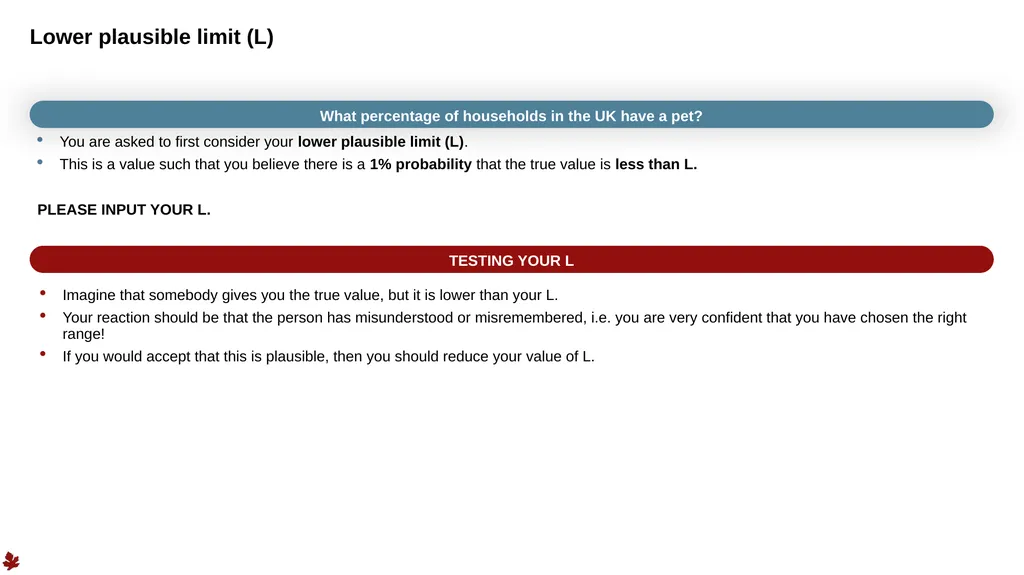
Lower plausible limit (L) You are asked to first consider your lower plausible limit (L).
This is a value such that you believe there is a 1% probability that the true value is less than L.
PLEASE INPUT YOUR L. Imagine that somebody gives you the true value, but it is lower than your L.
Your reaction should be that the person has misunderstood or misremembered, i.e. you are very confident that you have chosen the right range!
If you would accept that this is plausible, then you should reduce your value of L. TESTING YOUR L What percentage of households in the UK have a pet?<br>
This is a value such that you believe there is a 1% probability that the true value is less than L.
PLEASE INPUT YOUR L. Imagine that somebody gives you the true value, but it is lower than your L.
Your reaction should be that the person has misunderstood or misremembered, i.e. you are very confident that you have chosen the right range!
If you would accept that this is plausible, then you should reduce your value of L. TESTING YOUR L What percentage of households in the UK have a pet?<br>
36
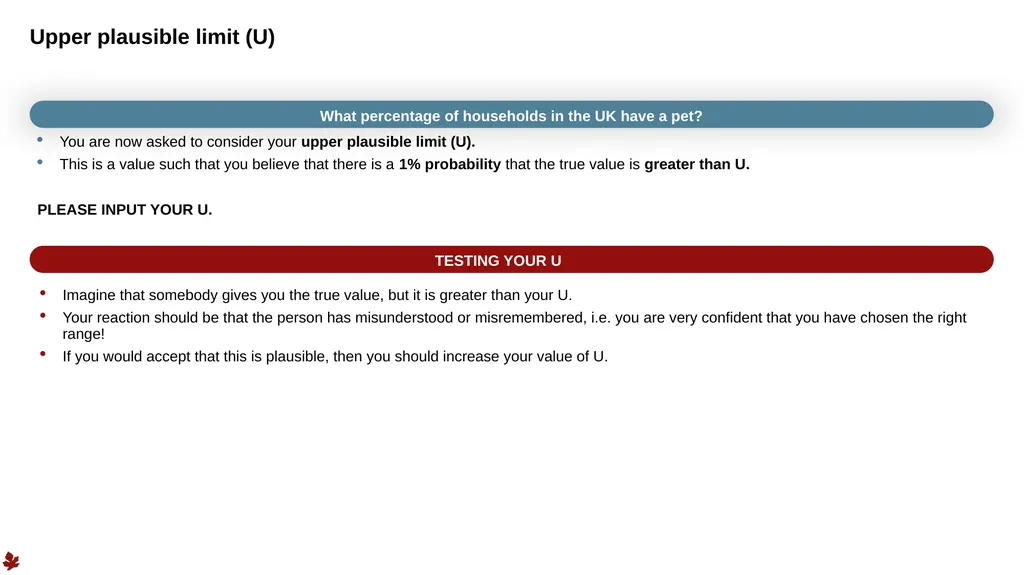
Upper plausible limit (U) You are now asked to consider your upper plausible limit (U).
This is a value such that you believe that there is a 1% probability that the true value is greater than U.
PLEASE INPUT YOUR U. Imagine that somebody gives you the true value, but it is greater than your U.
Your reaction should be that the person has misunderstood or misremembered, i.e. you are very confident that you have chosen the right range!
If you would accept that this is plausible, then you should increase your value of U. TESTING YOUR U What percentage of households in the UK have a pet?<br>
This is a value such that you believe that there is a 1% probability that the true value is greater than U.
PLEASE INPUT YOUR U. Imagine that somebody gives you the true value, but it is greater than your U.
Your reaction should be that the person has misunderstood or misremembered, i.e. you are very confident that you have chosen the right range!
If you would accept that this is plausible, then you should increase your value of U. TESTING YOUR U What percentage of households in the UK have a pet?<br>
37
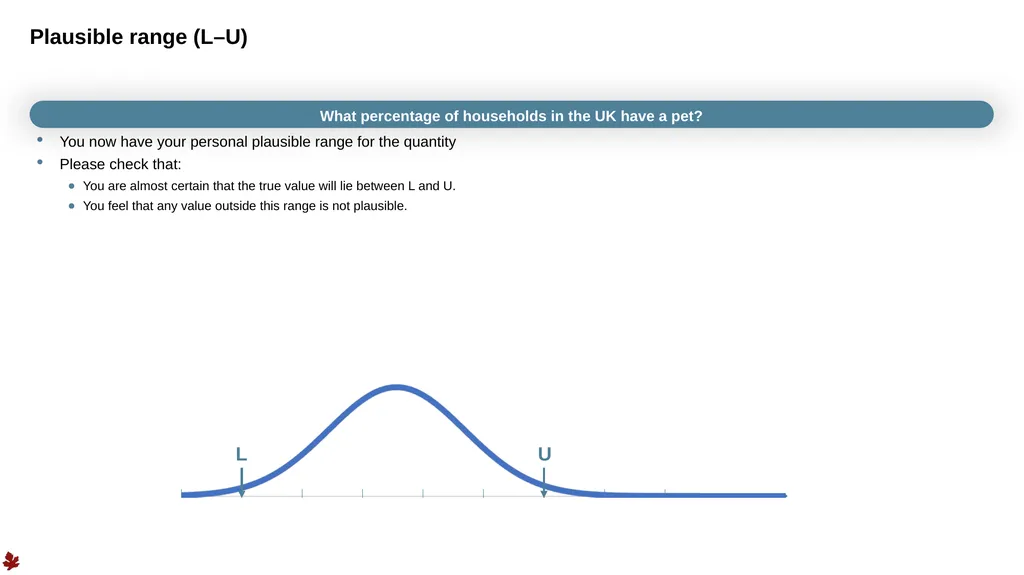
Plausible range (L–U) You now have your personal plausible range for the quantity
Please check that:
You are almost certain that the true value will lie between L and U.
You feel that any value outside this range is not plausible. L U What percentage of households in the UK have a pet?<br>
Please check that:
You are almost certain that the true value will lie between L and U.
You feel that any value outside this range is not plausible. L U What percentage of households in the UK have a pet?<br>
38
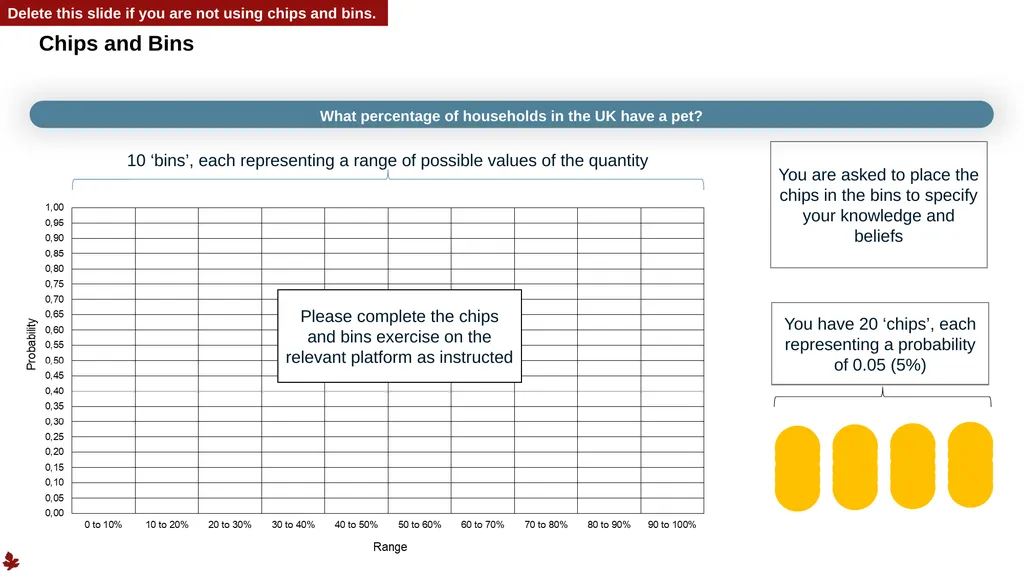
Chips and Bins You have 20 ‘chips’, each representing a probability of 0.05 (5%) 10 ‘bins’, each representing a range of possible values of the quantity You are asked to place the chips in the bins to specify your knowledge and beliefs Delete this slide if you are not using chips and bins. Please complete the chips and bins exercise on the relevant platform as instructed What percentage of households in the UK have a pet?<br>
39
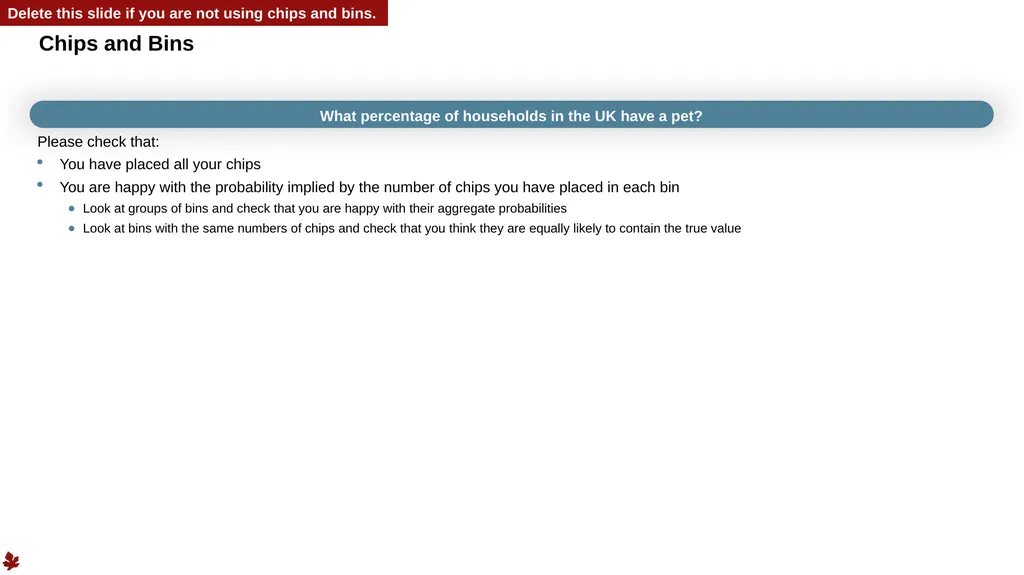
Please check that:
You have placed all your chips
You are happy with the probability implied by the number of chips you have placed in each bin
Look at groups of bins and check that you are happy with their aggregate probabilities
Look at bins with the same numbers of chips and check that you think they are equally likely to contain the true value Chips and Bins Delete this slide if you are not using chips and bins. What percentage of households in the UK have a pet?<br>
You have placed all your chips
You are happy with the probability implied by the number of chips you have placed in each bin
Look at groups of bins and check that you are happy with their aggregate probabilities
Look at bins with the same numbers of chips and check that you think they are equally likely to contain the true value Chips and Bins Delete this slide if you are not using chips and bins. What percentage of households in the UK have a pet?<br>
40
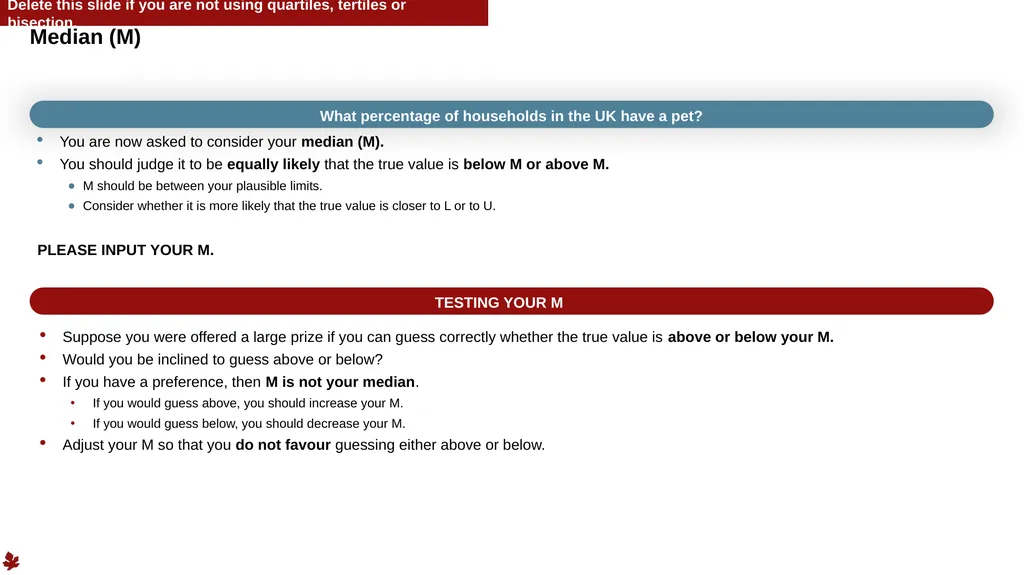
Median (M) You are now asked to consider your median (M).
You should judge it to be equally likely that the true value is below M or above M.
M should be between your plausible limits.
Consider whether it is more likely that the true value is closer to L or to U.
PLEASE INPUT YOUR M. Suppose you were offered a large prize if you can guess correctly whether the true value is above or below your M.
Would you be inclined to guess above or below?
If you have a preference, then M is not your median.
If you would guess above, you should increase your M.
If you would guess below, you should decrease your M.
Adjust your M so that you do not favour guessing either above or below. TESTING YOUR M Delete this slide if you are not using quartiles, tertiles or bisection. What percentage of households in the UK have a pet?<br>
You should judge it to be equally likely that the true value is below M or above M.
M should be between your plausible limits.
Consider whether it is more likely that the true value is closer to L or to U.
PLEASE INPUT YOUR M. Suppose you were offered a large prize if you can guess correctly whether the true value is above or below your M.
Would you be inclined to guess above or below?
If you have a preference, then M is not your median.
If you would guess above, you should increase your M.
If you would guess below, you should decrease your M.
Adjust your M so that you do not favour guessing either above or below. TESTING YOUR M Delete this slide if you are not using quartiles, tertiles or bisection. What percentage of households in the UK have a pet?<br>
41
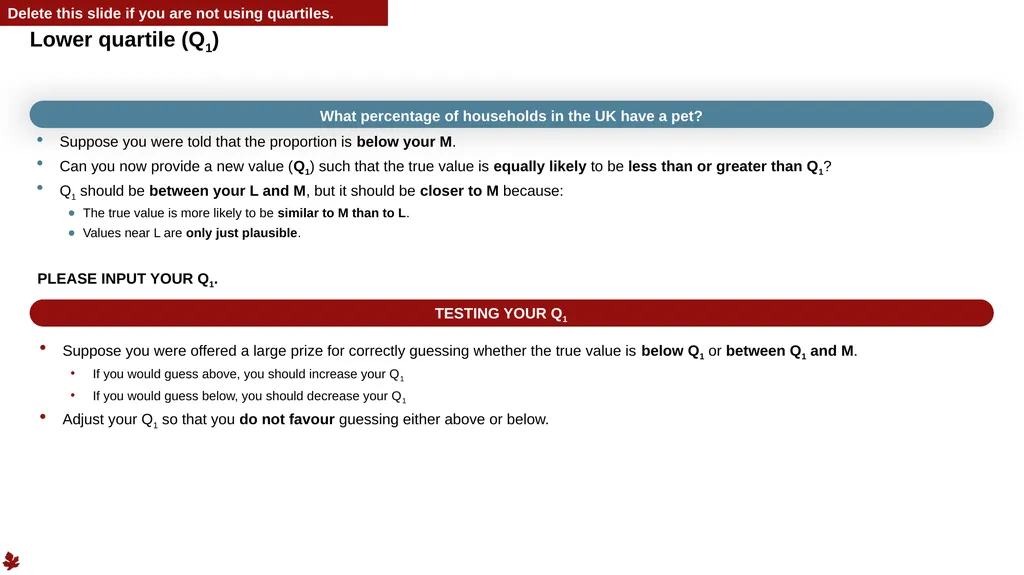
Lower quartile (Q1) Suppose you were told that the proportion is below your M.
Can you now provide a new value (Q1) such that the true value is equally likely to be less than or greater than Q1?
Q1 should be between your L and M, but it should be closer to M because:
The true value is more likely to be similar to M than to L.
Values near L are only just plausible.
PLEASE INPUT YOUR Q1. Suppose you were offered a large prize for correctly guessing whether the true value is below Q1 or between Q1 and M.
If you would guess above, you should increase your Q1
If you would guess below, you should decrease your Q1
Adjust your Q1 so that you do not favour guessing either above or below. TESTING YOUR Q1 Delete this slide if you are not using quartiles. What percentage of households in the UK have a pet?<br>
Can you now provide a new value (Q1) such that the true value is equally likely to be less than or greater than Q1?
Q1 should be between your L and M, but it should be closer to M because:
The true value is more likely to be similar to M than to L.
Values near L are only just plausible.
PLEASE INPUT YOUR Q1. Suppose you were offered a large prize for correctly guessing whether the true value is below Q1 or between Q1 and M.
If you would guess above, you should increase your Q1
If you would guess below, you should decrease your Q1
Adjust your Q1 so that you do not favour guessing either above or below. TESTING YOUR Q1 Delete this slide if you are not using quartiles. What percentage of households in the UK have a pet?<br>
42
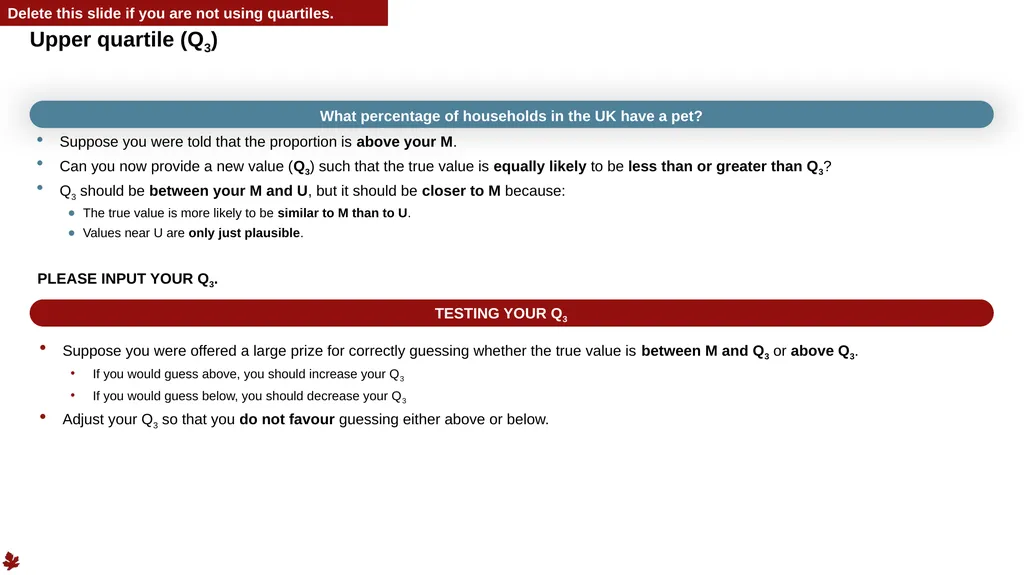
Upper quartile (Q3) Suppose you were told that the proportion is above your M.
Can you now provide a new value (Q3) such that the true value is equally likely to be less than or greater than Q3?
Q3 should be between your M and U, but it should be closer to M because:
The true value is more likely to be similar to M than to U.
Values near U are only just plausible.
PLEASE INPUT YOUR Q3. Suppose you were offered a large prize for correctly guessing whether the true value is between M and Q3 or above Q3.
If you would guess above, you should increase your Q3
If you would guess below, you should decrease your Q3
Adjust your Q3 so that you do not favour guessing either above or below. TESTING YOUR Q3 Delete this slide if you are not using quartiles. What percentage of households in the UK have a pet?<br>
Can you now provide a new value (Q3) such that the true value is equally likely to be less than or greater than Q3?
Q3 should be between your M and U, but it should be closer to M because:
The true value is more likely to be similar to M than to U.
Values near U are only just plausible.
PLEASE INPUT YOUR Q3. Suppose you were offered a large prize for correctly guessing whether the true value is between M and Q3 or above Q3.
If you would guess above, you should increase your Q3
If you would guess below, you should decrease your Q3
Adjust your Q3 so that you do not favour guessing either above or below. TESTING YOUR Q3 Delete this slide if you are not using quartiles. What percentage of households in the UK have a pet?<br>
43
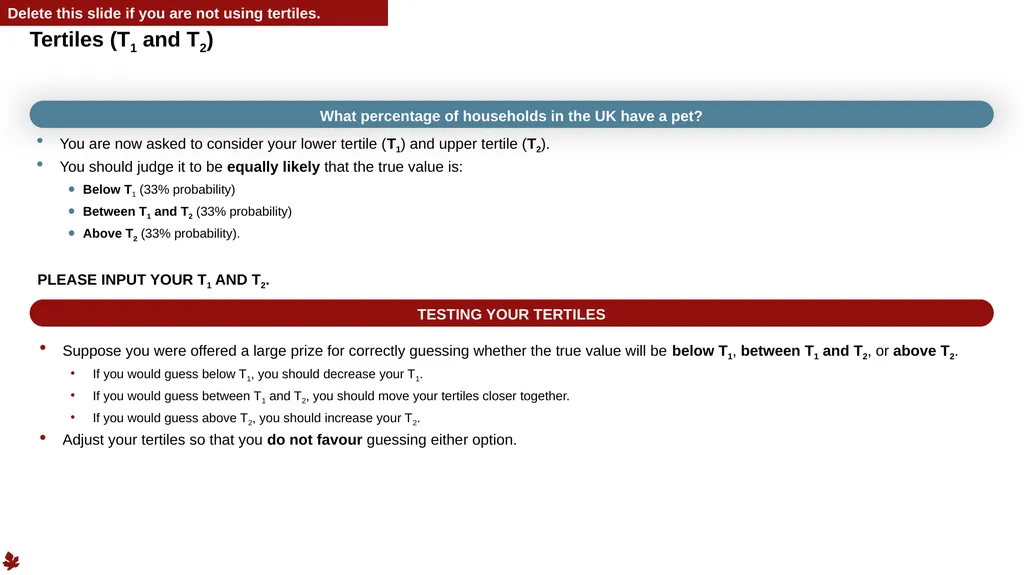
Tertiles (T1 and T2) You are now asked to consider your lower tertile (T1) and upper tertile (T2).
You should judge it to be equally likely that the true value is:
Below T1 (33% probability)
Between T1 and T2 (33% probability)
Above T2 (33% probability).
PLEASE INPUT YOUR T1 AND T2. Suppose you were offered a large prize for correctly guessing whether the true value will be below T1, between T1 and T2, or above T2.
If you would guess below T1, you should decrease your T1.
If you would guess between T1 and T2, you should move your tertiles closer together.
If you would guess above T2, you should increase your T2.
Adjust your tertiles so that you do not favour guessing either option. TESTING YOUR TERTILES Delete this slide if you are not using tertiles. What percentage of households in the UK have a pet?<br>
You should judge it to be equally likely that the true value is:
Below T1 (33% probability)
Between T1 and T2 (33% probability)
Above T2 (33% probability).
PLEASE INPUT YOUR T1 AND T2. Suppose you were offered a large prize for correctly guessing whether the true value will be below T1, between T1 and T2, or above T2.
If you would guess below T1, you should decrease your T1.
If you would guess between T1 and T2, you should move your tertiles closer together.
If you would guess above T2, you should increase your T2.
Adjust your tertiles so that you do not favour guessing either option. TESTING YOUR TERTILES Delete this slide if you are not using tertiles. What percentage of households in the UK have a pet?<br>
44
44 Time for a 5-minute break.<br>
45
The results of the practice exercise are shown below. What are the rationales for your judgements?
What are the key differences between experts? Why do these differences exist? Expert probability distributions to be added here<br>
What are the key differences between experts? Why do these differences exist? Expert probability distributions to be added here<br>
46
46<br>
47
Quantities to be elicited 47 Summary of quantities to be elicited<br>
48
Dependence between quantities 48 Summary of dependence between quantities and how this will be handled Delete this slide if not relevant.<br>
49
Definitions and assumptions 49 KEY DEFINITIONS Add a list of key definitions used for the purposes of this exercise. KEY ASSUMPTIONS Add a list of key assumptions used for the purposes of this exercise.<br>
50
Summary of evidence base 50 Summary of evidence base<br>
51
51<br>
52
Thanks for listening. 52 Any questions?<br>