
1. UV-Vis. Spectroscopy Fundamentals of
PC
Published · 62 slides · 0 views

1 / 1


Description
1. UV-Vis. Spectroscopy Fundamentals of Spectrophotometer Assay of tetracycline by calibration curve method 2. UV-Vis. Spectroscopy Spectrophotometric determination of Aspirin in tablets By standard addition method 3. IR Spectroscopy
Related Topics
Share
Embed code
Download this presentation From Below
"1. UV-Vis. Spectroscopy Fundamentals of" is the property of its rightful owner. Permission is granted to download and print the materials on this website for personal, non-commercial use only, and to display it on your personal computer provided you do not modify the materials and that you retain all copyright notices contained in the materials. By downloading content from our website, you accept the terms of this agreement.
Presentation Transcript
01
1. UV-Vis. Spectroscopy Fundamentals of Spectrophotometer
Assay of tetracycline by calibration curve method
2. UV-Vis. Spectroscopy
Spectrophotometric determination of Aspirin in tablets By standard addition method
3. IR Spectroscopy
Fundamentals of Infrared Spectroscopy Sold and liquid
4. IR Spectroscopy
Application of IR Spectroscopy in the Analysis of Pharmaceutical Substances
5. Electrochemical Analysis
Titration of the ascorbic acid (vitamin C) in tablets By pH meter
used first and 2nd derivatives
6.Flame spectroscopy.
7.presentation Practical
advance pharmaceutical analysis<br>
Assay of tetracycline by calibration curve method
2. UV-Vis. Spectroscopy
Spectrophotometric determination of Aspirin in tablets By standard addition method
3. IR Spectroscopy
Fundamentals of Infrared Spectroscopy Sold and liquid
4. IR Spectroscopy
Application of IR Spectroscopy in the Analysis of Pharmaceutical Substances
5. Electrochemical Analysis
Titration of the ascorbic acid (vitamin C) in tablets By pH meter
used first and 2nd derivatives
6.Flame spectroscopy.
7.presentation Practical
advance pharmaceutical analysis<br>
02
2 Principles of molecular spectroscopy
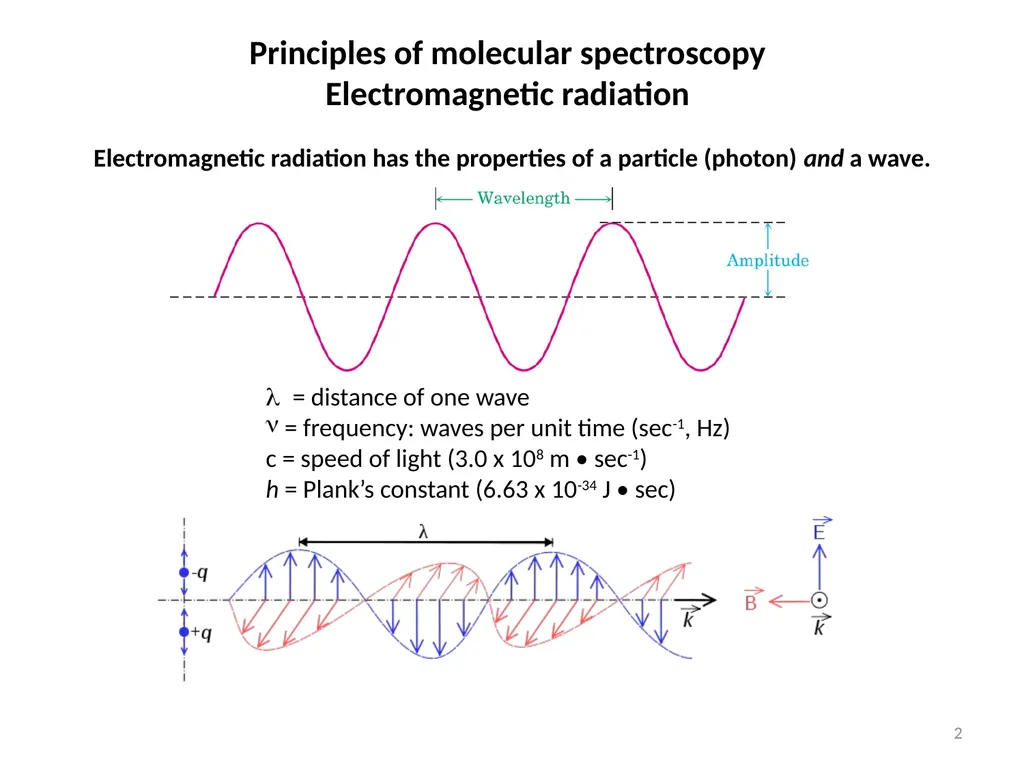
Electromagnetic radiation = distance of one wave
= frequency: waves per unit time (sec-1, Hz)
c = speed of light (3.0 x 10⁸ m • sec-1)
h = Plank’s constant (6.63 x 10⁻³⁴ J • sec) Electromagnetic radiation has the properties of a particle (photon) and a wave.<br>
Electromagnetic radiation = distance of one wave
= frequency: waves per unit time (sec-1, Hz)
c = speed of light (3.0 x 10⁸ m • sec-1)
h = Plank’s constant (6.63 x 10⁻³⁴ J • sec) Electromagnetic radiation has the properties of a particle (photon) and a wave.<br>
03
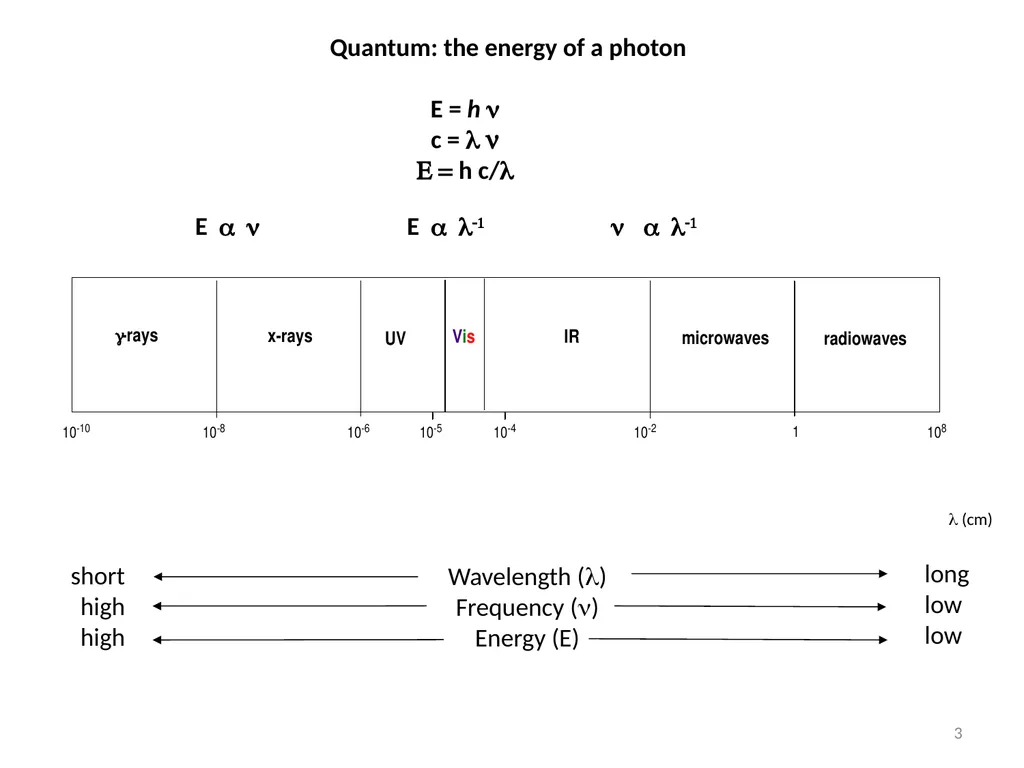
3 Quantum: the energy of a photon
E = h
c = n
E = h c/ (cm) short
high
high Wavelength ()
Frequency ()
Energy (E) long
low
low E E <br>
E = h
c = n
E = h c/ (cm) short
high
high Wavelength ()
Frequency ()
Energy (E) long
low
low E E <br>
04
4 Principles of molecular spectroscopy
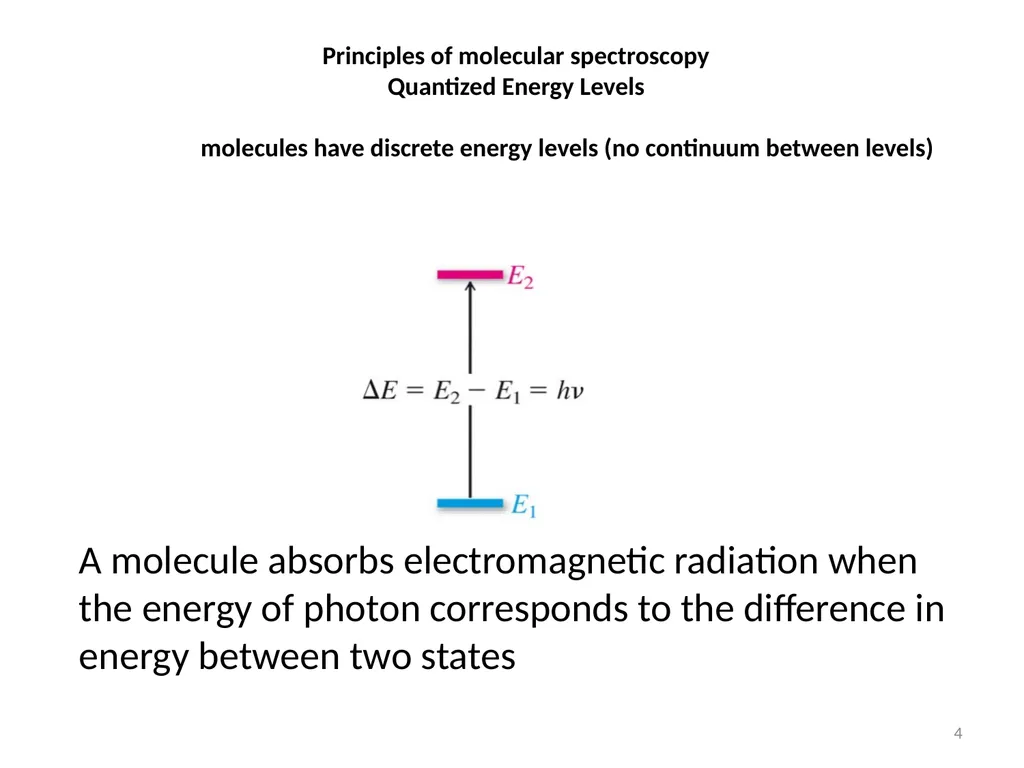
Quantized Energy Levels
molecules have discrete energy levels (no continuum between levels) A molecule absorbs electromagnetic radiation when
the energy of photon corresponds to the difference in energy between two states<br>
Quantized Energy Levels
molecules have discrete energy levels (no continuum between levels) A molecule absorbs electromagnetic radiation when
the energy of photon corresponds to the difference in energy between two states<br>
05
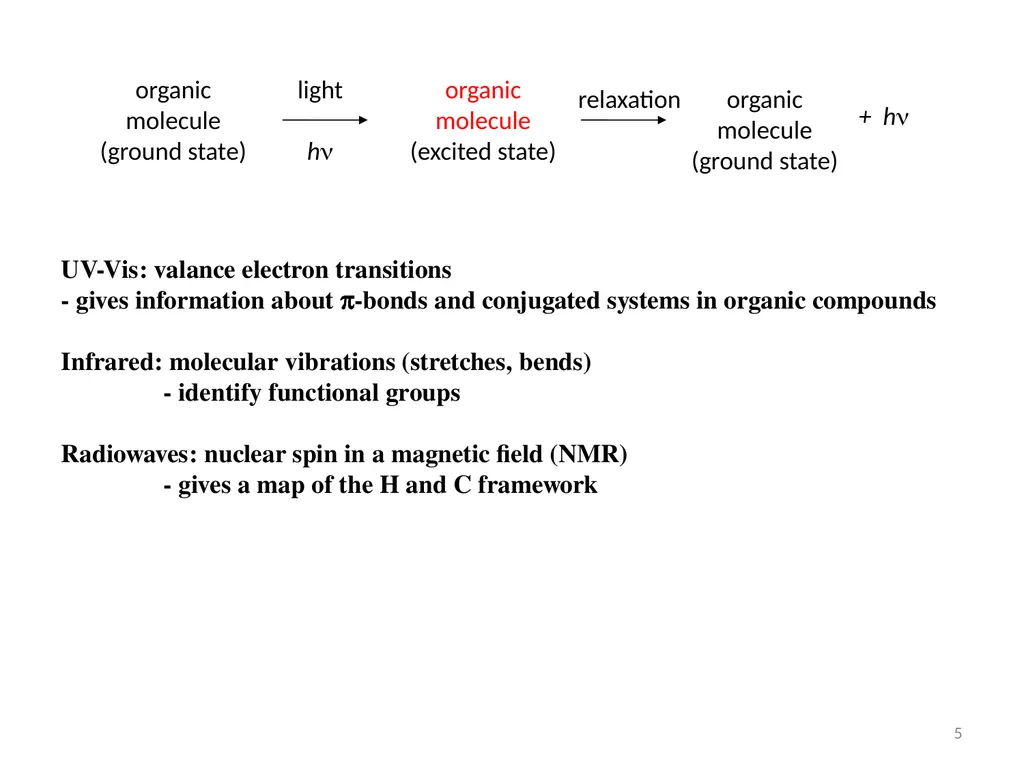
5 UV-Vis: valance electron transitions
- gives information about p-bonds and conjugated systems in organic compounds
Infrared: molecular vibrations (stretches, bends)
- identify functional groups
Radiowaves: nuclear spin in a magnetic field (NMR)
- gives a map of the H and C framework organic
molecule
(ground state) light
h organic
molecule
(excited state) organic
molecule
(ground state) + h relaxation<br>
- gives information about p-bonds and conjugated systems in organic compounds
Infrared: molecular vibrations (stretches, bends)
- identify functional groups
Radiowaves: nuclear spin in a magnetic field (NMR)
- gives a map of the H and C framework organic
molecule
(ground state) light
h organic
molecule
(excited state) organic
molecule
(ground state) + h relaxation<br>
06
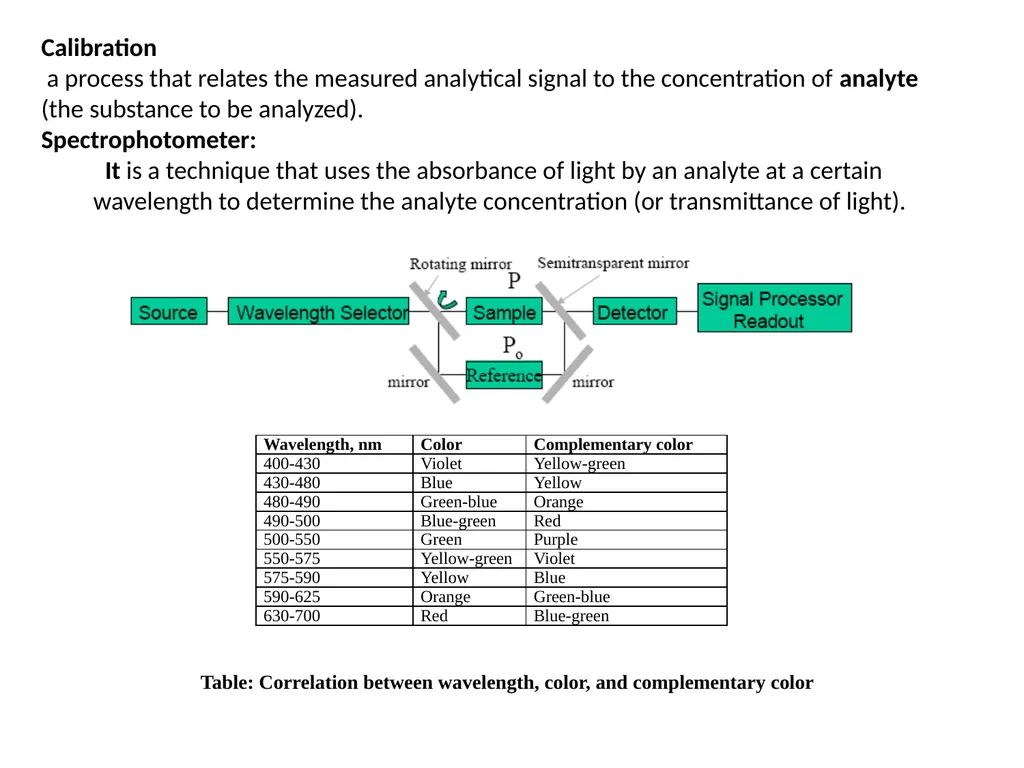
Table: Correlation between wavelength, color, and complementary color Calibration
a process that relates the measured analytical signal to the concentration of analyte
(the substance to be analyzed).
Spectrophotometer:
It is a technique that uses the absorbance of light by an analyte at a certain
wavelength to determine the analyte concentration (or transmittance of light).<br>
a process that relates the measured analytical signal to the concentration of analyte
(the substance to be analyzed).
Spectrophotometer:
It is a technique that uses the absorbance of light by an analyte at a certain
wavelength to determine the analyte concentration (or transmittance of light).<br>
07
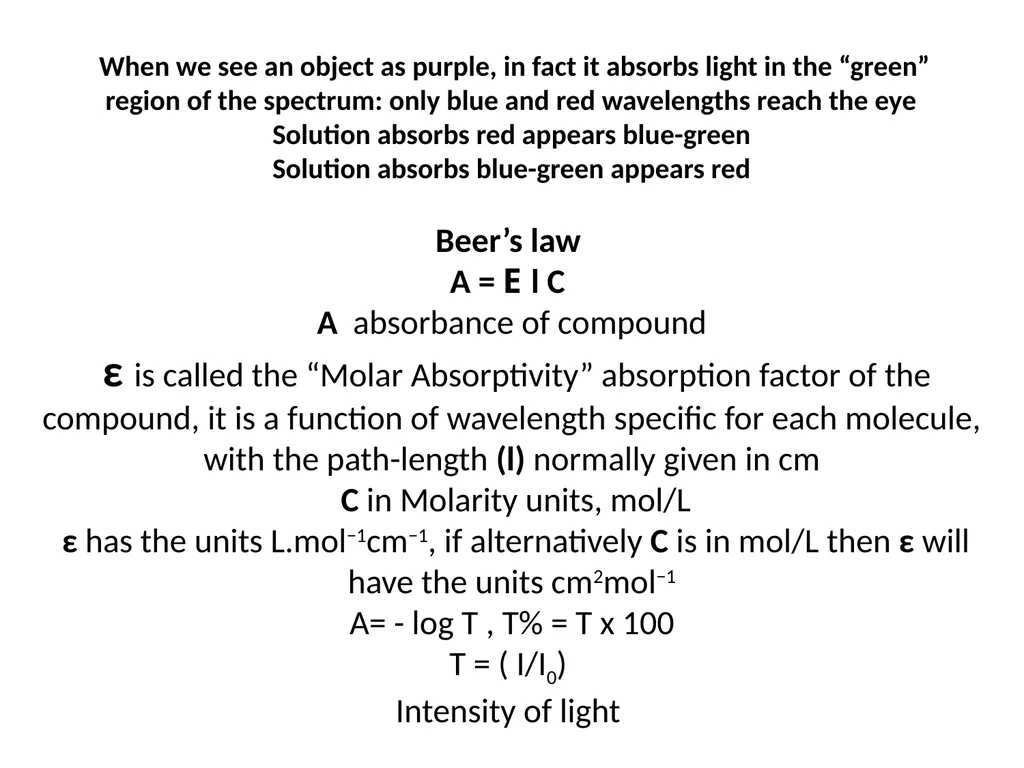
When we see an object as purple, in fact it absorbs light in the “green”
region of the spectrum: only blue and red wavelengths reach the eye
Solution absorbs red appears blue-green
Solution absorbs blue-green appears red Beer’s law
A = E l C
A absorbance of compound
ε is called the “Molar Absorptivity” absorption factor of the compound, it is a function of wavelength specific for each molecule, with the path-length (l) normally given in cm
C in Molarity units, mol/L
ε has the units L.mol−1cm−1, if alternatively C is in mol/L then ε will have the units cm2mol−1
A= - log T , T% = T x 100
T = ( I/I0)
Intensity of light<br>
region of the spectrum: only blue and red wavelengths reach the eye
Solution absorbs red appears blue-green
Solution absorbs blue-green appears red Beer’s law
A = E l C
A absorbance of compound
ε is called the “Molar Absorptivity” absorption factor of the compound, it is a function of wavelength specific for each molecule, with the path-length (l) normally given in cm
C in Molarity units, mol/L
ε has the units L.mol−1cm−1, if alternatively C is in mol/L then ε will have the units cm2mol−1
A= - log T , T% = T x 100
T = ( I/I0)
Intensity of light<br>
08
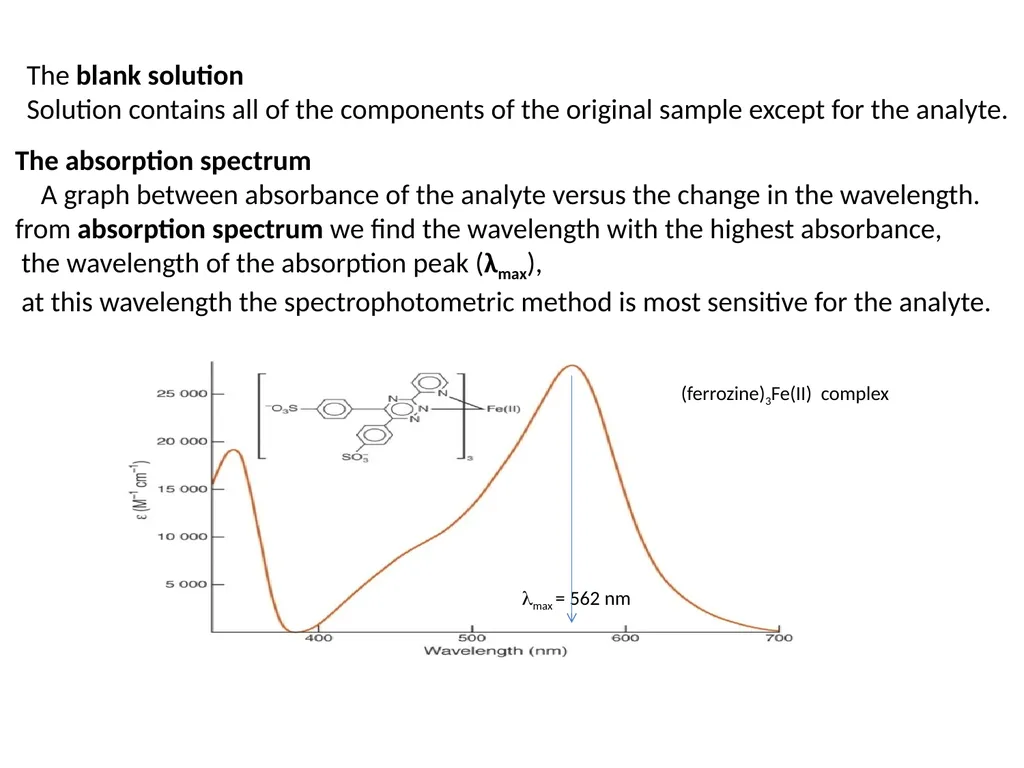
The absorption spectrum
A graph between absorbance of the analyte versus the change in the wavelength.
from absorption spectrum we find the wavelength with the highest absorbance,
the wavelength of the absorption peak (λmax),
at this wavelength the spectrophotometric method is most sensitive for the analyte. The blank solution
Solution contains all of the components of the original sample except for the analyte. max = 562 nm (ferrozine)3Fe(II) complex<br>
A graph between absorbance of the analyte versus the change in the wavelength.
from absorption spectrum we find the wavelength with the highest absorbance,
the wavelength of the absorption peak (λmax),
at this wavelength the spectrophotometric method is most sensitive for the analyte. The blank solution
Solution contains all of the components of the original sample except for the analyte. max = 562 nm (ferrozine)3Fe(II) complex<br>
09
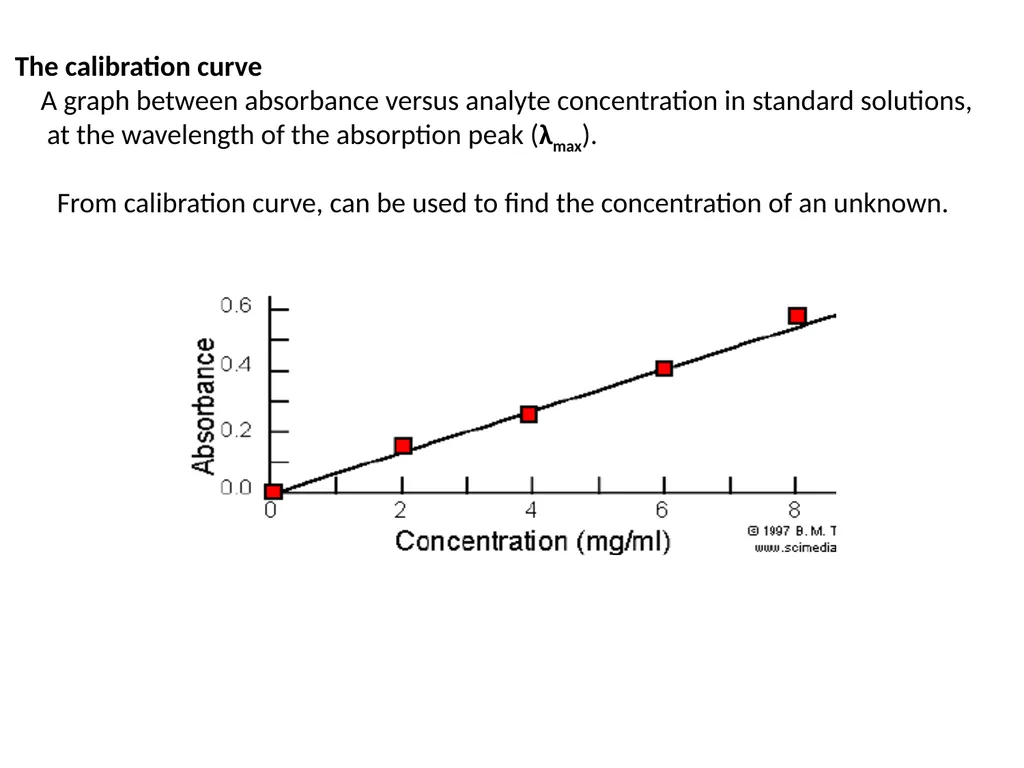
From calibration curve, can be used to find the concentration of an unknown. The calibration curve
A graph between absorbance versus analyte concentration in standard solutions,
at the wavelength of the absorption peak (λmax).<br>
A graph between absorbance versus analyte concentration in standard solutions,
at the wavelength of the absorption peak (λmax).<br>
10
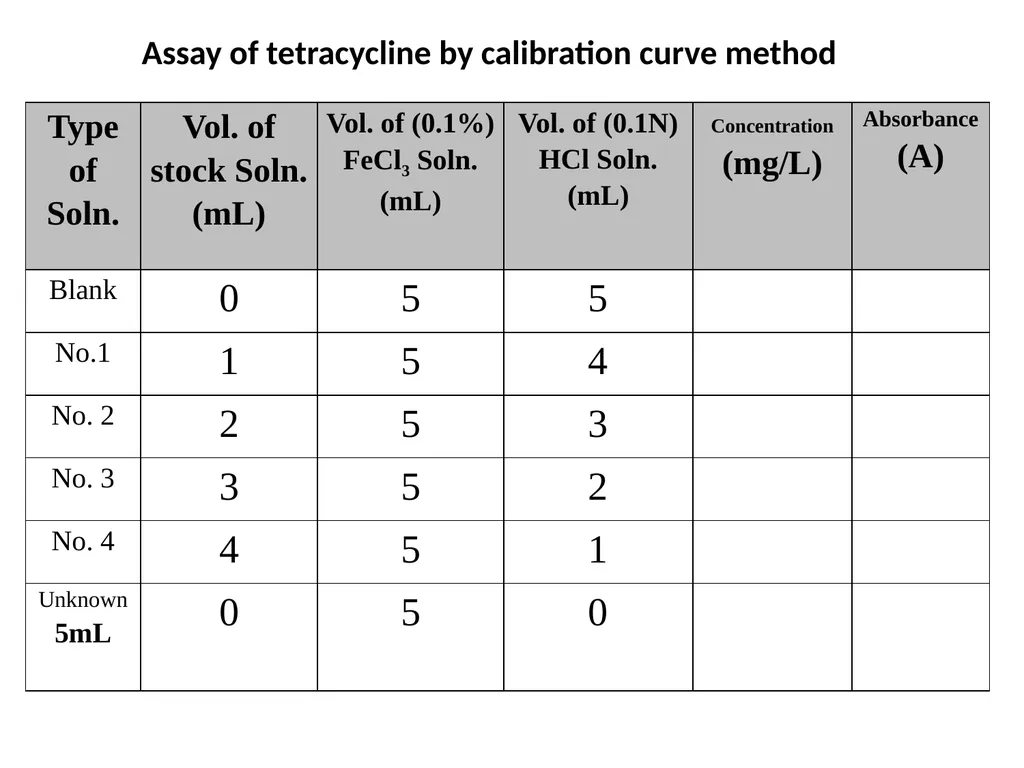
Assay of tetracycline by calibration curve method<br>
11
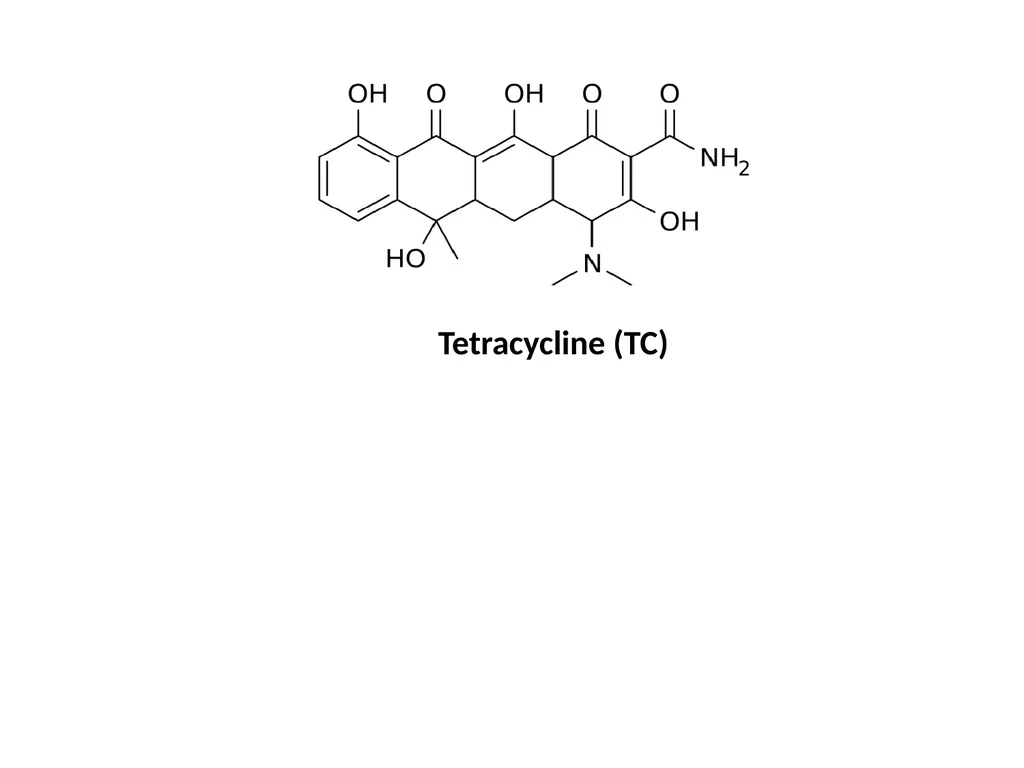
Tetracycline (TC)<br>
12
Measuring the absorption spectrum and determining λmax
This part of the experiment each pair of students should record all absorbance at each wavelength and draw the absorption spectrum.
Rinse one of the cuvettes with blank solution, put the cuvette in the sample compartment, this is the reference solution, set the wavelength to 350 nm, then set the Absorbance to zero.
Rinse a second cuvette standard solution No.4, place the cell in the sample compartment, measure the Absorbance at 350 nm and record in your notebook.
Repeat this procedure (steps 1 and 2 above) for the two cuvettes at wavelengths 360,370, 380, 390, 400, 420, --.600 nm, first setting A = 0 for the cuvette with blank, then measuring A for the cuvette with solution No.4, recording the absorbance at each wavelength, record in data table (at absorbance begin larger reduce wavelength intervals to 5nm).
Prepare a graph of absorbance (A) vs. wavelength (λ) and determine λmax (maximum wavelength). Attach this graph to the lab report, (Plotting Use the program Excel to plot the absorption spectrum and determining λmax).<br>
This part of the experiment each pair of students should record all absorbance at each wavelength and draw the absorption spectrum.
Rinse one of the cuvettes with blank solution, put the cuvette in the sample compartment, this is the reference solution, set the wavelength to 350 nm, then set the Absorbance to zero.
Rinse a second cuvette standard solution No.4, place the cell in the sample compartment, measure the Absorbance at 350 nm and record in your notebook.
Repeat this procedure (steps 1 and 2 above) for the two cuvettes at wavelengths 360,370, 380, 390, 400, 420, --.600 nm, first setting A = 0 for the cuvette with blank, then measuring A for the cuvette with solution No.4, recording the absorbance at each wavelength, record in data table (at absorbance begin larger reduce wavelength intervals to 5nm).
Prepare a graph of absorbance (A) vs. wavelength (λ) and determine λmax (maximum wavelength). Attach this graph to the lab report, (Plotting Use the program Excel to plot the absorption spectrum and determining λmax).<br>
13
The calibration curve
This part of the experiment must be done by each pair of students separately.
Set the wavelength at (λmax), place the cuvette with blank in the cell compartment and again set the Absorbance to zero.
Measure and record the Absorbance of each of the four standard solutions & unknown, starting with the most dilute standard, after each measurement, rinse the cuvette with the next standard, not with blank!
Draw a plot having X-axis as concentration (mg/L) and Y-axis as Absorbance at λmax (Plotting Use the program Excel to plot the calibration curve).
Use Beer’s law to calculate ε for TC, given the cell width (path length l) to be 1 cm.
Use calibration curve to calculate concentration of unknown solution.
Find application for calibration curve equation, to calculate concentration of unknown solution?<br>
This part of the experiment must be done by each pair of students separately.
Set the wavelength at (λmax), place the cuvette with blank in the cell compartment and again set the Absorbance to zero.
Measure and record the Absorbance of each of the four standard solutions & unknown, starting with the most dilute standard, after each measurement, rinse the cuvette with the next standard, not with blank!
Draw a plot having X-axis as concentration (mg/L) and Y-axis as Absorbance at λmax (Plotting Use the program Excel to plot the calibration curve).
Use Beer’s law to calculate ε for TC, given the cell width (path length l) to be 1 cm.
Use calibration curve to calculate concentration of unknown solution.
Find application for calibration curve equation, to calculate concentration of unknown solution?<br>
14
Spectrophotometric determination of Aspirin in tablets
By standard addition method
For good analysis the sample must have these properties:
(1) Stability in solution.
(2) Adherence to Beer's law.
(3) Large molar absorptive ().
(4) Sufficient separation of the desired analyte absorbance wavelength from interfering substances.
If Not, the substance is usually converted into a new species suitable for quantitative spectroscopy.
SAMPLE + CHROMOGENIC REAGENT → UV-VIS ABSORBING PRODUCT
Direct calibration curve method can be applied for analyzing unknown sample only and only if the standard solutions and the unknown solution are prepared and measured under exactly the same conditions
matrix effects everything except the analyte, contributes significantly to the absorbance of a sample and is also highly variable.
The method that can be used to improve results is the method of standard additions, the basic idea is to add standard to the analyte sample so that the standard is subjected to the same matrix effects as the analyte.<br>
By standard addition method
For good analysis the sample must have these properties:
(1) Stability in solution.
(2) Adherence to Beer's law.
(3) Large molar absorptive ().
(4) Sufficient separation of the desired analyte absorbance wavelength from interfering substances.
If Not, the substance is usually converted into a new species suitable for quantitative spectroscopy.
SAMPLE + CHROMOGENIC REAGENT → UV-VIS ABSORBING PRODUCT
Direct calibration curve method can be applied for analyzing unknown sample only and only if the standard solutions and the unknown solution are prepared and measured under exactly the same conditions
matrix effects everything except the analyte, contributes significantly to the absorbance of a sample and is also highly variable.
The method that can be used to improve results is the method of standard additions, the basic idea is to add standard to the analyte sample so that the standard is subjected to the same matrix effects as the analyte.<br>
15
Aspirin sample
Accurately record the weight of a group of ten aspirin tablets so that you can determine an average tablet weight, use a mortar and pestle to crush enough tablets to produce an average (g) tablet powder, using a clean dry weighing bottle (beaker or conical flask), add 20 mL of ethanol (measure by graduated cylinder), swirl gently to dissolve. (Aspirin is not very soluble in water, ethanol helps the aspirin dissolve).
Note that an aspirin tablet contains other compounds in addition to aspirin, some of these are not very soluble, and the solution will be cloudy due to insoluble components of the tablet.
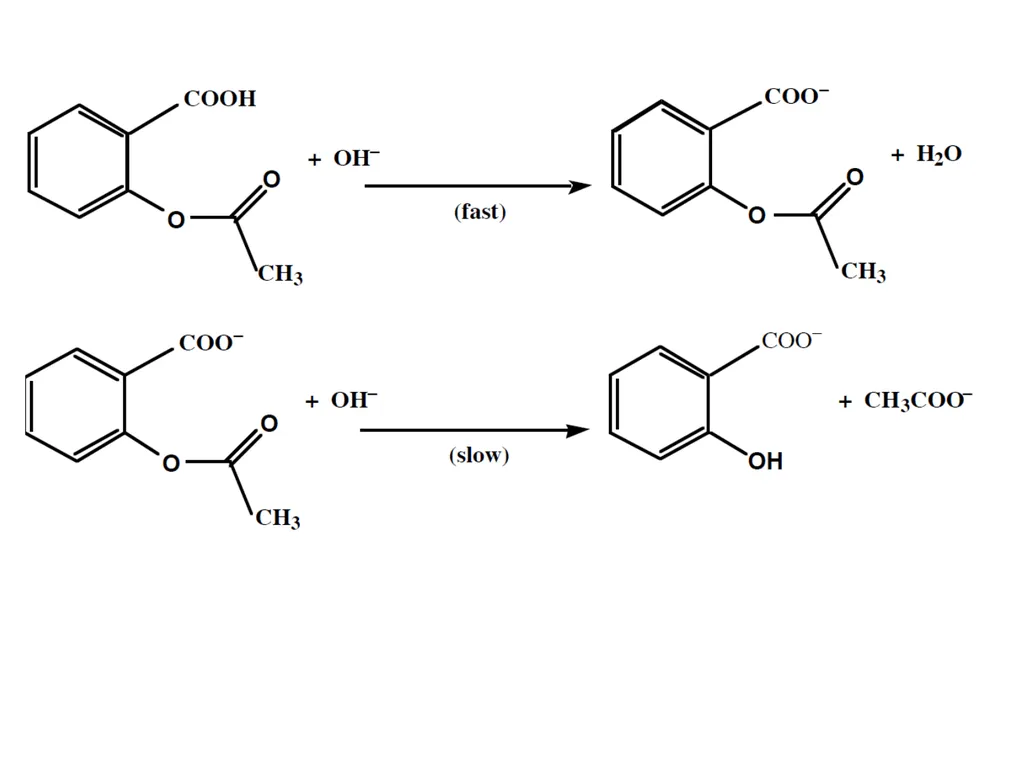
Add 75mL of NaOH (0.1N) than heat in a water bath to speed up the hydrolysis reaction, avoid boiling, because the sample may decompose, while heating, swirl the beaker occasionally, after 15 minutes, remove sample from the water bath and cool for 5 minutes, than filtered the solution.<br>
Accurately record the weight of a group of ten aspirin tablets so that you can determine an average tablet weight, use a mortar and pestle to crush enough tablets to produce an average (g) tablet powder, using a clean dry weighing bottle (beaker or conical flask), add 20 mL of ethanol (measure by graduated cylinder), swirl gently to dissolve. (Aspirin is not very soluble in water, ethanol helps the aspirin dissolve).
Note that an aspirin tablet contains other compounds in addition to aspirin, some of these are not very soluble, and the solution will be cloudy due to insoluble components of the tablet.
Add 75mL of NaOH (0.1N) than heat in a water bath to speed up the hydrolysis reaction, avoid boiling, because the sample may decompose, while heating, swirl the beaker occasionally, after 15 minutes, remove sample from the water bath and cool for 5 minutes, than filtered the solution.<br>
16
Preparing the stock solution and standard solutions:
Stock solution of sodium salicylate:
Weight a 0.3 g of sodium salicylate in beaker, dissolve the solid by the addition of D.W., than transfer to volumetric flask (1L), and continue adding D.W. to the mark on the volumetric flask.
Ferric Nitrate:
Dissolve 1.0 g ferric nitrate in 99 mL of water to make a 1% solution of ferric nitrate, (Total volume =100 mL of 1% ferric nitrate),(use2g of Fe2(SO4)3 in 200 mL)
Nitric Acid 1:
Prepare 100 mL of 0.07 M nitric acid, ( 2.5mL of HNO3 WT.%=65, D=1.4Kg/L, in 500 mL)
Standard solution:
Transfer 10 mL of stock solution to a volumetric flask (100mL), than dilute with D.W. to mark (Its concentration is …… mg/L).
Dilute Ferric Nitrate: Mix 5 mL of 1% ferric nitrate with 4 mL of 0.07 M HNO3 (nitric acid 1) and label the container “dilute ferric nitrate.”
Unknown solution: Transfer 5.00 mL of Aspirin sample solution to a volumetric flask (10mL), than dilute with D.W.<br>
Stock solution of sodium salicylate:
Weight a 0.3 g of sodium salicylate in beaker, dissolve the solid by the addition of D.W., than transfer to volumetric flask (1L), and continue adding D.W. to the mark on the volumetric flask.
Ferric Nitrate:
Dissolve 1.0 g ferric nitrate in 99 mL of water to make a 1% solution of ferric nitrate, (Total volume =100 mL of 1% ferric nitrate),(use2g of Fe2(SO4)3 in 200 mL)
Nitric Acid 1:
Prepare 100 mL of 0.07 M nitric acid, ( 2.5mL of HNO3 WT.%=65, D=1.4Kg/L, in 500 mL)
Standard solution:
Transfer 10 mL of stock solution to a volumetric flask (100mL), than dilute with D.W. to mark (Its concentration is …… mg/L).
Dilute Ferric Nitrate: Mix 5 mL of 1% ferric nitrate with 4 mL of 0.07 M HNO3 (nitric acid 1) and label the container “dilute ferric nitrate.”
Unknown solution: Transfer 5.00 mL of Aspirin sample solution to a volumetric flask (10mL), than dilute with D.W.<br>
17
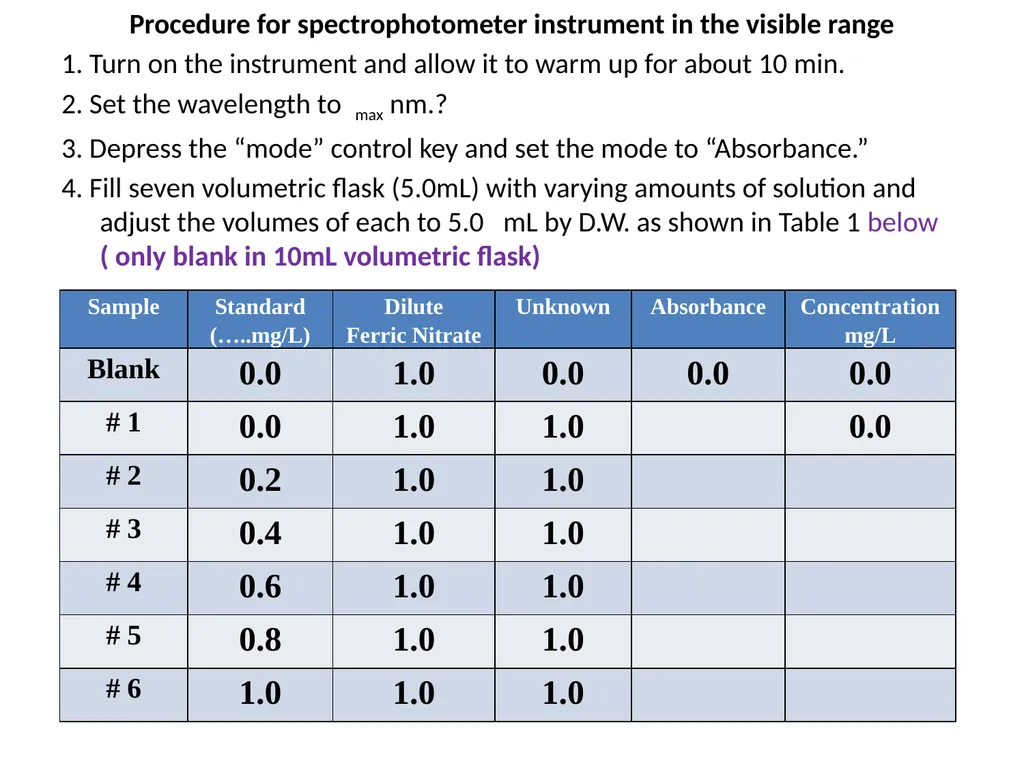
Procedure for spectrophotometer instrument in the visible range
1. Turn on the instrument and allow it to warm up for about 10 min.
2. Set the wavelength to max nm.?
3. Depress the “mode” control key and set the mode to “Absorbance.”
4. Fill seven volumetric flask (5.0mL) with varying amounts of solution and adjust the volumes of each to 5.0 mL by D.W. as shown in Table 1 below ( only blank in 10mL volumetric flask)<br>
1. Turn on the instrument and allow it to warm up for about 10 min.
2. Set the wavelength to max nm.?
3. Depress the “mode” control key and set the mode to “Absorbance.”
4. Fill seven volumetric flask (5.0mL) with varying amounts of solution and adjust the volumes of each to 5.0 mL by D.W. as shown in Table 1 below ( only blank in 10mL volumetric flask)<br>
18
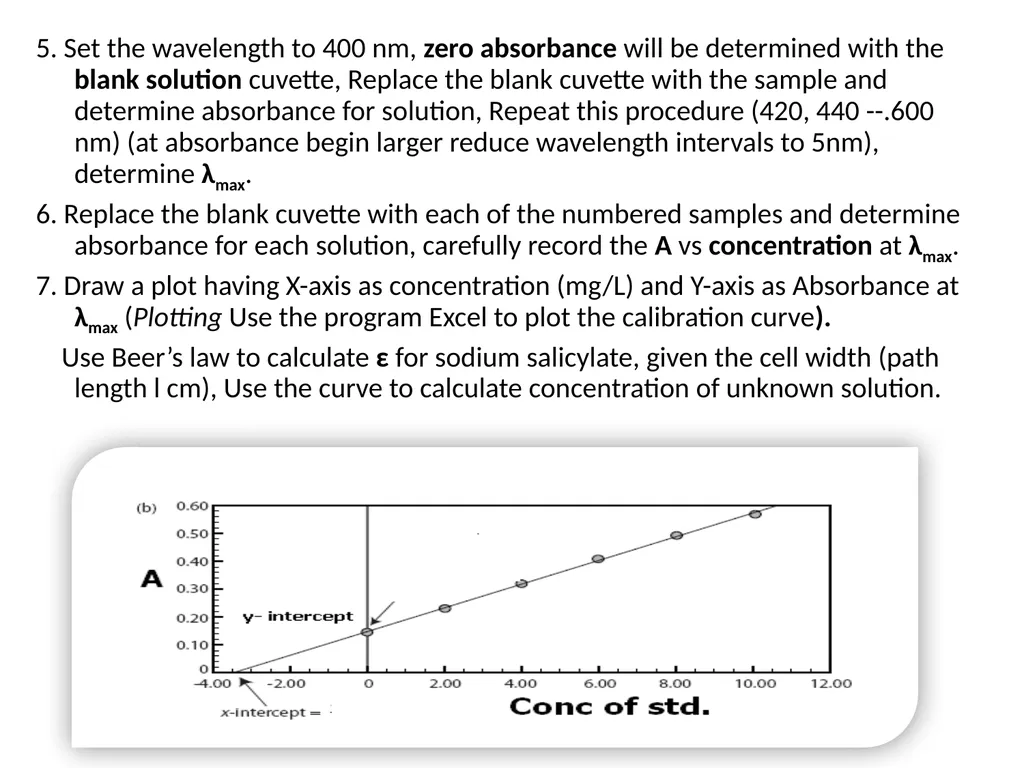
5. Set the wavelength to 400 nm, zero absorbance will be determined with the blank solution cuvette, Replace the blank cuvette with the sample and determine absorbance for solution, Repeat this procedure (420, 440 --.600 nm) (at absorbance begin larger reduce wavelength intervals to 5nm), determine λmax.
6. Replace the blank cuvette with each of the numbered samples and determine absorbance for each solution, carefully record the A vs concentration at λmax.
7. Draw a plot having X-axis as concentration (mg/L) and Y-axis as Absorbance at λmax (Plotting Use the program Excel to plot the calibration curve).
Use Beer’s law to calculate ε for sodium salicylate, given the cell width (path length l cm), Use the curve to calculate concentration of unknown solution.<br>
6. Replace the blank cuvette with each of the numbered samples and determine absorbance for each solution, carefully record the A vs concentration at λmax.
7. Draw a plot having X-axis as concentration (mg/L) and Y-axis as Absorbance at λmax (Plotting Use the program Excel to plot the calibration curve).
Use Beer’s law to calculate ε for sodium salicylate, given the cell width (path length l cm), Use the curve to calculate concentration of unknown solution.<br>
19
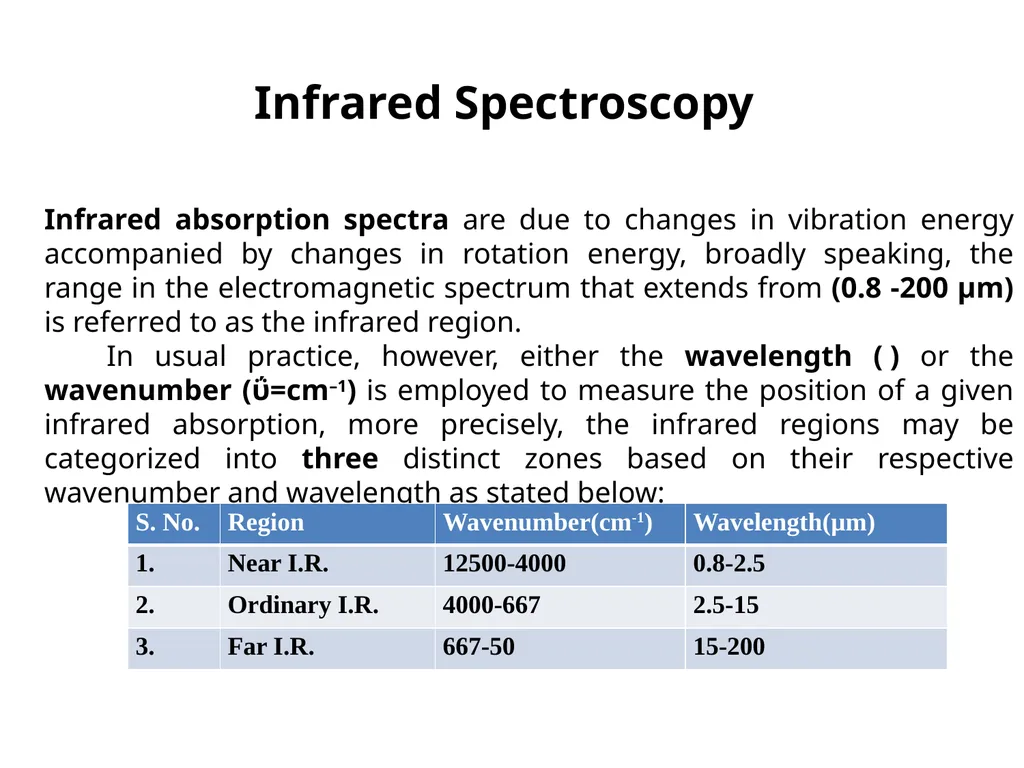
Infrared Spectroscopy Infrared absorption spectra are due to changes in vibration energy accompanied by changes in rotation energy, broadly speaking, the range in the electromagnetic spectrum that extends from (0.8 -200 µm) is referred to as the infrared region.
In usual practice, however, either the wavelength () or the wavenumber (ΰ=cm–1) is employed to measure the position of a given infrared absorption, more precisely, the infrared regions may be categorized into three distinct zones based on their respective wavenumber and wavelength as stated below:<br>
In usual practice, however, either the wavelength () or the wavenumber (ΰ=cm–1) is employed to measure the position of a given infrared absorption, more precisely, the infrared regions may be categorized into three distinct zones based on their respective wavenumber and wavelength as stated below:<br>
20
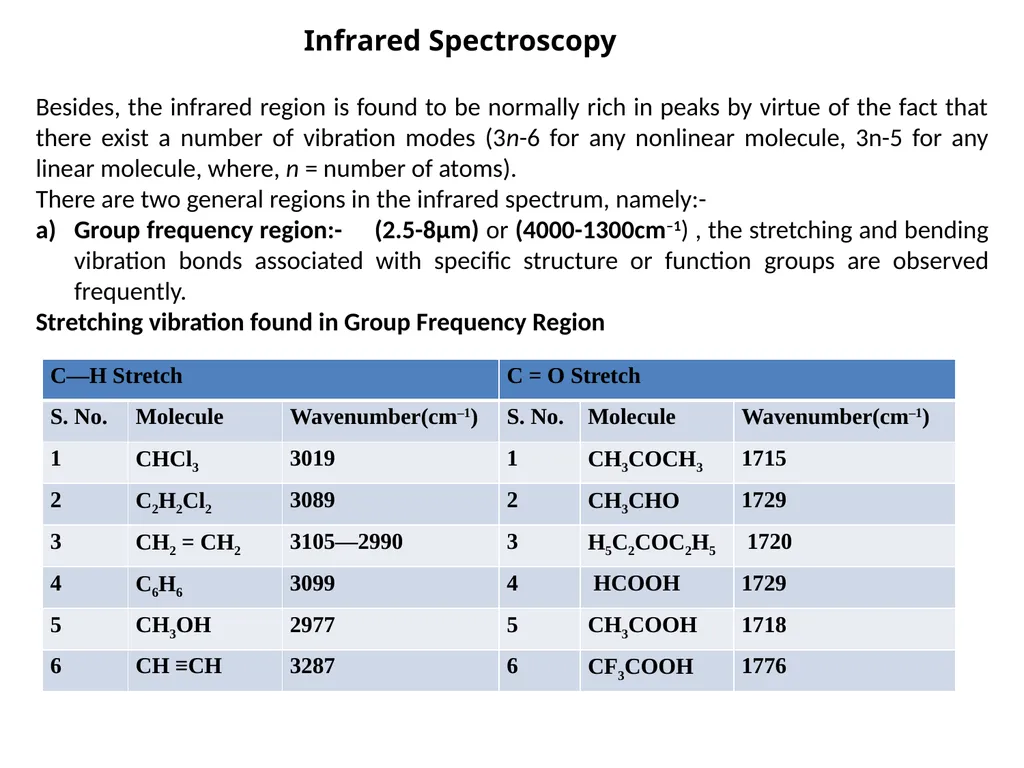
Besides, the infrared region is found to be normally rich in peaks by virtue of the fact that there exist a number of vibration modes (3n-6 for any nonlinear molecule, 3n-5 for any linear molecule, where, n = number of atoms).
There are two general regions in the infrared spectrum, namely:-
Group frequency region:- (2.5-8µm) or (4000-1300cm–1) , the stretching and bending vibration bonds associated with specific structure or function groups are observed frequently.
Stretching vibration found in Group Frequency Region Infrared Spectroscopy<br>
There are two general regions in the infrared spectrum, namely:-
Group frequency region:- (2.5-8µm) or (4000-1300cm–1) , the stretching and bending vibration bonds associated with specific structure or function groups are observed frequently.
Stretching vibration found in Group Frequency Region Infrared Spectroscopy<br>
21
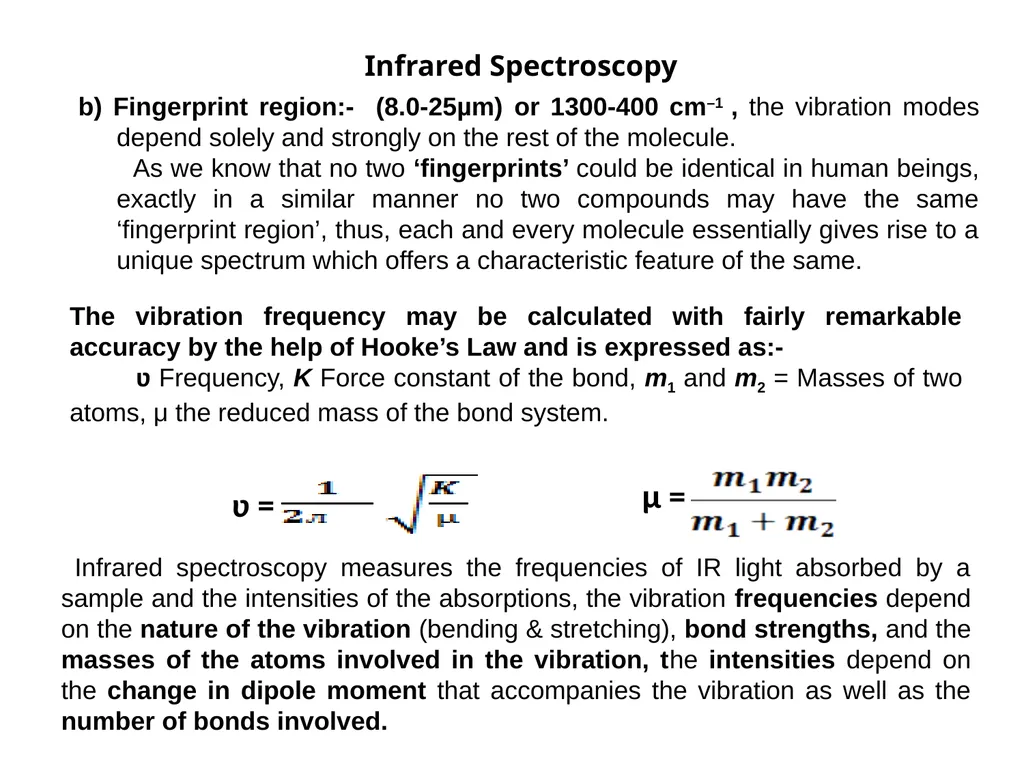
b) Fingerprint region:- (8.0-25µm) or 1300-400 cm–1 , the vibration modes depend solely and strongly on the rest of the molecule.
As we know that no two ‘fingerprints’ could be identical in human beings, exactly in a similar manner no two compounds may have the same ‘fingerprint region’, thus, each and every molecule essentially gives rise to a unique spectrum which offers a characteristic feature of the same. Infrared Spectroscopy The vibration frequency may be calculated with fairly remarkable accuracy by the help of Hooke’s Law and is expressed as:-
ʋ Frequency, K Force constant of the bond, m1 and m2 = Masses of two atoms, μ the reduced mass of the bond system. ʋ = μ = Infrared spectroscopy measures the frequencies of IR light absorbed by a sample and the intensities of the absorptions, the vibration frequencies depend on the nature of the vibration (bending & stretching), bond strengths, and the masses of the atoms involved in the vibration, the intensities depend on the change in dipole moment that accompanies the vibration as well as the number of bonds involved.<br>
As we know that no two ‘fingerprints’ could be identical in human beings, exactly in a similar manner no two compounds may have the same ‘fingerprint region’, thus, each and every molecule essentially gives rise to a unique spectrum which offers a characteristic feature of the same. Infrared Spectroscopy The vibration frequency may be calculated with fairly remarkable accuracy by the help of Hooke’s Law and is expressed as:-
ʋ Frequency, K Force constant of the bond, m1 and m2 = Masses of two atoms, μ the reduced mass of the bond system. ʋ = μ = Infrared spectroscopy measures the frequencies of IR light absorbed by a sample and the intensities of the absorptions, the vibration frequencies depend on the nature of the vibration (bending & stretching), bond strengths, and the masses of the atoms involved in the vibration, the intensities depend on the change in dipole moment that accompanies the vibration as well as the number of bonds involved.<br>
22
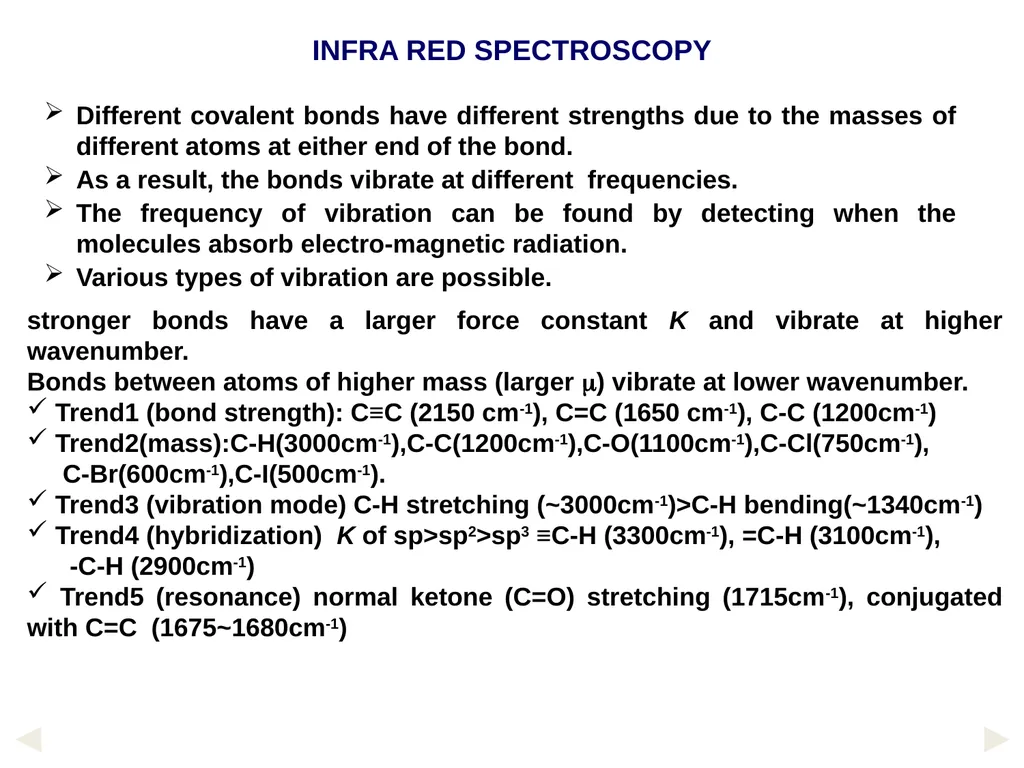
Different covalent bonds have different strengths due to the masses of different atoms at either end of the bond.
As a result, the bonds vibrate at different frequencies.
The frequency of vibration can be found by detecting when the molecules absorb electro-magnetic radiation.
Various types of vibration are possible. INFRA RED SPECTROSCOPY stronger bonds have a larger force constant K and vibrate at higher wavenumber.
Bonds between atoms of higher mass (larger ) vibrate at lower wavenumber.
Trend1 (bond strength): C≡C (2150 cm-1), C=C (1650 cm-1), C-C (1200cm-1)
Trend2(mass):C-H(3000cm-1),C-C(1200cm-1),C-O(1100cm-1),C-Cl(750cm-1),
C-Br(600cm-1),C-I(500cm-1).
Trend3 (vibration mode) C-H stretching (~3000cm-1)>C-H bending(~1340cm-1)
Trend4 (hybridization) K of sp>sp2>sp3 ≡C-H (3300cm-1), =C-H (3100cm-1),
-C-H (2900cm-1)
Trend5 (resonance) normal ketone (C=O) stretching (1715cm-1), conjugated with C=C (1675~1680cm-1)<br>
As a result, the bonds vibrate at different frequencies.
The frequency of vibration can be found by detecting when the molecules absorb electro-magnetic radiation.
Various types of vibration are possible. INFRA RED SPECTROSCOPY stronger bonds have a larger force constant K and vibrate at higher wavenumber.
Bonds between atoms of higher mass (larger ) vibrate at lower wavenumber.
Trend1 (bond strength): C≡C (2150 cm-1), C=C (1650 cm-1), C-C (1200cm-1)
Trend2(mass):C-H(3000cm-1),C-C(1200cm-1),C-O(1100cm-1),C-Cl(750cm-1),
C-Br(600cm-1),C-I(500cm-1).
Trend3 (vibration mode) C-H stretching (~3000cm-1)>C-H bending(~1340cm-1)
Trend4 (hybridization) K of sp>sp2>sp3 ≡C-H (3300cm-1), =C-H (3100cm-1),
-C-H (2900cm-1)
Trend5 (resonance) normal ketone (C=O) stretching (1715cm-1), conjugated with C=C (1675~1680cm-1)<br>
23
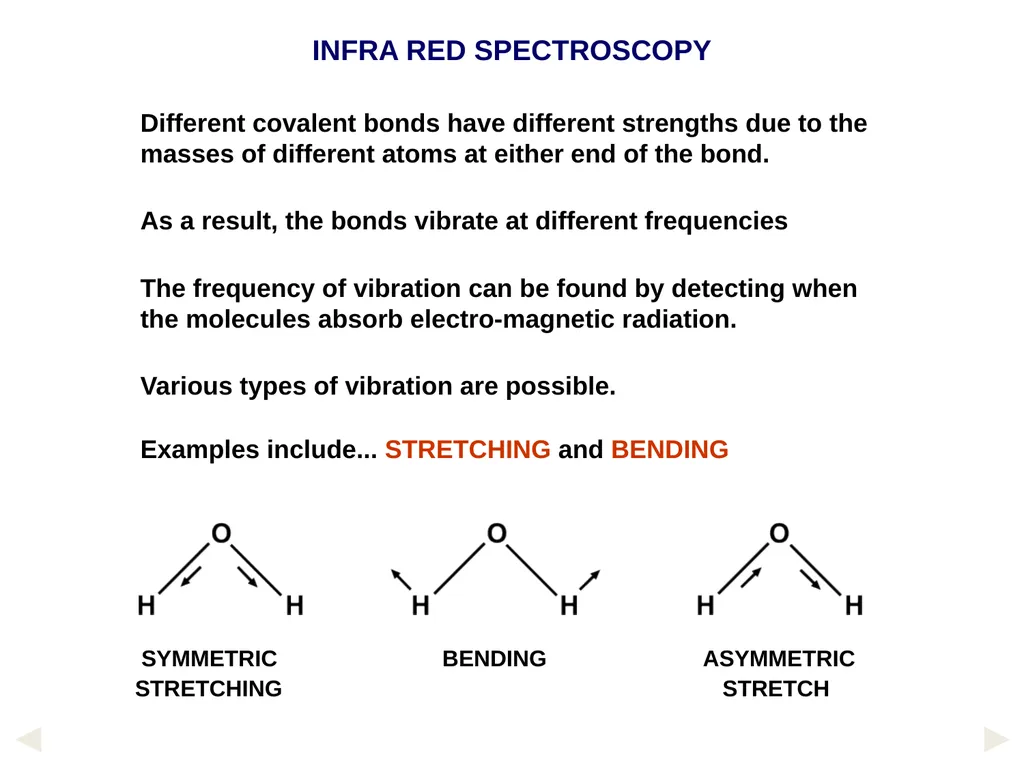
Different covalent bonds have different strengths due to the masses of different atoms at either end of the bond.
As a result, the bonds vibrate at different frequencies
The frequency of vibration can be found by detecting when the molecules absorb electro-magnetic radiation.
Various types of vibration are possible.
Examples include... STRETCHING and BENDING INFRA RED SPECTROSCOPY SYMMETRIC BENDING ASYMMETRIC
STRETCHING STRETCH<br>
As a result, the bonds vibrate at different frequencies
The frequency of vibration can be found by detecting when the molecules absorb electro-magnetic radiation.
Various types of vibration are possible.
Examples include... STRETCHING and BENDING INFRA RED SPECTROSCOPY SYMMETRIC BENDING ASYMMETRIC
STRETCHING STRETCH<br>
24
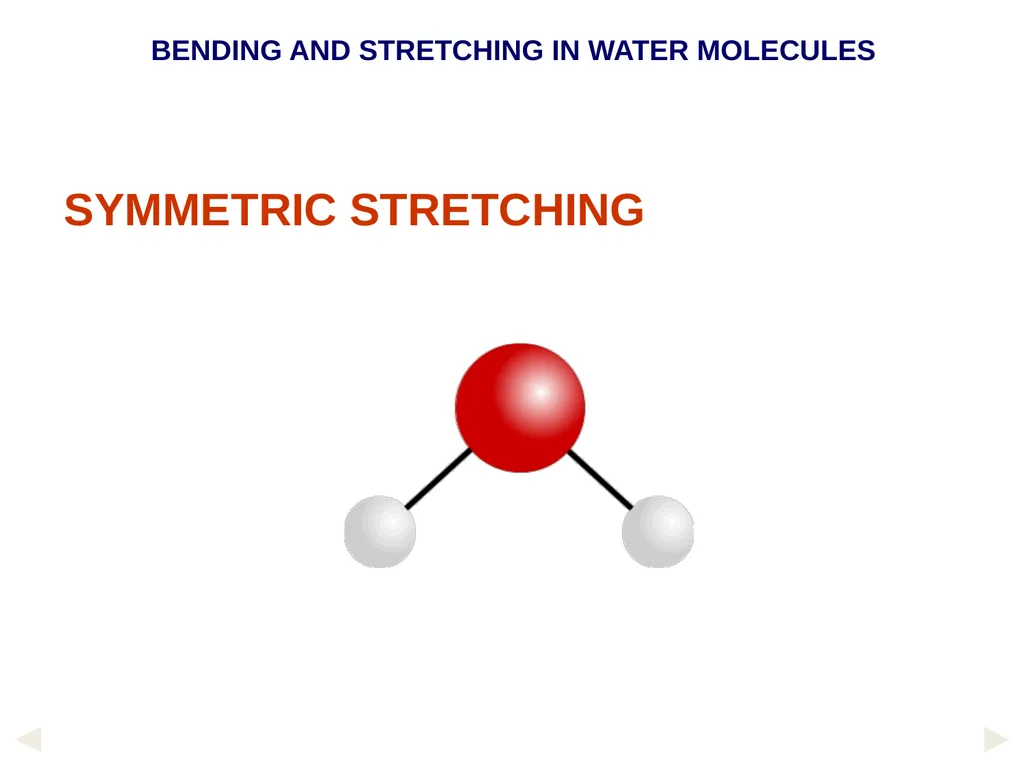
SYMMETRIC STRETCHING BENDING AND STRETCHING IN WATER MOLECULES<br>
25
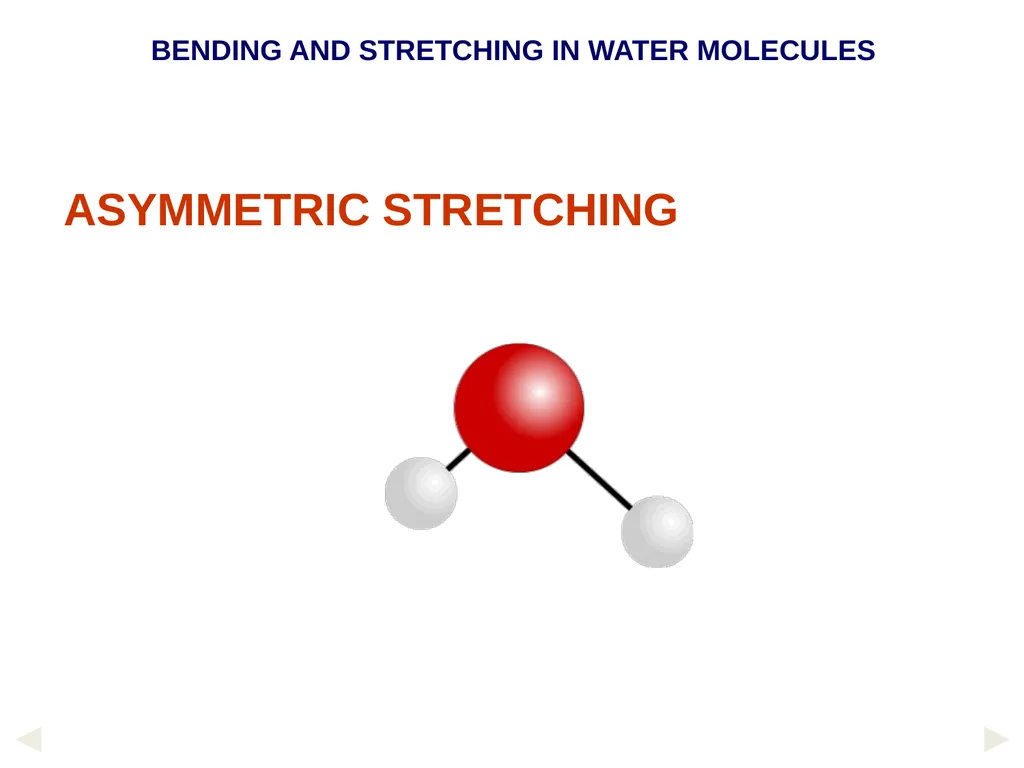
ASYMMETRIC STRETCHING BENDING AND STRETCHING IN WATER MOLECULES<br>
26
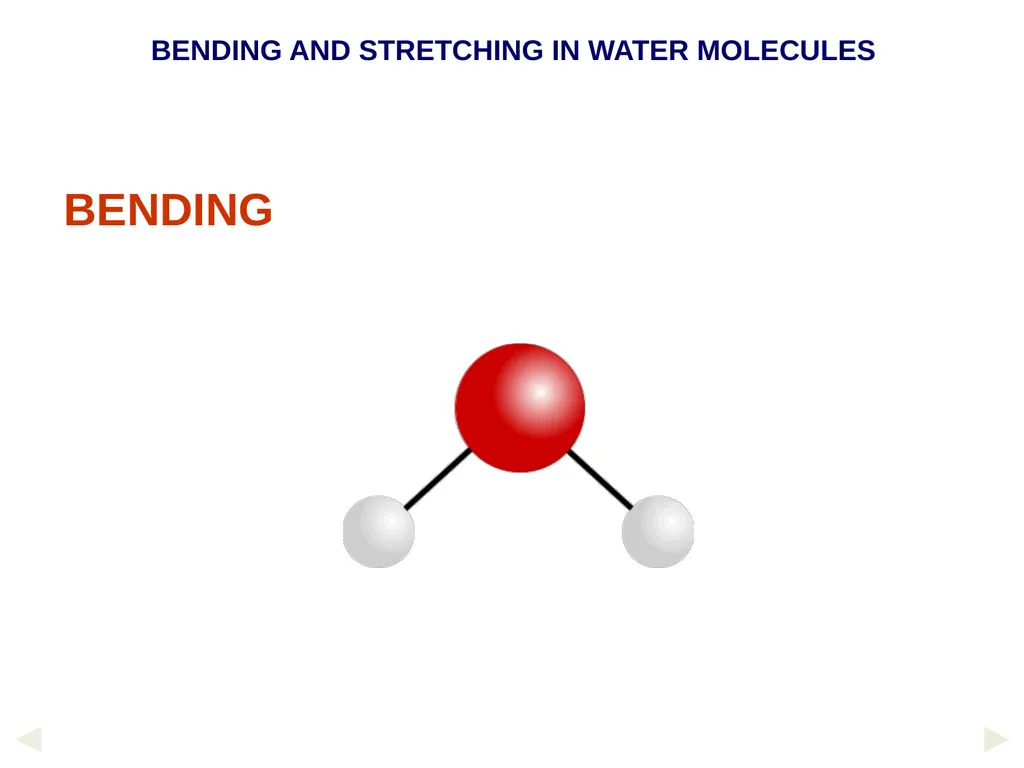
BENDING AND STRETCHING IN WATER MOLECULES BENDING<br>
27
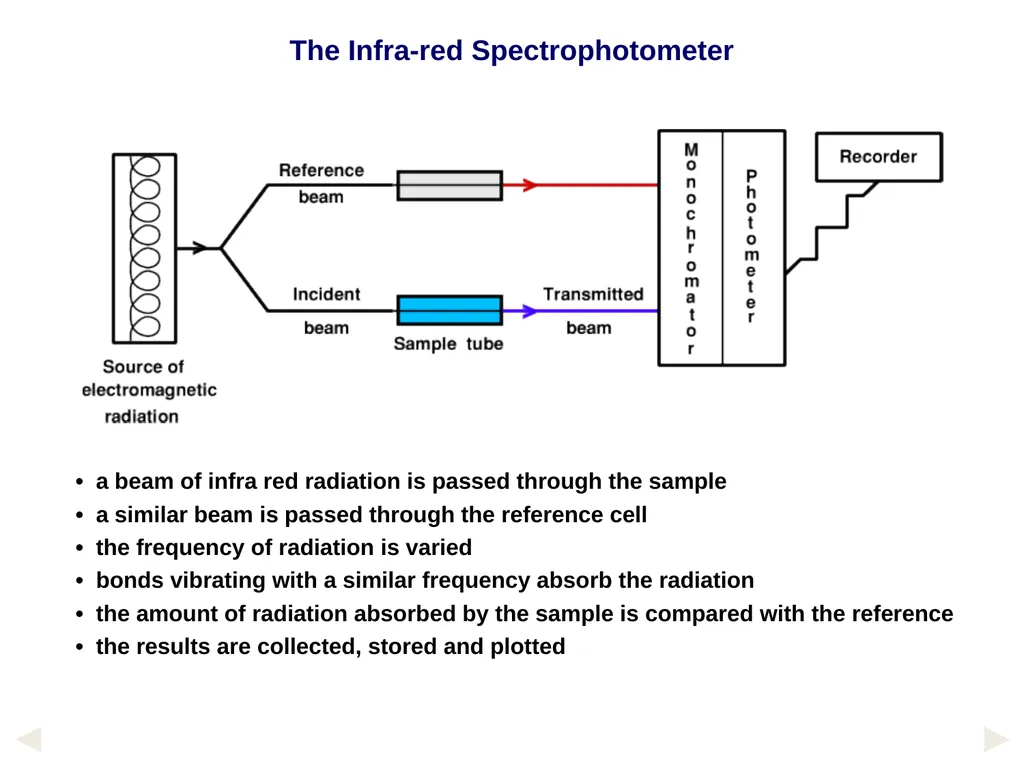
• a beam of infra red radiation is passed through the sample
• a similar beam is passed through the reference cell
• the frequency of radiation is varied
• bonds vibrating with a similar frequency absorb the radiation
• the amount of radiation absorbed by the sample is compared with the reference
• the results are collected, stored and plotted The Infra-red Spectrophotometer<br>
• a similar beam is passed through the reference cell
• the frequency of radiation is varied
• bonds vibrating with a similar frequency absorb the radiation
• the amount of radiation absorbed by the sample is compared with the reference
• the results are collected, stored and plotted The Infra-red Spectrophotometer<br>
28
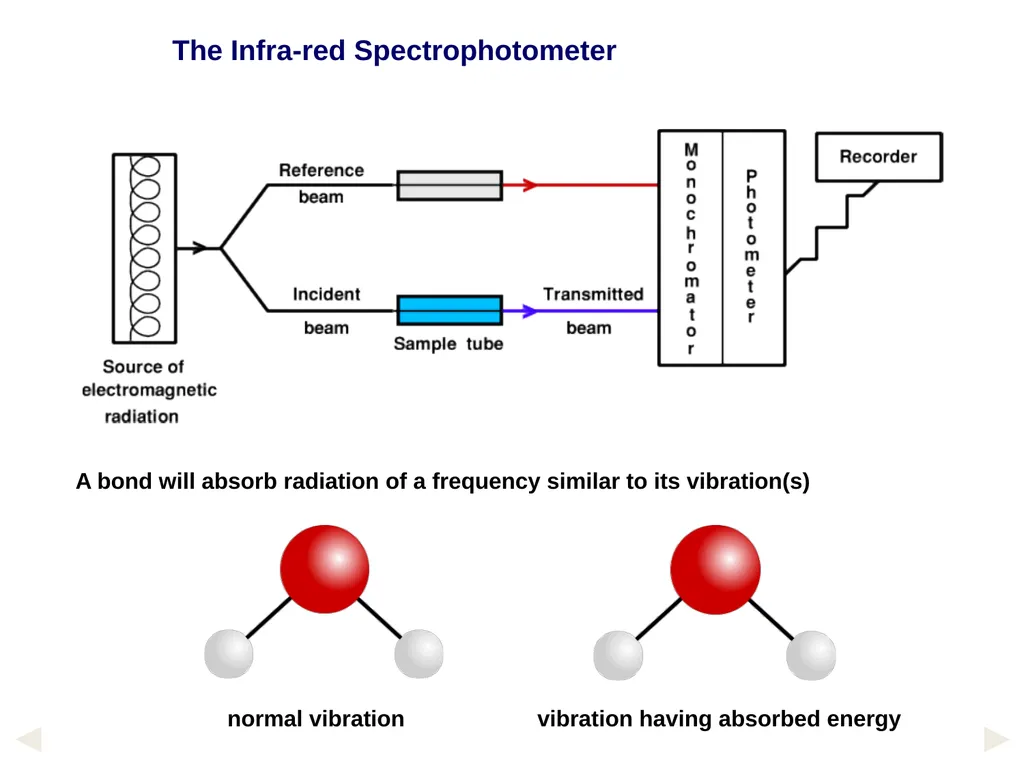
A bond will absorb radiation of a frequency similar to its vibration(s) The Infra-red Spectrophotometer normal vibration vibration having absorbed energy<br>
29
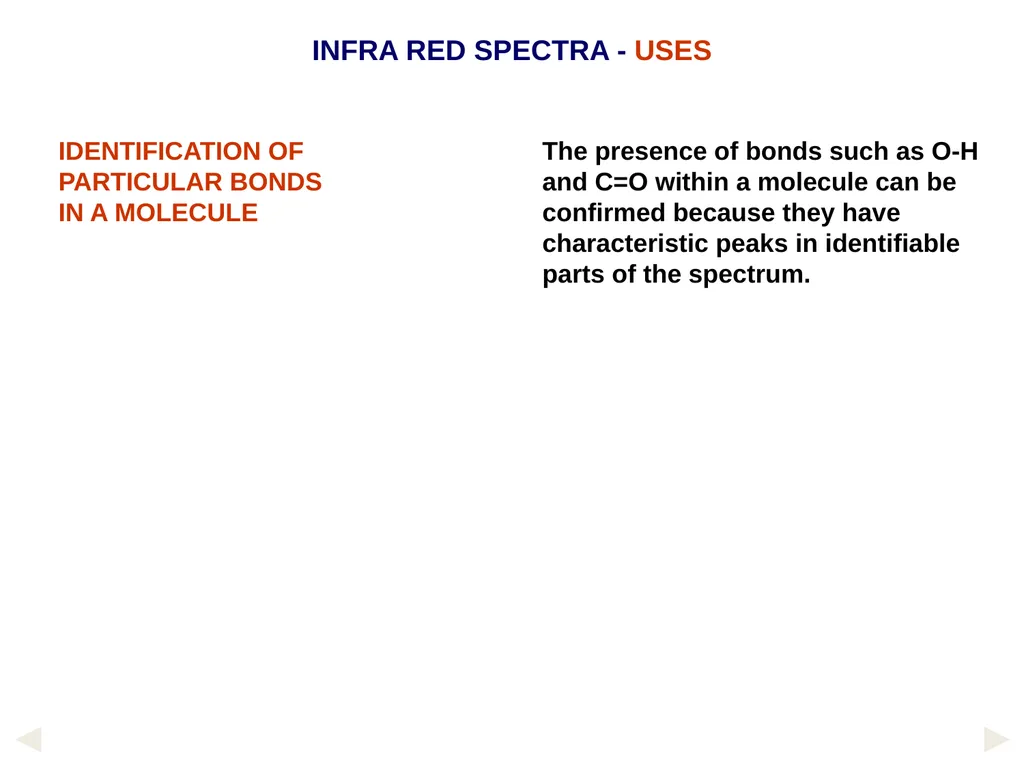
IDENTIFICATION OF PARTICULAR BONDS
IN A MOLECULE INFRA RED SPECTRA - USES The presence of bonds such as O-H and C=O within a molecule can be confirmed because they have characteristic peaks in identifiable parts of the spectrum.<br>
IN A MOLECULE INFRA RED SPECTRA - USES The presence of bonds such as O-H and C=O within a molecule can be confirmed because they have characteristic peaks in identifiable parts of the spectrum.<br>
30
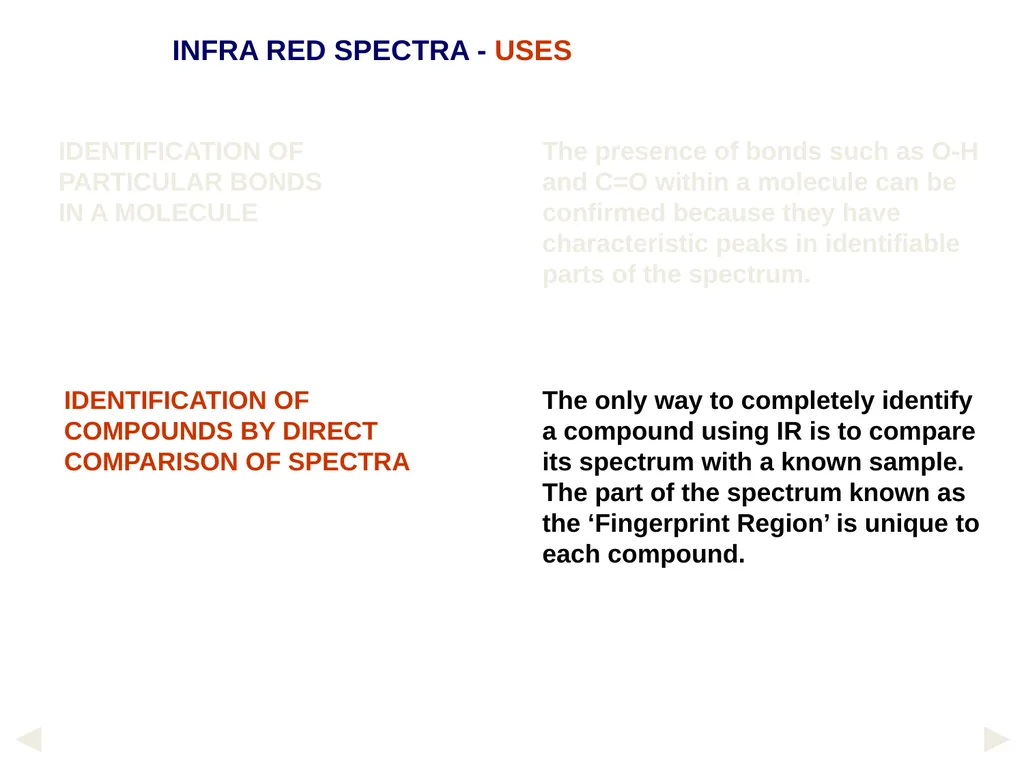
IDENTIFICATION OF PARTICULAR BONDS
IN A MOLECULE INFRA RED SPECTRA - USES The presence of bonds such as O-H and C=O within a molecule can be confirmed because they have characteristic peaks in identifiable parts of the spectrum. IDENTIFICATION OF COMPOUNDS BY DIRECT COMPARISON OF SPECTRA The only way to completely identify a compound using IR is to compare its spectrum with a known sample. The part of the spectrum known as the ‘Fingerprint Region’ is unique to each compound.<br>
IN A MOLECULE INFRA RED SPECTRA - USES The presence of bonds such as O-H and C=O within a molecule can be confirmed because they have characteristic peaks in identifiable parts of the spectrum. IDENTIFICATION OF COMPOUNDS BY DIRECT COMPARISON OF SPECTRA The only way to completely identify a compound using IR is to compare its spectrum with a known sample. The part of the spectrum known as the ‘Fingerprint Region’ is unique to each compound.<br>
31
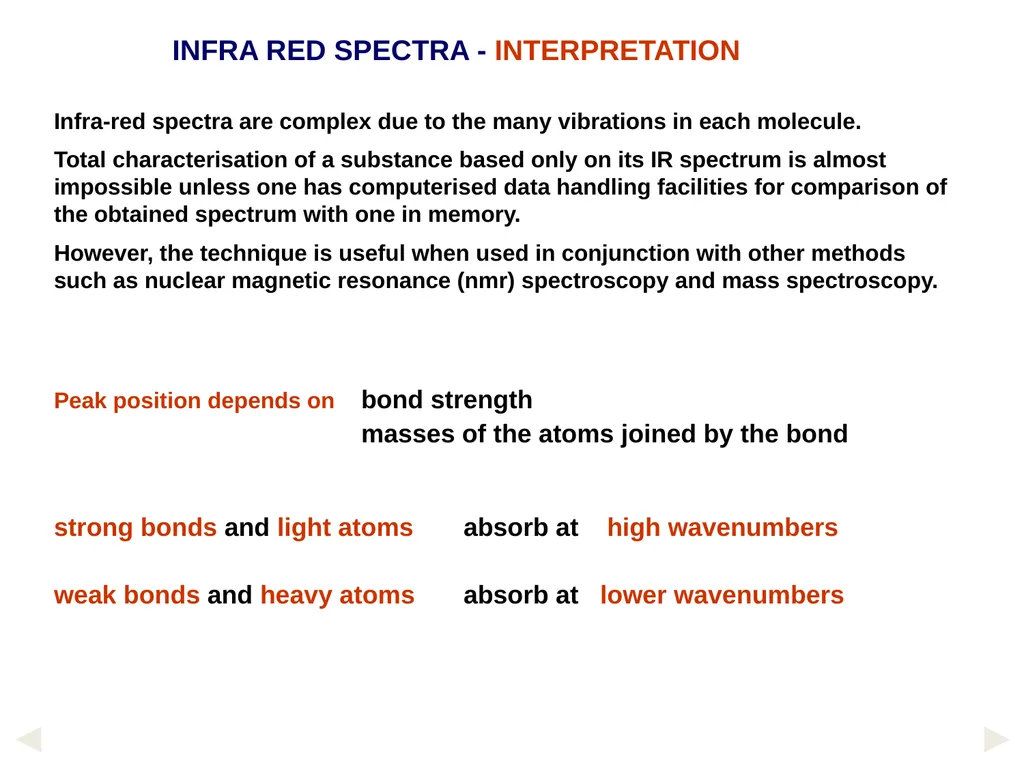
Infra-red spectra are complex due to the many vibrations in each molecule.
Total characterisation of a substance based only on its IR spectrum is almost impossible unless one has computerised data handling facilities for comparison of the obtained spectrum with one in memory.
However, the technique is useful when used in conjunction with other methods such as nuclear magnetic resonance (nmr) spectroscopy and mass spectroscopy.
Peak position depends on bond strength
masses of the atoms joined by the bond
strong bonds and light atoms absorb at high wavenumbers
weak bonds and heavy atoms absorb at lower wavenumbers INFRA RED SPECTRA - INTERPRETATION<br>
Total characterisation of a substance based only on its IR spectrum is almost impossible unless one has computerised data handling facilities for comparison of the obtained spectrum with one in memory.
However, the technique is useful when used in conjunction with other methods such as nuclear magnetic resonance (nmr) spectroscopy and mass spectroscopy.
Peak position depends on bond strength
masses of the atoms joined by the bond
strong bonds and light atoms absorb at high wavenumbers
weak bonds and heavy atoms absorb at lower wavenumbers INFRA RED SPECTRA - INTERPRETATION<br>
32
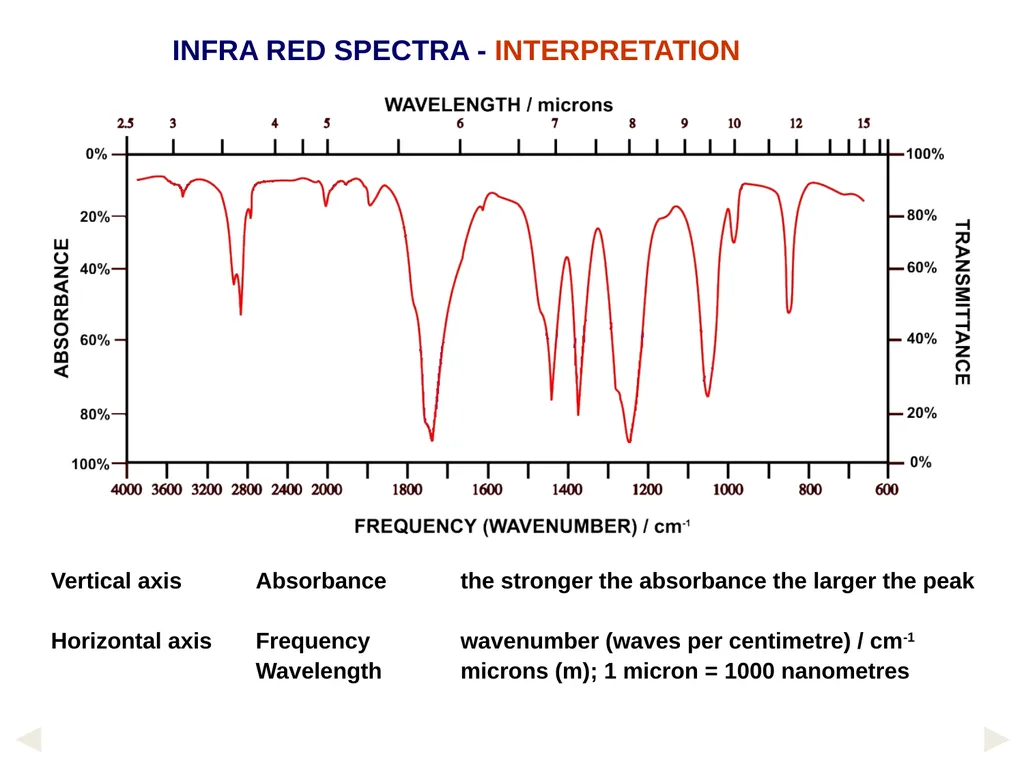
Vertical axis Absorbance the stronger the absorbance the larger the peak
Horizontal axis Frequency wavenumber (waves per centimetre) / cm-1
Wavelength microns (m); 1 micron = 1000 nanometres INFRA RED SPECTRA - INTERPRETATION<br>
Horizontal axis Frequency wavenumber (waves per centimetre) / cm-1
Wavelength microns (m); 1 micron = 1000 nanometres INFRA RED SPECTRA - INTERPRETATION<br>
33
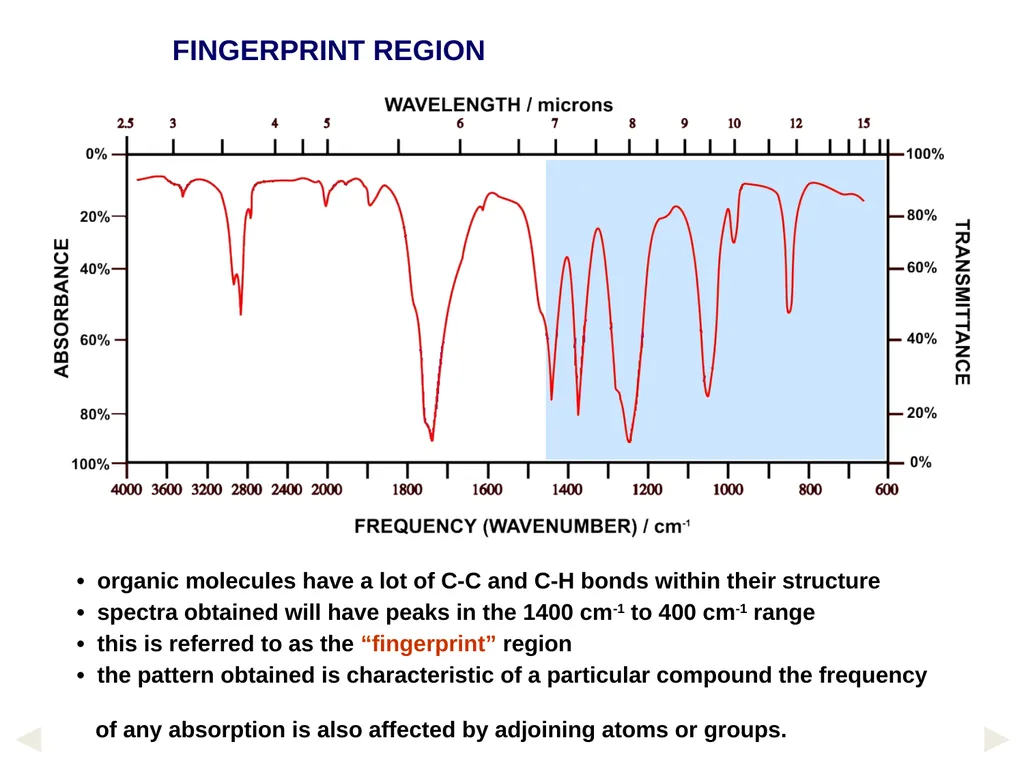
FINGERPRINT REGION • organic molecules have a lot of C-C and C-H bonds within their structure
• spectra obtained will have peaks in the 1400 cm-1 to 400 cm-1 range
• this is referred to as the “fingerprint” region
• the pattern obtained is characteristic of a particular compound the frequency
of any absorption is also affected by adjoining atoms or groups.<br>
• spectra obtained will have peaks in the 1400 cm-1 to 400 cm-1 range
• this is referred to as the “fingerprint” region
• the pattern obtained is characteristic of a particular compound the frequency
of any absorption is also affected by adjoining atoms or groups.<br>
34
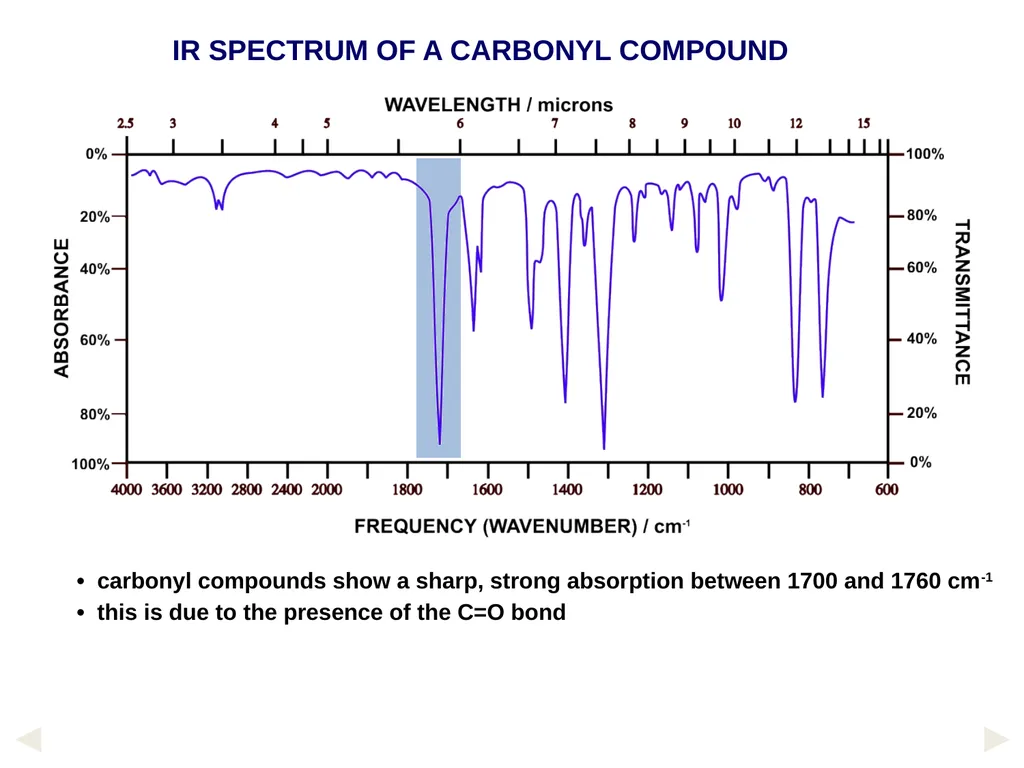
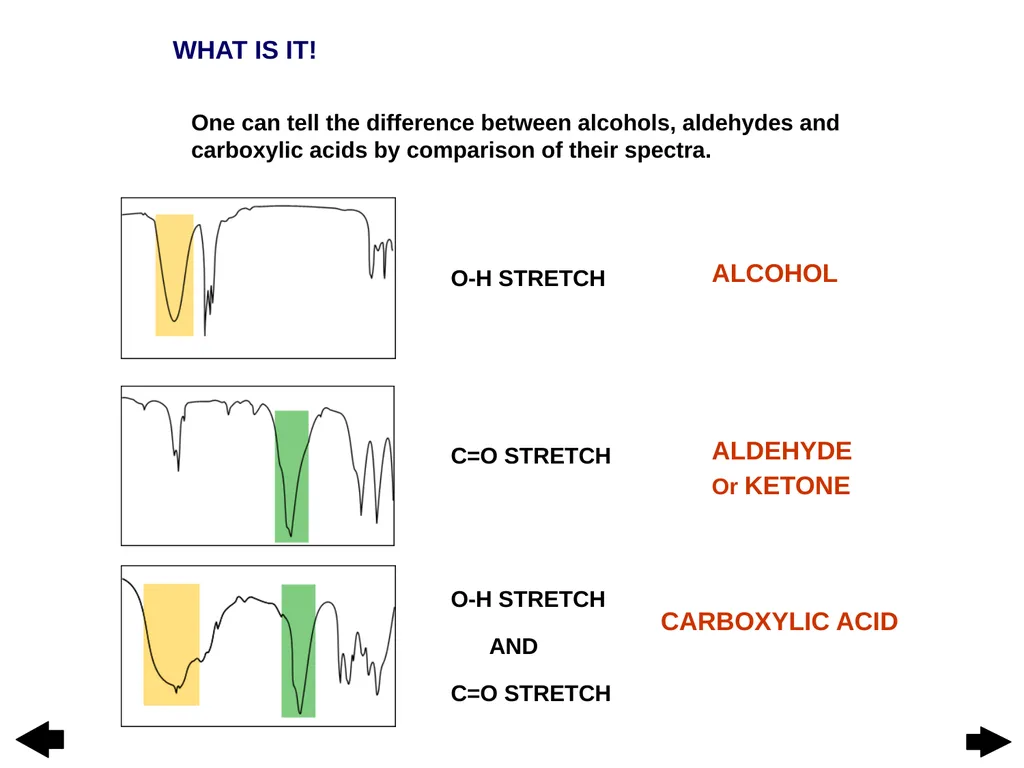
IR SPECTRUM OF A CARBONYL COMPOUND • carbonyl compounds show a sharp, strong absorption between 1700 and 1760 cm-1
• this is due to the presence of the C=O bond<br>
• this is due to the presence of the C=O bond<br>
35
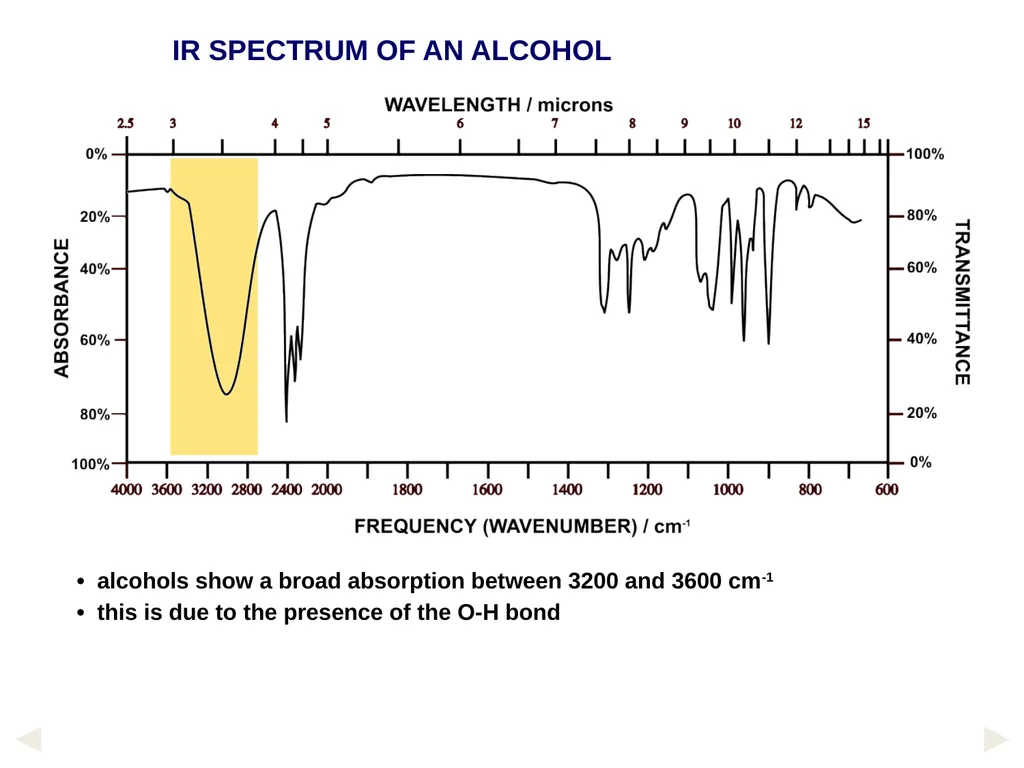
IR SPECTRUM OF AN ALCOHOL • alcohols show a broad absorption between 3200 and 3600 cm-1
• this is due to the presence of the O-H bond<br>
• this is due to the presence of the O-H bond<br>
36
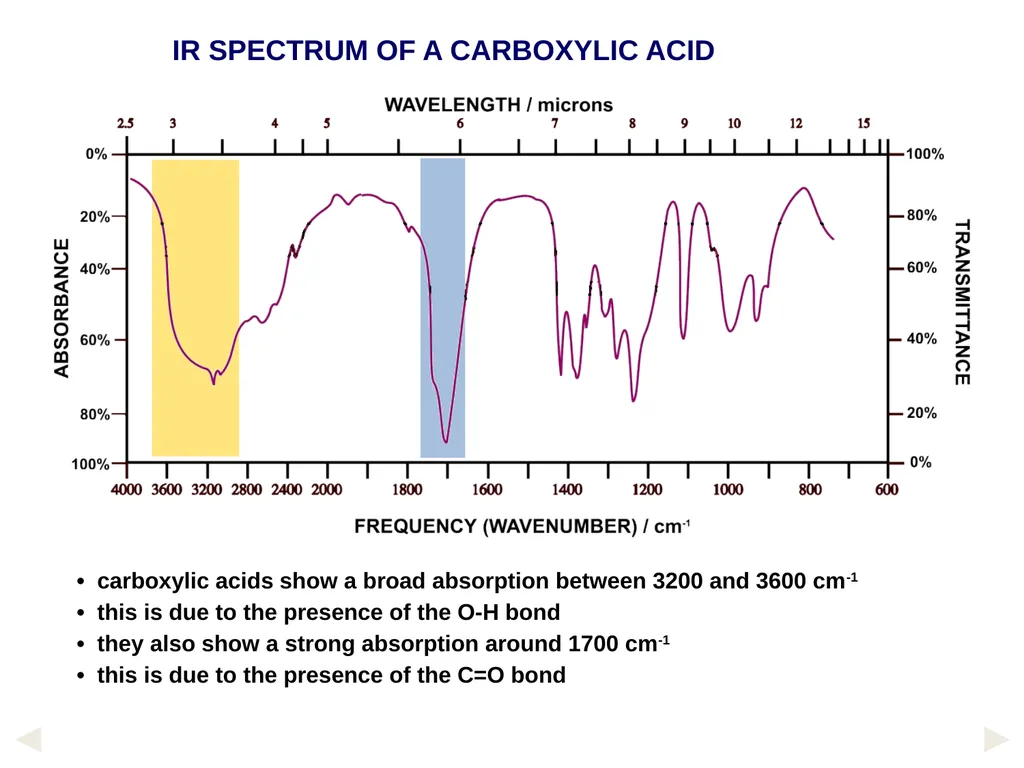
IR SPECTRUM OF A CARBOXYLIC ACID • carboxylic acids show a broad absorption between 3200 and 3600 cm-1
• this is due to the presence of the O-H bond
• they also show a strong absorption around 1700 cm-1
• this is due to the presence of the C=O bond<br>
• this is due to the presence of the O-H bond
• they also show a strong absorption around 1700 cm-1
• this is due to the presence of the C=O bond<br>
37
IR SPECTRUM OF AN ALDEHYDE or KETONE • esters show a strong absorption between 1750 cm-1 and 1730 cm-1
• this is due to the presence of the C=O bond<br>
• this is due to the presence of the C=O bond<br>
38
WHAT IS IT! O-H STRETCH C=O STRETCH ALCOHOL ALDEHYDE
Or KETONE CARBOXYLIC ACID One can tell the difference between alcohols, aldehydes and carboxylic acids by comparison of their spectra.<br>
Or KETONE CARBOXYLIC ACID One can tell the difference between alcohols, aldehydes and carboxylic acids by comparison of their spectra.<br>
39
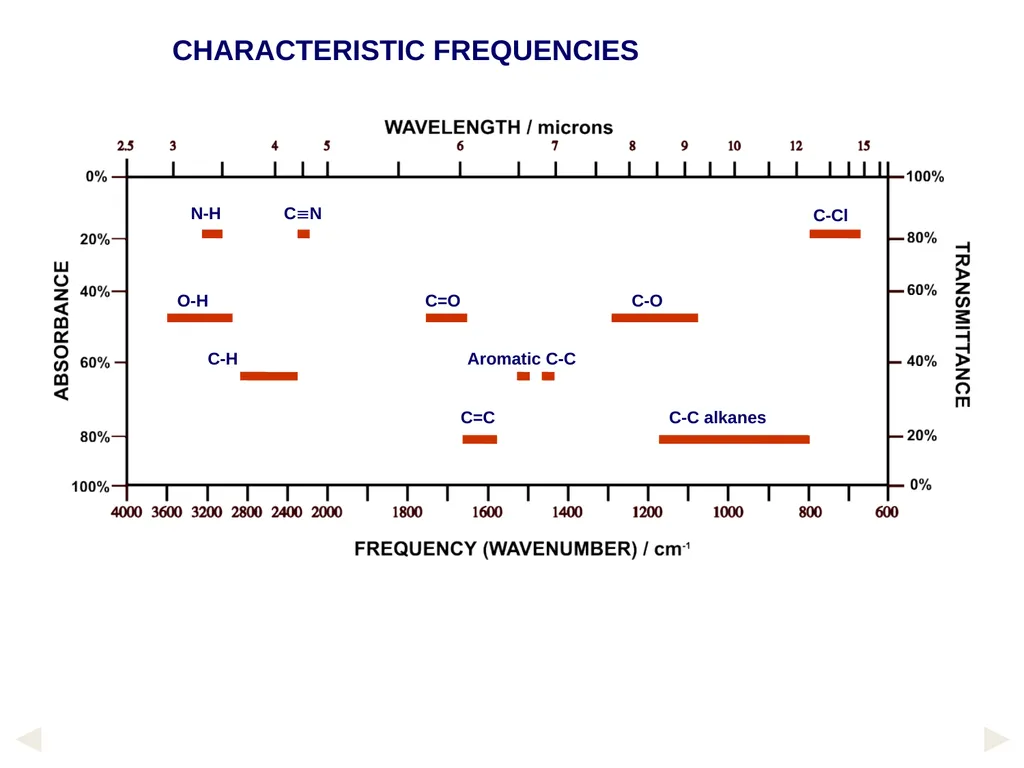
O-H C=O C-O N-H Aromatic C-C C-H C=C C-C alkanes CN C-Cl CHARACTERISTIC FREQUENCIES<br>
40
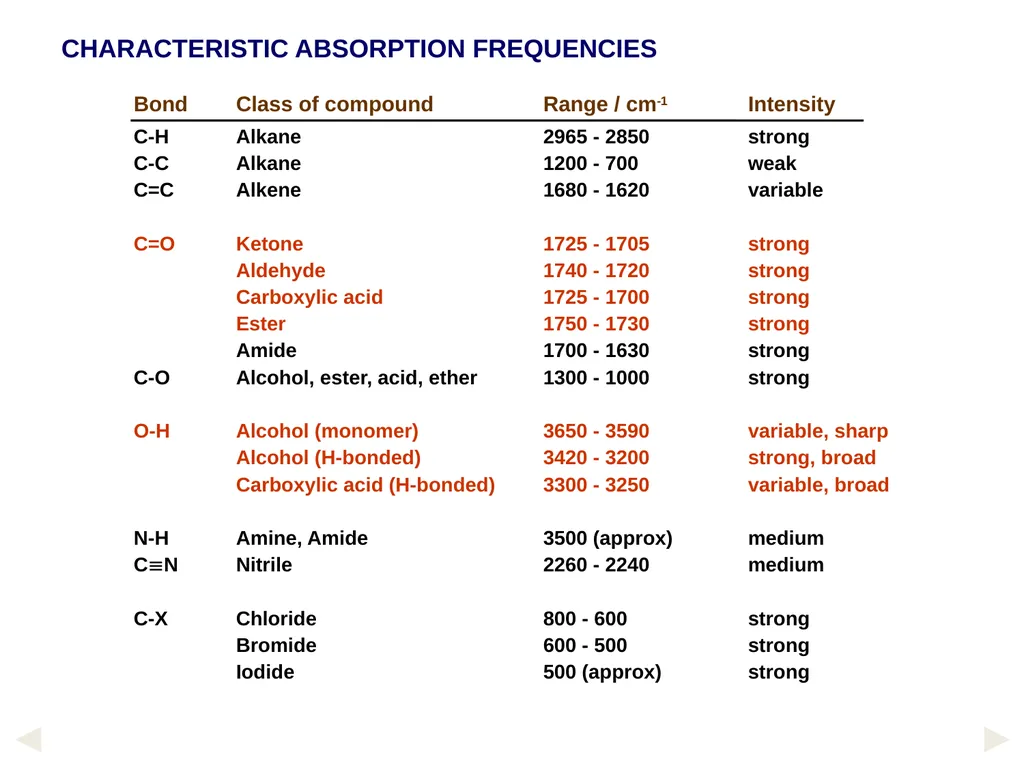
Bond Class of compound Range / cm-1 Intensity
C-H Alkane 2965 - 2850 strong
C-C Alkane 1200 - 700 weak
C=C Alkene 1680 - 1620 variable
C=O Ketone 1725 - 1705 strong
Aldehyde 1740 - 1720 strong
Carboxylic acid 1725 - 1700 strong
Ester 1750 - 1730 strong
Amide 1700 - 1630 strong
C-O Alcohol, ester, acid, ether 1300 - 1000 strong
O-H Alcohol (monomer) 3650 - 3590 variable, sharp
Alcohol (H-bonded) 3420 - 3200 strong, broad
Carboxylic acid (H-bonded) 3300 - 3250 variable, broad
N-H Amine, Amide 3500 (approx) medium
CN Nitrile 2260 - 2240 medium
C-X Chloride 800 - 600 strong
Bromide 600 - 500 strong
Iodide 500 (approx) strong CHARACTERISTIC ABSORPTION FREQUENCIES<br>
C-H Alkane 2965 - 2850 strong
C-C Alkane 1200 - 700 weak
C=C Alkene 1680 - 1620 variable
C=O Ketone 1725 - 1705 strong
Aldehyde 1740 - 1720 strong
Carboxylic acid 1725 - 1700 strong
Ester 1750 - 1730 strong
Amide 1700 - 1630 strong
C-O Alcohol, ester, acid, ether 1300 - 1000 strong
O-H Alcohol (monomer) 3650 - 3590 variable, sharp
Alcohol (H-bonded) 3420 - 3200 strong, broad
Carboxylic acid (H-bonded) 3300 - 3250 variable, broad
N-H Amine, Amide 3500 (approx) medium
CN Nitrile 2260 - 2240 medium
C-X Chloride 800 - 600 strong
Bromide 600 - 500 strong
Iodide 500 (approx) strong CHARACTERISTIC ABSORPTION FREQUENCIES<br>
41
When the frequency of the radiation matches the frequency of a particular vibration, energy is transferred to the molecule, increasing the amplitude of the vibration. One observes the transfer of energy because light equal in energy to the molecular vibration is absorbed from the beam of incident infrared light.
The important point is that the energy involved in a vibration is inversely related to the masses of the atoms involved, that is, the heavier the atoms involved, the lower the energy, What are the relating between ʋ, ύ and with mass of atom? (H.W.) Determination of IR Spectrum of a Solid Pharmaceutical Substance: (a). Mull Technique:
1. Take about 15-20 mg of sample in a previously cleaned small agate mortar and powder it thoroughly (about 200 mesh).
2. Add to it 2 drops of purified paraffin (Nujol–a hydrocarbon liquid, or Flourolube 1370-4000 cm-1) or any liquid and continue the trituration until a very smooth paste of uniform consistency is achieved.
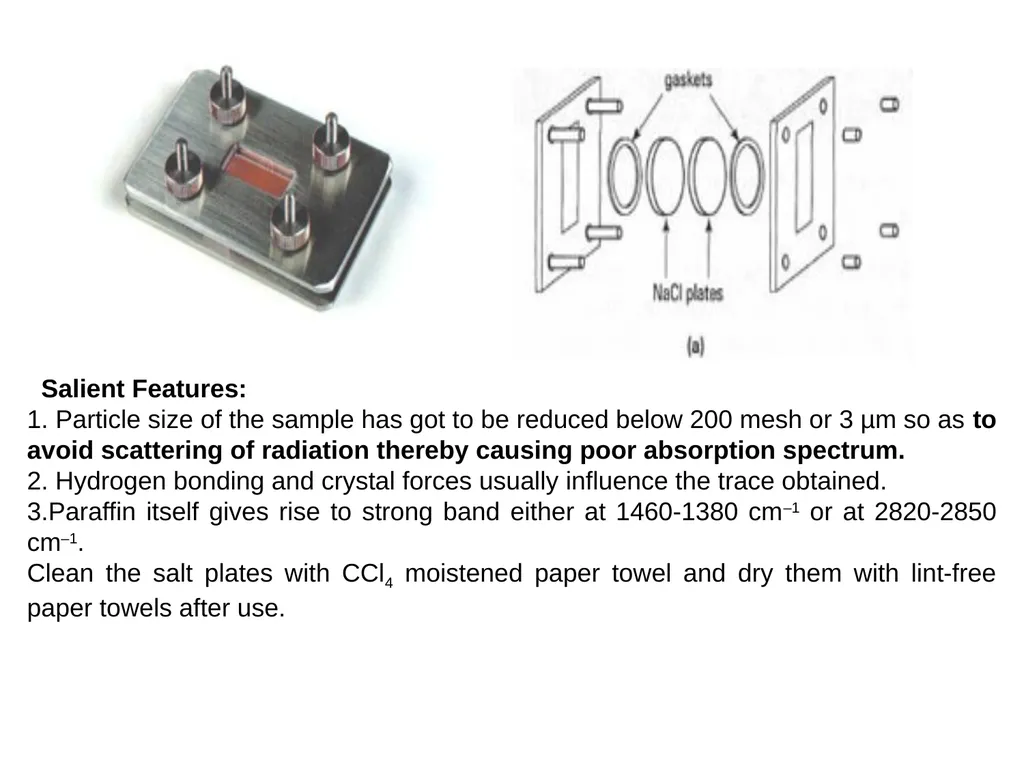
3. Transfer the slurry to a sodium chloride plate, placing it carefully into the cavity made by the spacer, consequently, place the other plate of NaCl on top and thus assemble the cell.<br>
The important point is that the energy involved in a vibration is inversely related to the masses of the atoms involved, that is, the heavier the atoms involved, the lower the energy, What are the relating between ʋ, ύ and with mass of atom? (H.W.) Determination of IR Spectrum of a Solid Pharmaceutical Substance: (a). Mull Technique:
1. Take about 15-20 mg of sample in a previously cleaned small agate mortar and powder it thoroughly (about 200 mesh).
2. Add to it 2 drops of purified paraffin (Nujol–a hydrocarbon liquid, or Flourolube 1370-4000 cm-1) or any liquid and continue the trituration until a very smooth paste of uniform consistency is achieved.
3. Transfer the slurry to a sodium chloride plate, placing it carefully into the cavity made by the spacer, consequently, place the other plate of NaCl on top and thus assemble the cell.<br>
42
Salient Features:
1. Particle size of the sample has got to be reduced below 200 mesh or 3 µm so as to avoid scattering of radiation thereby causing poor absorption spectrum.
2. Hydrogen bonding and crystal forces usually influence the trace obtained.
3.Paraffin itself gives rise to strong band either at 1460-1380 cm–1 or at 2820-2850 cm–1.
Clean the salt plates with CCl4 moistened paper towel and dry them with lint-free paper towels after use.<br>
1. Particle size of the sample has got to be reduced below 200 mesh or 3 µm so as to avoid scattering of radiation thereby causing poor absorption spectrum.
2. Hydrogen bonding and crystal forces usually influence the trace obtained.
3.Paraffin itself gives rise to strong band either at 1460-1380 cm–1 or at 2820-2850 cm–1.
Clean the salt plates with CCl4 moistened paper towel and dry them with lint-free paper towels after use.<br>
43
(b).Potassium Bromide Disc Technique:-
For a disc of diameter (1-1.3 cm), take 100 mg of spectroscopic grade KBr in a previously cleaned agate pestle and mortar and grind it thoroughly with (0.05-0.5mg) of the sample, now carefully place the sample mixture into the pressing chamber of the mould in such a manner that it is held between the polished surfaces of the bottom and top pressing dies, finally, enhance the pressing force to 100,000 lb/in2 or 10-12 tons/in2 for a period of 1 minutes, carefully, release the pressure and dismantle the dies, now, remove the disc from the mould and keep it in position onto the sample holder.
Salient Features:
1. There exists a possibility of interaction between vibrations of the sample and the potassium bromide lattice.
2. It is considered to be the most suitable method for other screening of very minute quantities of substances being eluted from the columns in Gas Liquid Chromatography (GLC), in actual practice, about 300 mg of the spectroscopic grade KBr is placed in a short column immediately after the detector.
Consequently, the solid is powdered, pressed into a disc in the normal procedure and ultimately the absorption spectrum of the trapped substance is studied.
3. It enjoys the advantage of producing spectra absolutely free from any solvent peaks (unlike Mull Technique) and hence it is employed extensively in routine analysis.<br>
For a disc of diameter (1-1.3 cm), take 100 mg of spectroscopic grade KBr in a previously cleaned agate pestle and mortar and grind it thoroughly with (0.05-0.5mg) of the sample, now carefully place the sample mixture into the pressing chamber of the mould in such a manner that it is held between the polished surfaces of the bottom and top pressing dies, finally, enhance the pressing force to 100,000 lb/in2 or 10-12 tons/in2 for a period of 1 minutes, carefully, release the pressure and dismantle the dies, now, remove the disc from the mould and keep it in position onto the sample holder.
Salient Features:
1. There exists a possibility of interaction between vibrations of the sample and the potassium bromide lattice.
2. It is considered to be the most suitable method for other screening of very minute quantities of substances being eluted from the columns in Gas Liquid Chromatography (GLC), in actual practice, about 300 mg of the spectroscopic grade KBr is placed in a short column immediately after the detector.
Consequently, the solid is powdered, pressed into a disc in the normal procedure and ultimately the absorption spectrum of the trapped substance is studied.
3. It enjoys the advantage of producing spectra absolutely free from any solvent peaks (unlike Mull Technique) and hence it is employed extensively in routine analysis.<br>
44
Internal Standard for KBr-Disc Technique:
In quantitative analysis it is essential to examine absolutely uniform discs of identical weights, to achieve this, known weights of both KBr and analyte are required in the preparation of the KBr-disc and finally from the absorption data a calibration-curve may be obtained, in this process, it is a must to weigh the discs and also to measure their thickness at different points
Calibration of Infrared Spectroscopy:-
The wavelength (or wavenumber) scale calibration of infrared spectroscopy is usually carried out with the aid of a strip of polystyrene film fixed on a frame; it consists of several sharp absorption bands, the wavelengths of which are known accurately and precisely.
Basically, all IR-spectroscopes need to be calibrated periodically as per the specific instructions so as to ascertain their accuracy and precision. http://www.chem.ucla.edu/~webspectra/#Problems<br>
In quantitative analysis it is essential to examine absolutely uniform discs of identical weights, to achieve this, known weights of both KBr and analyte are required in the preparation of the KBr-disc and finally from the absorption data a calibration-curve may be obtained, in this process, it is a must to weigh the discs and also to measure their thickness at different points
Calibration of Infrared Spectroscopy:-
The wavelength (or wavenumber) scale calibration of infrared spectroscopy is usually carried out with the aid of a strip of polystyrene film fixed on a frame; it consists of several sharp absorption bands, the wavelengths of which are known accurately and precisely.
Basically, all IR-spectroscopes need to be calibrated periodically as per the specific instructions so as to ascertain their accuracy and precision. http://www.chem.ucla.edu/~webspectra/#Problems<br>
45
Titration of the ascorbic acid (vitamin C) in tablets
By pH meter used first and 2nd derivatives
Outcomes:-
After completing this experiment, the student should be able to:
1. Calibration of pH meter.
2. Calculation of first and 2nd derivatives.
3. Calculate the Ka of weak acid.
Introduction:
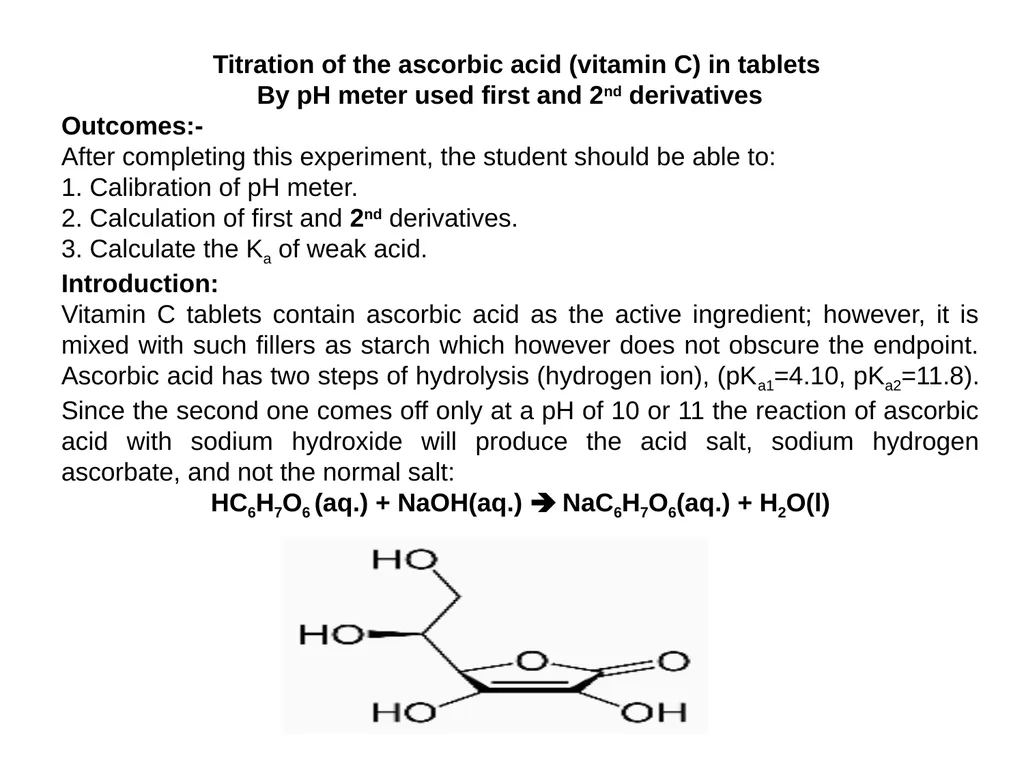
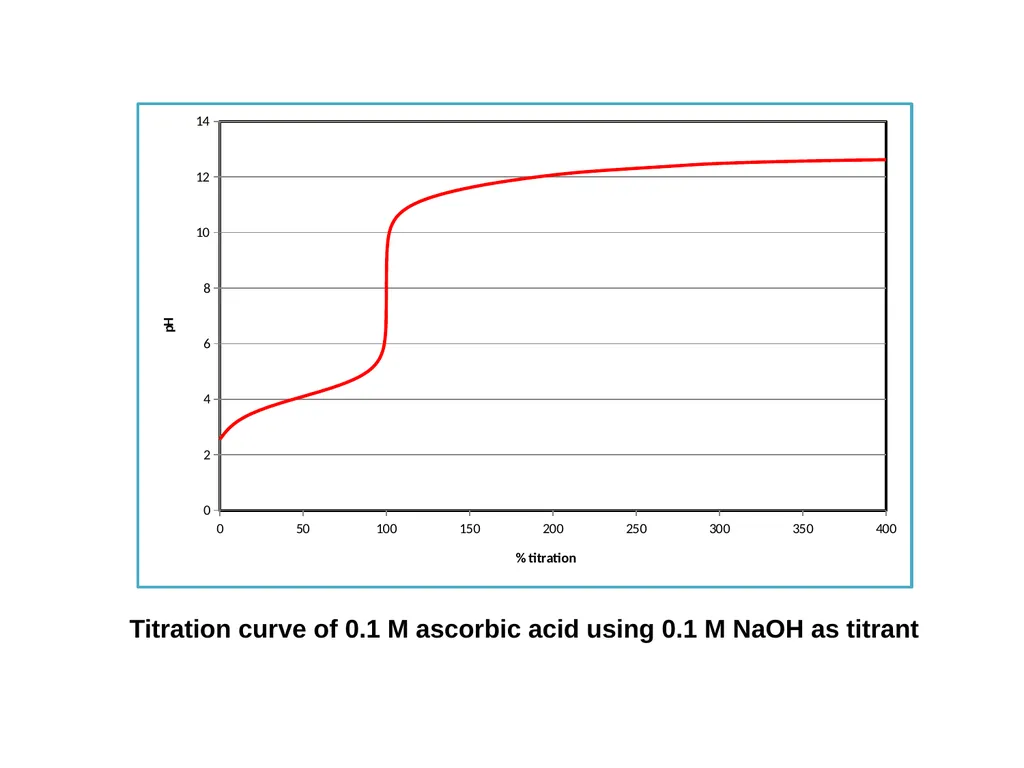
Vitamin C tablets contain ascorbic acid as the active ingredient; however, it is mixed with such fillers as starch which however does not obscure the endpoint. Ascorbic acid has two steps of hydrolysis (hydrogen ion), (pKa1=4.10, pKa2=11.8). Since the second one comes off only at a pH of 10 or 11 the reaction of ascorbic acid with sodium hydroxide will produce the acid salt, sodium hydrogen ascorbate, and not the normal salt:
HC6H7O6 (aq.) + NaOH(aq.) NaC6H7O6(aq.) + H2O(l)<br>
By pH meter used first and 2nd derivatives
Outcomes:-
After completing this experiment, the student should be able to:
1. Calibration of pH meter.
2. Calculation of first and 2nd derivatives.
3. Calculate the Ka of weak acid.
Introduction:
Vitamin C tablets contain ascorbic acid as the active ingredient; however, it is mixed with such fillers as starch which however does not obscure the endpoint. Ascorbic acid has two steps of hydrolysis (hydrogen ion), (pKa1=4.10, pKa2=11.8). Since the second one comes off only at a pH of 10 or 11 the reaction of ascorbic acid with sodium hydroxide will produce the acid salt, sodium hydrogen ascorbate, and not the normal salt:
HC6H7O6 (aq.) + NaOH(aq.) NaC6H7O6(aq.) + H2O(l)<br>
46
Titration curve of 0.1 M ascorbic acid using 0.1 M NaOH as titrant<br>
47
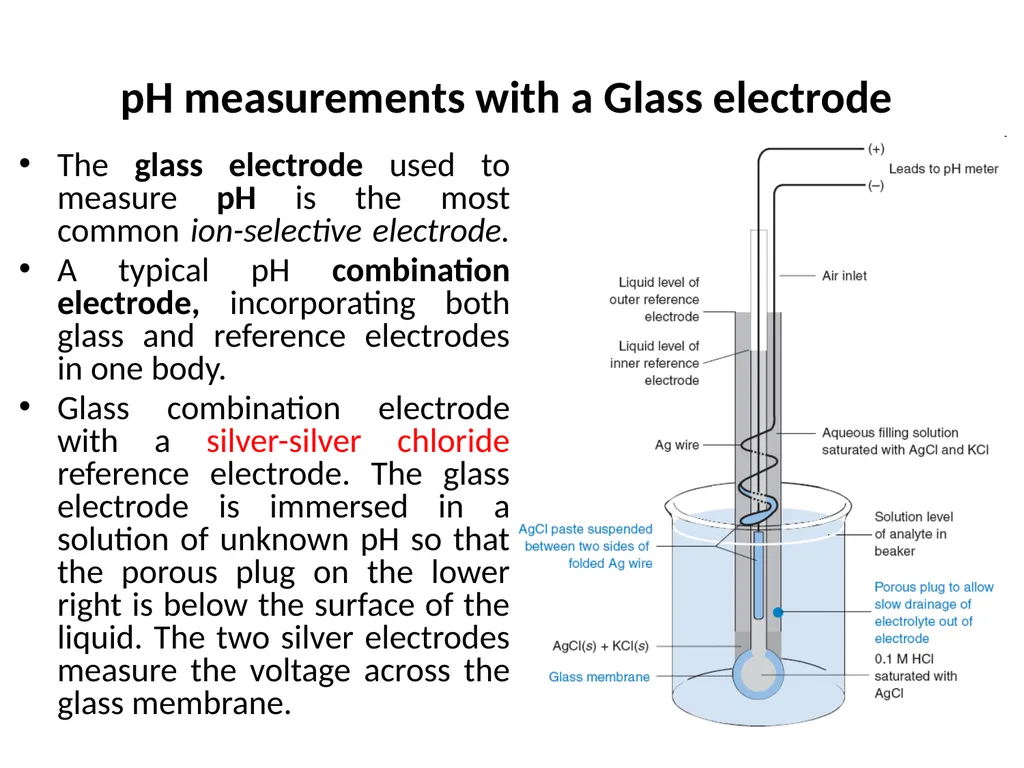
pH measurements with a Glass electrode The glass electrode used to measure pH is the most common ion-selective electrode.
A typical pH combination electrode, incorporating both glass and reference electrodes in one body.
Glass combination electrode with a silver-silver chloride reference electrode. The glass electrode is immersed in a solution of unknown pH so that the porous plug on the lower right is below the surface of the liquid. The two silver electrodes measure the voltage across the glass membrane.<br>
A typical pH combination electrode, incorporating both glass and reference electrodes in one body.
Glass combination electrode with a silver-silver chloride reference electrode. The glass electrode is immersed in a solution of unknown pH so that the porous plug on the lower right is below the surface of the liquid. The two silver electrodes measure the voltage across the glass membrane.<br>
48
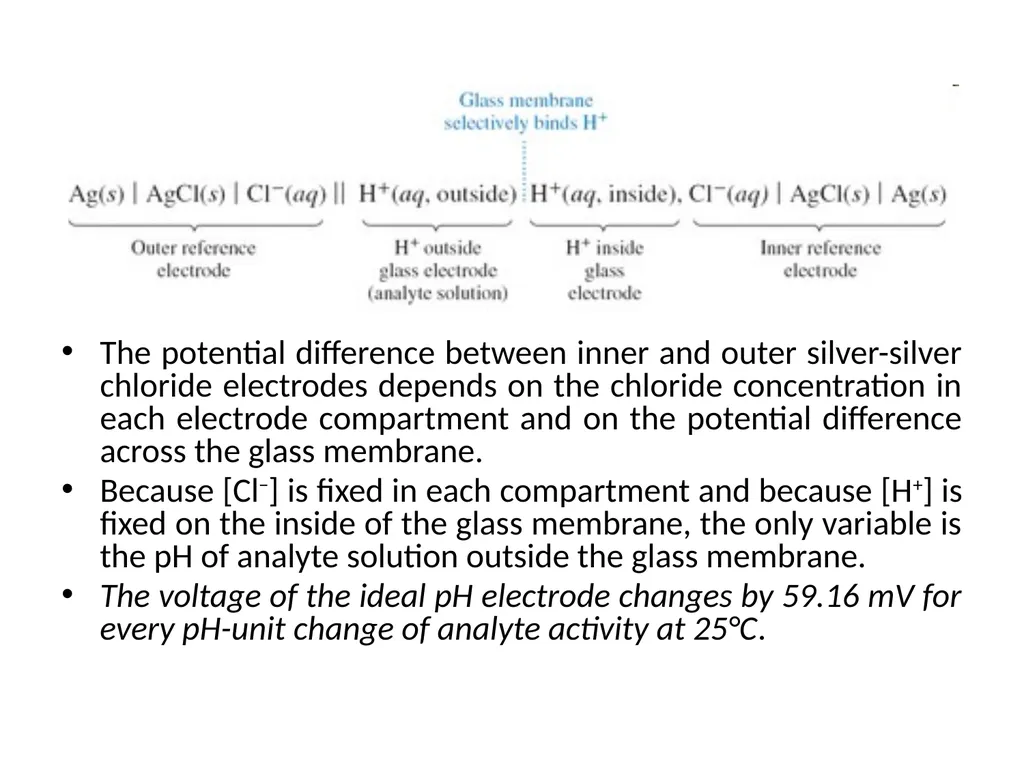
The potential difference between inner and outer silver-silver chloride electrodes depends on the chloride concentration in each electrode compartment and on the potential difference across the glass membrane.
Because [Cl−] is fixed in each compartment and because [H+] is fixed on the inside of the glass membrane, the only variable is the pH of analyte solution outside the glass membrane.
The voltage of the ideal pH electrode changes by 59.16 mV for every pH-unit change of analyte activity at 25°C.<br>
Because [Cl−] is fixed in each compartment and because [H+] is fixed on the inside of the glass membrane, the only variable is the pH of analyte solution outside the glass membrane.
The voltage of the ideal pH electrode changes by 59.16 mV for every pH-unit change of analyte activity at 25°C.<br>
49
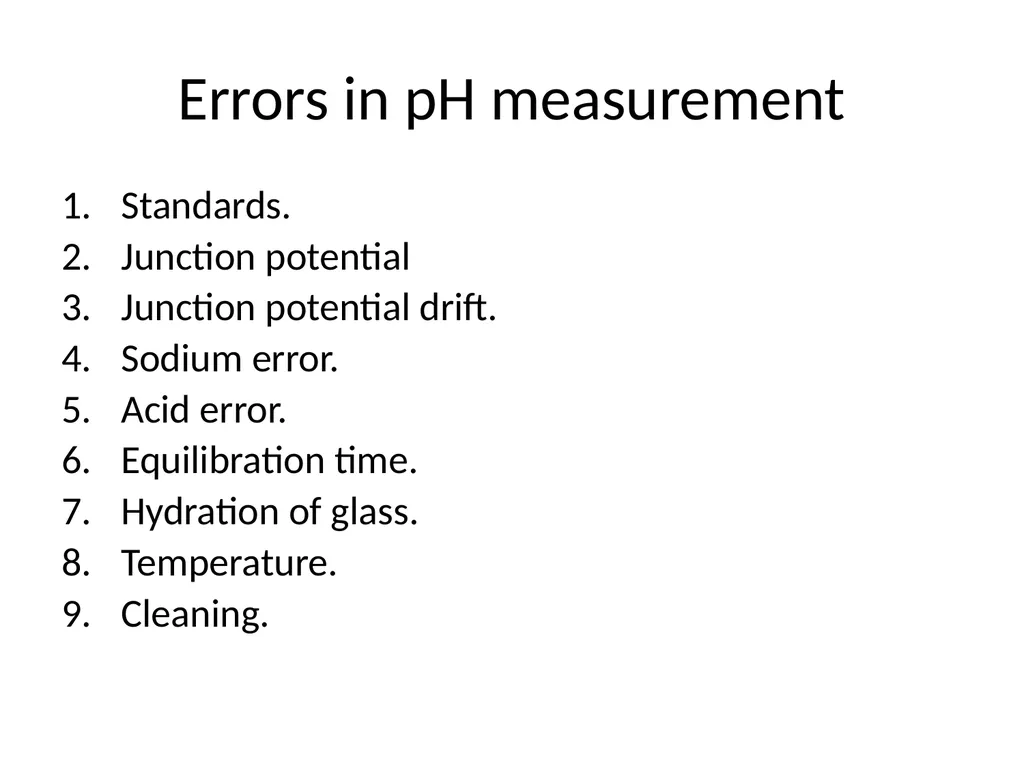
Errors in pH measurement Standards.
Junction potential
Junction potential drift.
Sodium error.
Acid error.
Equilibration time.
Hydration of glass.
Temperature.
Cleaning.<br>
Junction potential
Junction potential drift.
Sodium error.
Acid error.
Equilibration time.
Hydration of glass.
Temperature.
Cleaning.<br>
50
Procedure (pH-metric titration)
Place a tablet of Vitamin C in a beaker, add about 50 mL of warm distilled water, and crush the tablet with a glass stirring rod. Cool down the solution.
Dilute the sample in your volumetric flask to the total volume of 100-150 mL with distilled water.
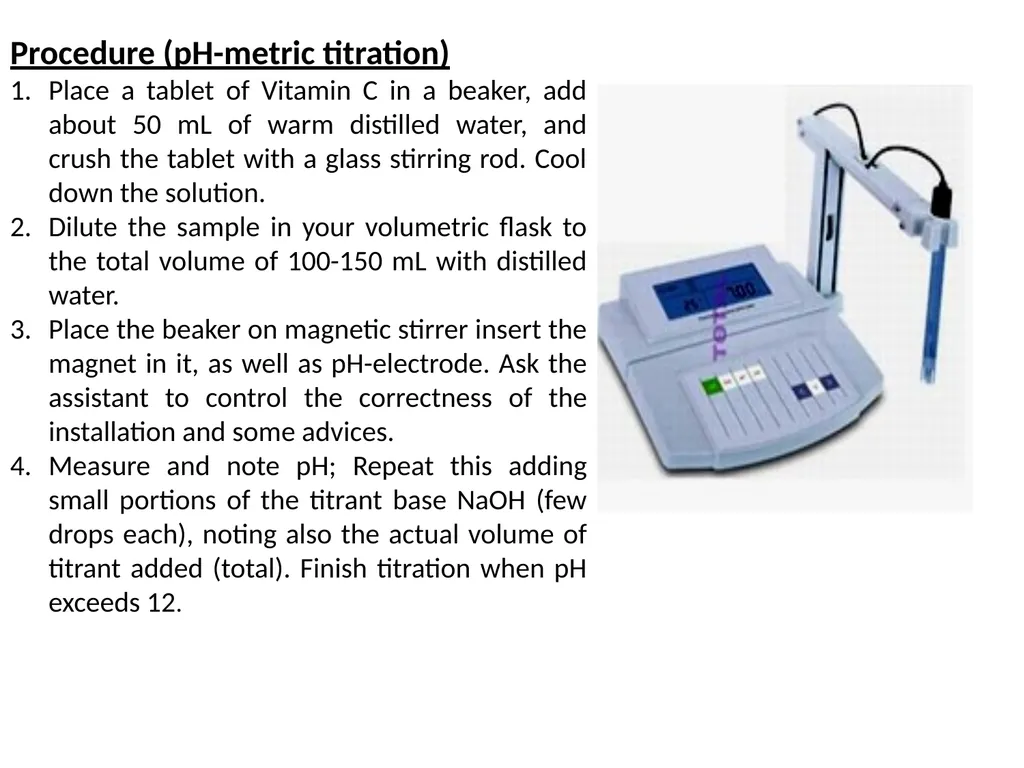
Place the beaker on magnetic stirrer insert the magnet in it, as well as pH-electrode. Ask the assistant to control the correctness of the installation and some advices.
Measure and note pH; Repeat this adding small portions of the titrant base NaOH (few drops each), noting also the actual volume of titrant added (total). Finish titration when pH exceeds 12.<br>
Place a tablet of Vitamin C in a beaker, add about 50 mL of warm distilled water, and crush the tablet with a glass stirring rod. Cool down the solution.
Dilute the sample in your volumetric flask to the total volume of 100-150 mL with distilled water.
Place the beaker on magnetic stirrer insert the magnet in it, as well as pH-electrode. Ask the assistant to control the correctness of the installation and some advices.
Measure and note pH; Repeat this adding small portions of the titrant base NaOH (few drops each), noting also the actual volume of titrant added (total). Finish titration when pH exceeds 12.<br>
51
Processing the results
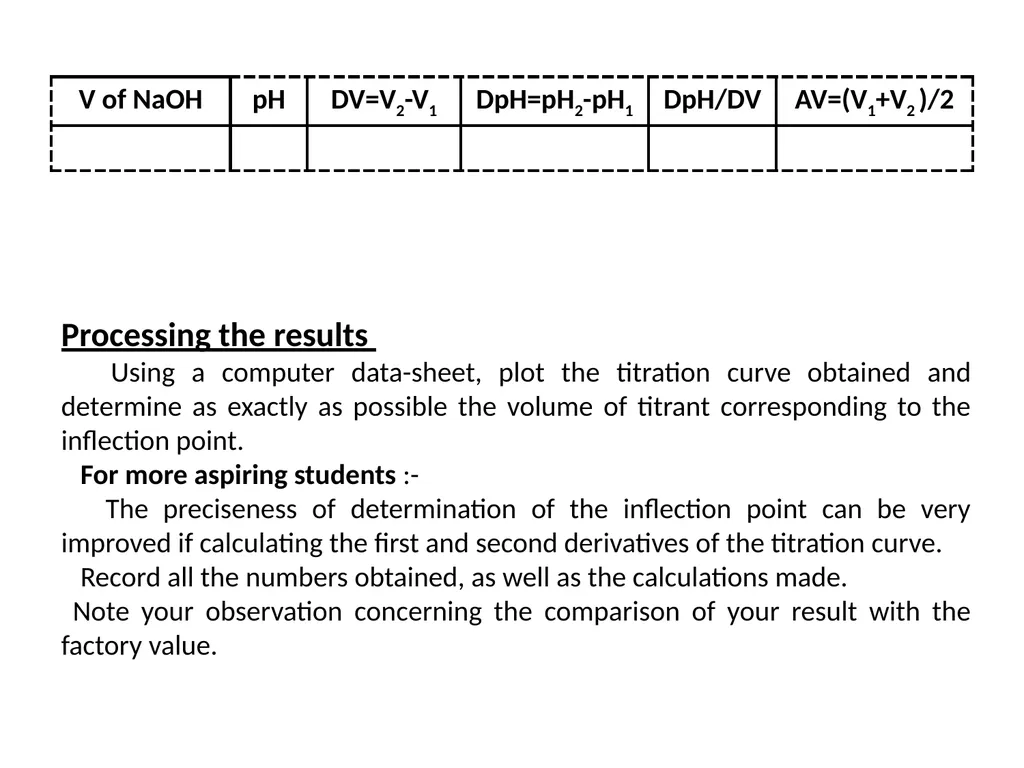
Using a computer data-sheet, plot the titration curve obtained and determine as exactly as possible the volume of titrant corresponding to the inflection point.
For more aspiring students :-
The preciseness of determination of the inflection point can be very improved if calculating the first and second derivatives of the titration curve.
Record all the numbers obtained, as well as the calculations made.
Note your observation concerning the comparison of your result with the factory value.<br>
Using a computer data-sheet, plot the titration curve obtained and determine as exactly as possible the volume of titrant corresponding to the inflection point.
For more aspiring students :-
The preciseness of determination of the inflection point can be very improved if calculating the first and second derivatives of the titration curve.
Record all the numbers obtained, as well as the calculations made.
Note your observation concerning the comparison of your result with the factory value.<br>
52
Multi-Component Analysis of a Vitamin B Mixture
by UV-Vis. Spectroscopy
Outcomes:-
After completing this experiment, the student should be able to:
Prepare standard solutions of mixture.
Prepare 1% of HCl from 36% HCl.
The conditions of accurate multi-component determination by UV-Vis. spectroscopy requires on Beer’s Law.
The calculations of determination of Mixtures by UV. Vis. Absorption Spectroscopy.
A UV-Vis. multi-component analysis mathematically separates each component of the sample; this requires the measurement of spectra for known standards of all the components which are present at any significant level in the sample.
The mathematical method attempts to minimize the sum of the squares of the residual spectrum; this is done by constructing a matrix of the cross-products of each pair of standard scans, and then solving this with respect to the cross-product of the standard scans with the sample scan, the final step is to calculate the actual sample component concentrations from the known concentrations in each standard<br>
by UV-Vis. Spectroscopy
Outcomes:-
After completing this experiment, the student should be able to:
Prepare standard solutions of mixture.
Prepare 1% of HCl from 36% HCl.
The conditions of accurate multi-component determination by UV-Vis. spectroscopy requires on Beer’s Law.
The calculations of determination of Mixtures by UV. Vis. Absorption Spectroscopy.
A UV-Vis. multi-component analysis mathematically separates each component of the sample; this requires the measurement of spectra for known standards of all the components which are present at any significant level in the sample.
The mathematical method attempts to minimize the sum of the squares of the residual spectrum; this is done by constructing a matrix of the cross-products of each pair of standard scans, and then solving this with respect to the cross-product of the standard scans with the sample scan, the final step is to calculate the actual sample component concentrations from the known concentrations in each standard<br>
53
Accurate multi-component determination by UV-Visible spectroscopy requires that the following conditions are met:
All components of the mixture can be identified, and absorb within the wavelength range of the instrument.
The absorbances of the components in the mixture follow Beer’s law.
There is some degree of spectral difference between the components, the greater the similarity between the spectra of the individual components the more difficult the analysis.
The spectrum of the mixture is the sum of components, i.e., the components must not interact to cause photometric or wavelength shifts.
There should be no interaction between components and the solvent.
Very large or very small absorbances should be avoided.
There should be no absorbances in the analytical wavelength region due to impurities.
If any of these assumptions do not hold, then the multi-component analysis is invalid<br>
All components of the mixture can be identified, and absorb within the wavelength range of the instrument.
The absorbances of the components in the mixture follow Beer’s law.
There is some degree of spectral difference between the components, the greater the similarity between the spectra of the individual components the more difficult the analysis.
The spectrum of the mixture is the sum of components, i.e., the components must not interact to cause photometric or wavelength shifts.
There should be no interaction between components and the solvent.
Very large or very small absorbances should be avoided.
There should be no absorbances in the analytical wavelength region due to impurities.
If any of these assumptions do not hold, then the multi-component analysis is invalid<br>
54
In this experiment, calculate concentrations in a Vitamin B group mixture consisting of
Vitamin B1 (Thiamine HCl),
Vitamin B2 (Riboflavin).
Vitamin B6 (Pyridoxine HCl).
Components may be determined from pure or mixed standards using whole scans, a selected scan range or selected wavelengths from the wavelength scans; derivatives (up to the 4th order) of the collected scan may also be used for component determination.
Experimental:-
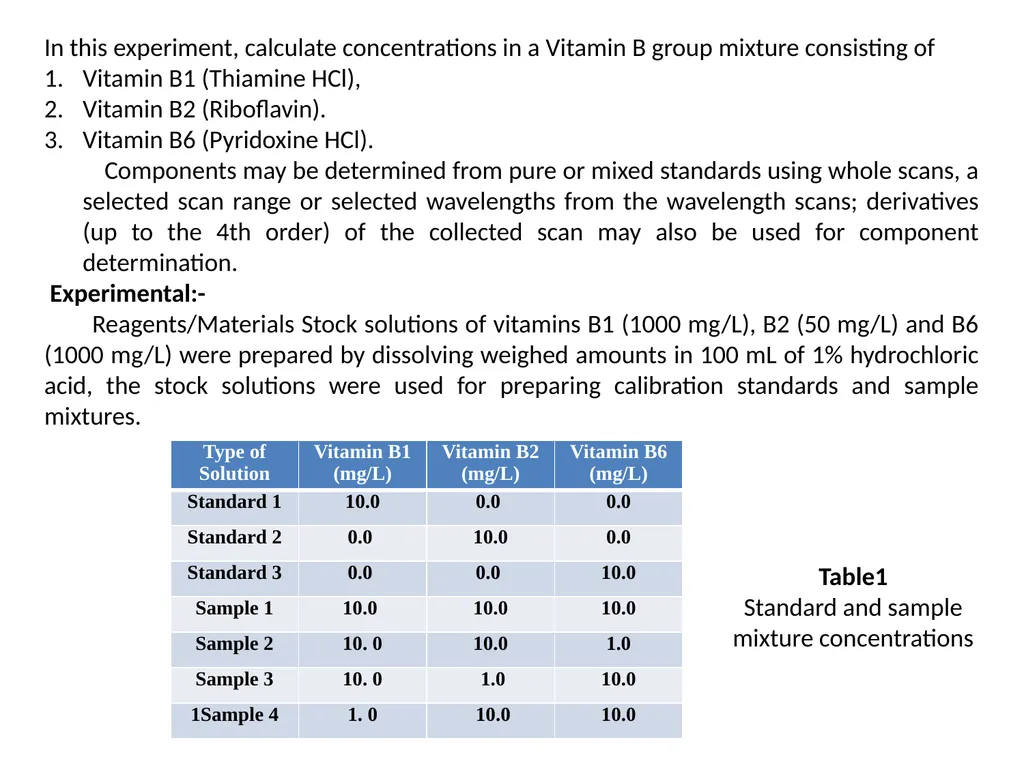
Reagents/Materials Stock solutions of vitamins B1 (1000 mg/L), B2 (50 mg/L) and B6 (1000 mg/L) were prepared by dissolving weighed amounts in 100 mL of 1% hydrochloric acid, the stock solutions were used for preparing calibration standards and sample mixtures. Table1
Standard and sample mixture concentrations<br>
Vitamin B1 (Thiamine HCl),
Vitamin B2 (Riboflavin).
Vitamin B6 (Pyridoxine HCl).
Components may be determined from pure or mixed standards using whole scans, a selected scan range or selected wavelengths from the wavelength scans; derivatives (up to the 4th order) of the collected scan may also be used for component determination.
Experimental:-
Reagents/Materials Stock solutions of vitamins B1 (1000 mg/L), B2 (50 mg/L) and B6 (1000 mg/L) were prepared by dissolving weighed amounts in 100 mL of 1% hydrochloric acid, the stock solutions were used for preparing calibration standards and sample mixtures. Table1
Standard and sample mixture concentrations<br>
55
The reference standards that you prepare will be measured on the UV-Vis. spectroscopy and will give you the following spectra:
At (λ)1 :- AB1(λ1) = εB1(λ1) b CB1S; AB6(λ1) = εB6(λ1) b CB6S; AB2(λ1) = εB2(λ1) b CB2S
At (λ)2 :- AB1(λ2) = εB1(λ2) b CB1S; AB6(λ2) = εB6(λ2) b CB6S; AB2(λ2) = εB2(λ2) b CB2S
At (λ)3 :- AB1(λ3) = εB1(λ3) b CB1S; AB6(λ3) = εB6(λ3) b CB6S; AB2(λ3) = εB2(λ3) b CB2S
The three equations are taken from absorbances at three different wavelengths: λ1=245nm, λ2=266nm, & λ3=290nm for multi-vitamins mixture solution:-
AM(245) = εB1(λ)1 b CB1+ εB2(λ)1 b CB2 + εB6(λ)1 b CB6
AM(266) = εB1(λ)2 b CB1+ εB2(λ)2 b CB2 + εB6(λ)2 b CB6
AM(290) = εB1(λ)3 b CB1+ εB2(λ)3 b CB2 + εB6(λ)3 b CB6
Since ‘b’ is the same in all cases and = 1 cm
A1 = εB1(λ)1 CB1+ εB2(λ)1 CB2 + εB6(λ)1 CB6
A2 = εB1(λ)2 CB1+ εB2(λ)2 CB2 + εB6(λ)2 CB6
A3 = εB1(λ)3 CB1+ εB2(λ)3 CB2 + εB6(λ)3 CB6<br>
At (λ)1 :- AB1(λ1) = εB1(λ1) b CB1S; AB6(λ1) = εB6(λ1) b CB6S; AB2(λ1) = εB2(λ1) b CB2S
At (λ)2 :- AB1(λ2) = εB1(λ2) b CB1S; AB6(λ2) = εB6(λ2) b CB6S; AB2(λ2) = εB2(λ2) b CB2S
At (λ)3 :- AB1(λ3) = εB1(λ3) b CB1S; AB6(λ3) = εB6(λ3) b CB6S; AB2(λ3) = εB2(λ3) b CB2S
The three equations are taken from absorbances at three different wavelengths: λ1=245nm, λ2=266nm, & λ3=290nm for multi-vitamins mixture solution:-
AM(245) = εB1(λ)1 b CB1+ εB2(λ)1 b CB2 + εB6(λ)1 b CB6
AM(266) = εB1(λ)2 b CB1+ εB2(λ)2 b CB2 + εB6(λ)2 b CB6
AM(290) = εB1(λ)3 b CB1+ εB2(λ)3 b CB2 + εB6(λ)3 b CB6
Since ‘b’ is the same in all cases and = 1 cm
A1 = εB1(λ)1 CB1+ εB2(λ)1 CB2 + εB6(λ)1 CB6
A2 = εB1(λ)2 CB1+ εB2(λ)2 CB2 + εB6(λ)2 CB6
A3 = εB1(λ)3 CB1+ εB2(λ)3 CB2 + εB6(λ)3 CB6<br>
56
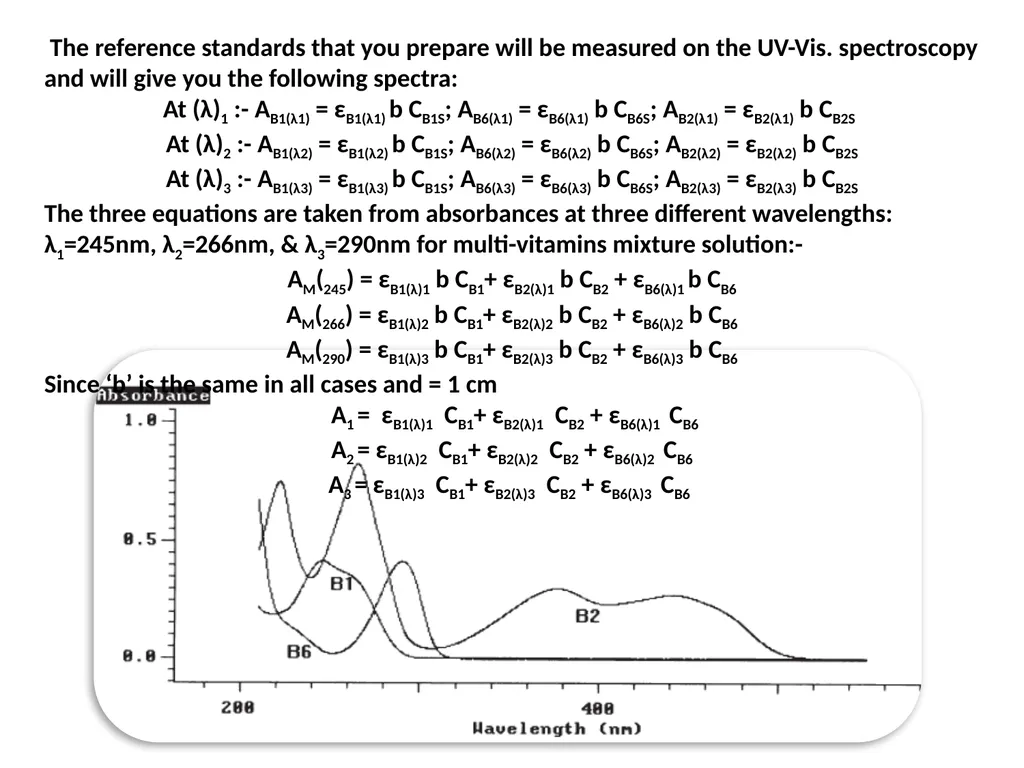
The spectra of the standards are shown in Figure1; all three components can be quantified, as there is a large degree of spectral difference between the components; Vitamin B2 is the only component that absorbs in the region 300 to 500 nm and has a strong absorption band at 266 nm; Vitamin B6 has a strong absorption band at 290 nm and Vitamin B1 has a strong absorption band at 245 nm:-
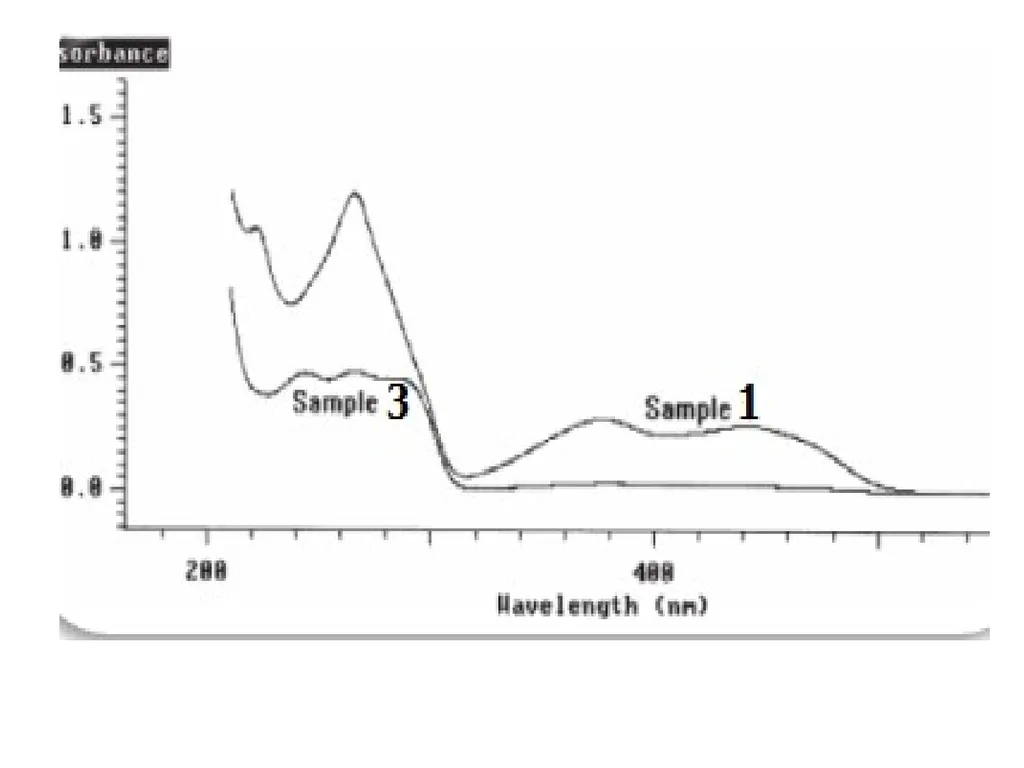
Figure 2 shows the wavelength scans for samples 1 and 3 as representative examples; the multi-component analysis of the Vitamin B system was optimized by limiting the calculation range to between 225 nm and 500 nm; in the region above 500 nm there is no absorbance from any component, and in the region below 225 nm the spectra of the components have little structure;
The results of the multi-component analysis using this reduced wavelength range are shown in Table3; the simplest way to validate the selected method of calculation is to re-measure the standards as samples and check the accuracy of results; as can be seen in Table3, the comparison of the calculated and expected results for the standards re-measured shows agreement to within 1.5%, thus validating the selected data collection and calculation parameters; the results in table3 for samples 1 to 4 show that the multi-component calculations are accurate for the chosen calculation parameters (compare with Table 1). For samples with relatively high concentrations of a component the calculated results are within 5% of the expected results. However, the % difference between the expected and calculated values increases slightly as the concentrations of individual components decreases. Generally, sample concentrations can be calculated to within 2–5%.<br>
Figure 2 shows the wavelength scans for samples 1 and 3 as representative examples; the multi-component analysis of the Vitamin B system was optimized by limiting the calculation range to between 225 nm and 500 nm; in the region above 500 nm there is no absorbance from any component, and in the region below 225 nm the spectra of the components have little structure;
The results of the multi-component analysis using this reduced wavelength range are shown in Table3; the simplest way to validate the selected method of calculation is to re-measure the standards as samples and check the accuracy of results; as can be seen in Table3, the comparison of the calculated and expected results for the standards re-measured shows agreement to within 1.5%, thus validating the selected data collection and calculation parameters; the results in table3 for samples 1 to 4 show that the multi-component calculations are accurate for the chosen calculation parameters (compare with Table 1). For samples with relatively high concentrations of a component the calculated results are within 5% of the expected results. However, the % difference between the expected and calculated values increases slightly as the concentrations of individual components decreases. Generally, sample concentrations can be calculated to within 2–5%.<br>
57
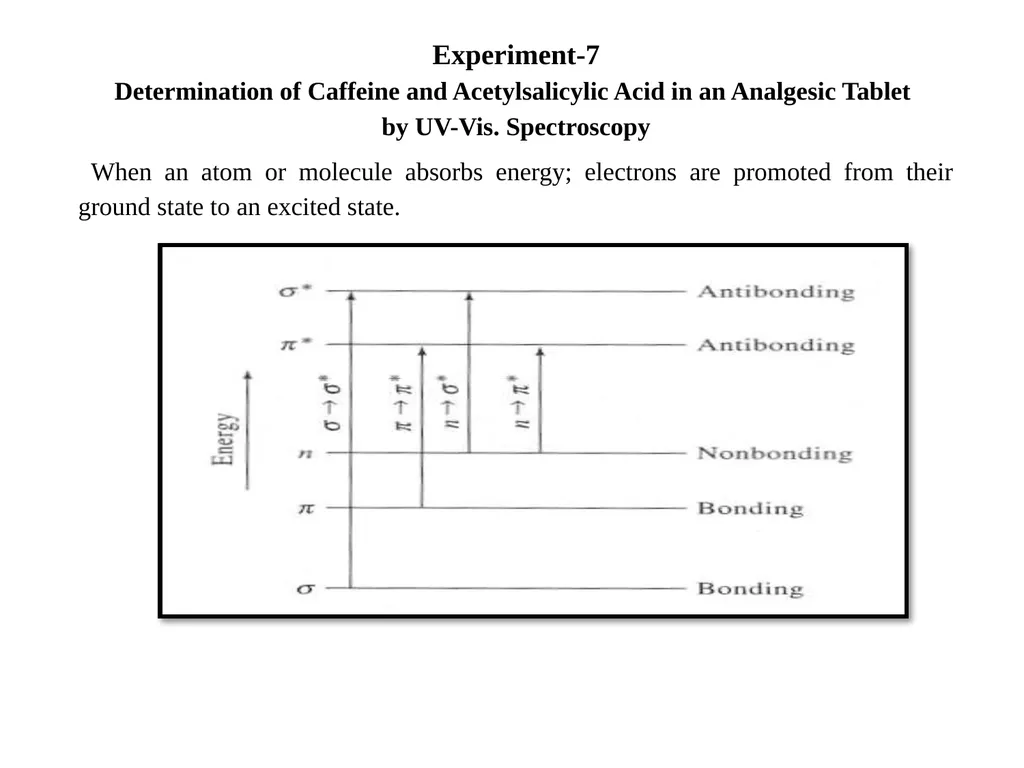
Experiment-7
Determination of Caffeine and Acetylsalicylic Acid in an Analgesic Tablet
by UV-Vis. Spectroscopy When an atom or molecule absorbs energy; electrons are promoted from their ground state to an excited state.<br>
Determination of Caffeine and Acetylsalicylic Acid in an Analgesic Tablet
by UV-Vis. Spectroscopy When an atom or molecule absorbs energy; electrons are promoted from their ground state to an excited state.<br>
58
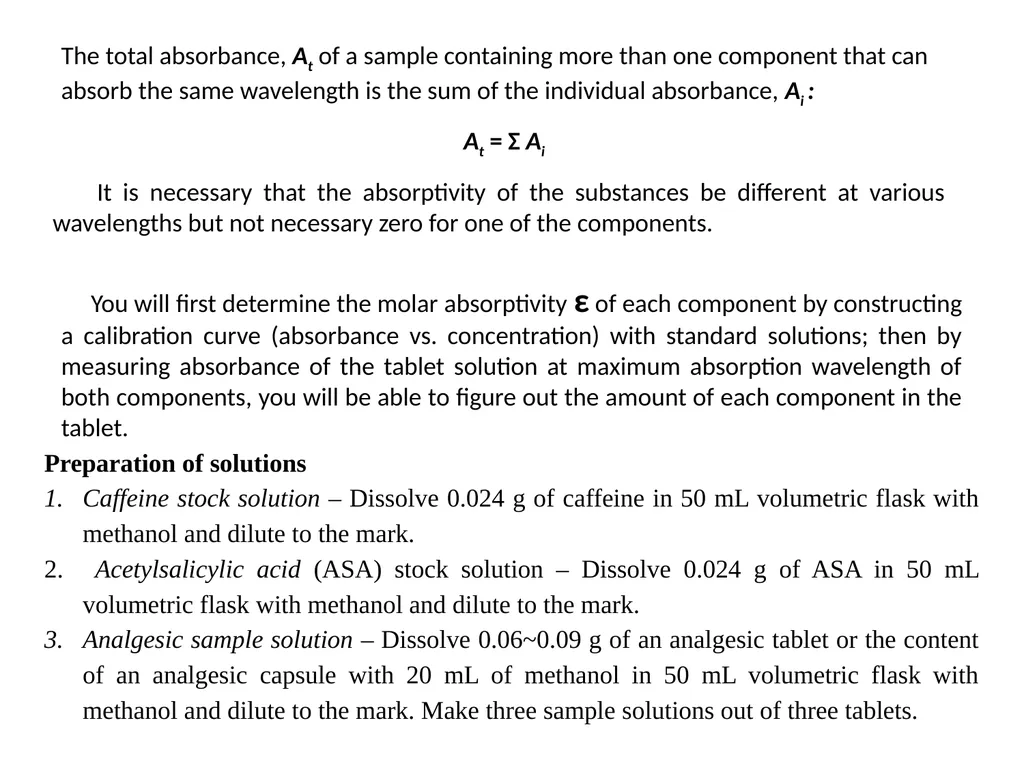
The total absorbance, At of a sample containing more than one component that can absorb the same wavelength is the sum of the individual absorbance, Ai : At = Σ Ai It is necessary that the absorptivity of the substances be different at various wavelengths but not necessary zero for one of the components. You will first determine the molar absorptivity ε of each component by constructing a calibration curve (absorbance vs. concentration) with standard solutions; then by measuring absorbance of the tablet solution at maximum absorption wavelength of both components, you will be able to figure out the amount of each component in the tablet. Preparation of solutions
Caffeine stock solution – Dissolve 0.024 g of caffeine in 50 mL volumetric flask with methanol and dilute to the mark.
Acetylsalicylic acid (ASA) stock solution – Dissolve 0.024 g of ASA in 50 mL volumetric flask with methanol and dilute to the mark.
Analgesic sample solution – Dissolve 0.06~0.09 g of an analgesic tablet or the content of an analgesic capsule with 20 mL of methanol in 50 mL volumetric flask with methanol and dilute to the mark. Make three sample solutions out of three tablets.<br>
Caffeine stock solution – Dissolve 0.024 g of caffeine in 50 mL volumetric flask with methanol and dilute to the mark.
Acetylsalicylic acid (ASA) stock solution – Dissolve 0.024 g of ASA in 50 mL volumetric flask with methanol and dilute to the mark.
Analgesic sample solution – Dissolve 0.06~0.09 g of an analgesic tablet or the content of an analgesic capsule with 20 mL of methanol in 50 mL volumetric flask with methanol and dilute to the mark. Make three sample solutions out of three tablets.<br>
59
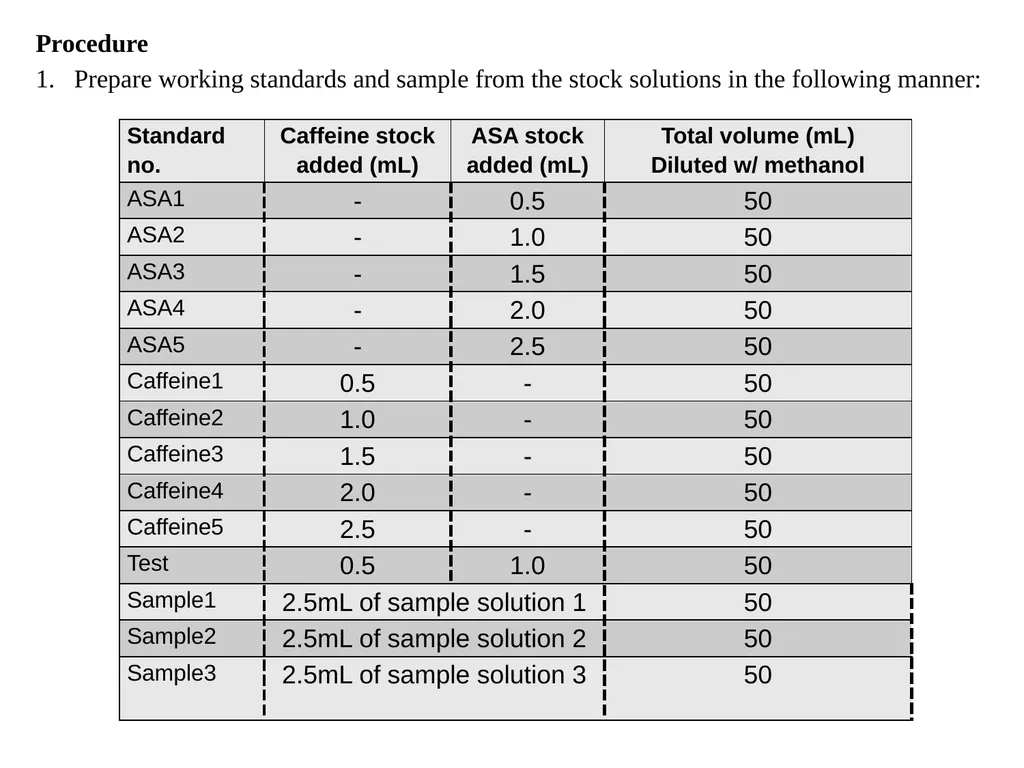
Procedure
Prepare working standards and sample from the stock solutions in the following manner:<br>
Prepare working standards and sample from the stock solutions in the following manner:<br>
60
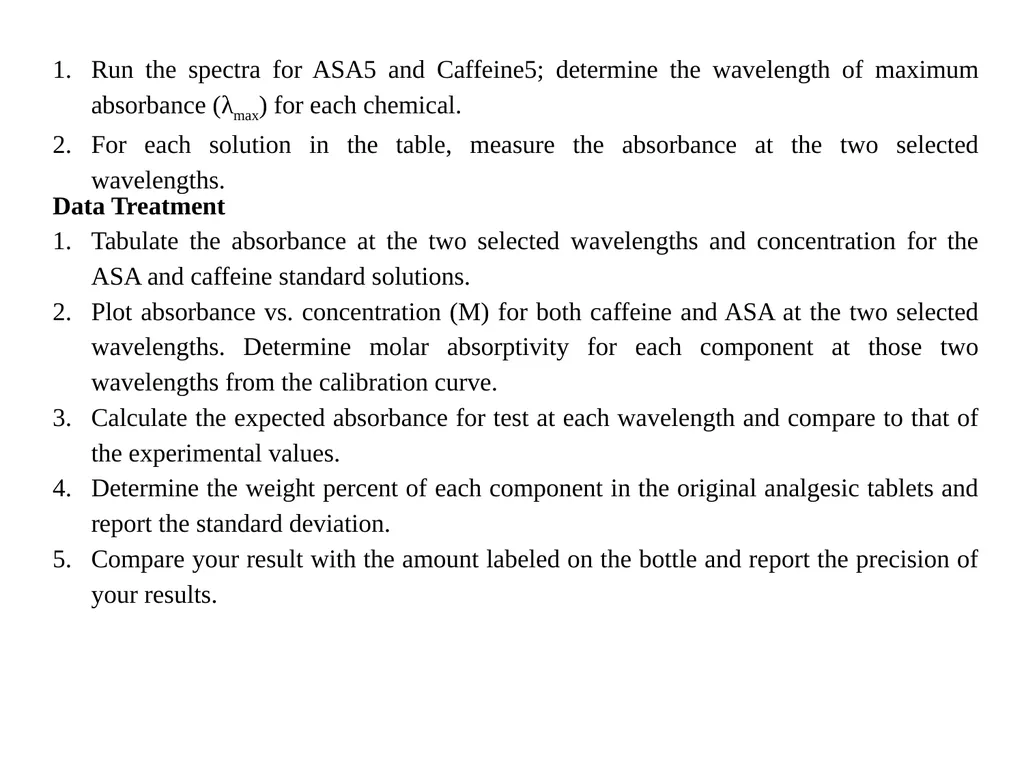
Run the spectra for ASA5 and Caffeine5; determine the wavelength of maximum absorbance (λmax) for each chemical.
For each solution in the table, measure the absorbance at the two selected wavelengths. Data Treatment
Tabulate the absorbance at the two selected wavelengths and concentration for the ASA and caffeine standard solutions.
Plot absorbance vs. concentration (M) for both caffeine and ASA at the two selected wavelengths. Determine molar absorptivity for each component at those two wavelengths from the calibration curve.
Calculate the expected absorbance for test at each wavelength and compare to that of the experimental values.
Determine the weight percent of each component in the original analgesic tablets and report the standard deviation.
Compare your result with the amount labeled on the bottle and report the precision of your results.<br>
For each solution in the table, measure the absorbance at the two selected wavelengths. Data Treatment
Tabulate the absorbance at the two selected wavelengths and concentration for the ASA and caffeine standard solutions.
Plot absorbance vs. concentration (M) for both caffeine and ASA at the two selected wavelengths. Determine molar absorptivity for each component at those two wavelengths from the calibration curve.
Calculate the expected absorbance for test at each wavelength and compare to that of the experimental values.
Determine the weight percent of each component in the original analgesic tablets and report the standard deviation.
Compare your result with the amount labeled on the bottle and report the precision of your results.<br>