
2016 Status Report Georgia State University

Description: 2016 Status Report Georgia State University Complete College Georgia Overview When it comes to higher education, the vision of the United States as a land of equal opportunity is far from a reality. Today, it is eight times more likely that
Related Topics
Download Presentation
"2016 Status Report Georgia State University" is the property of its rightful owner. Permission is granted to download and print the materials on this website for personal, non-commercial use only, and to display it on your personal computer provided you do not modify the materials and that you retain all copyright notices contained in the materials. By downloading content from our website, you accept the terms of this agreement.
Presentation Transcript
slide1. 2016 Status Report
Georgia State University Complete College Georgia<br>
slide2. Overview
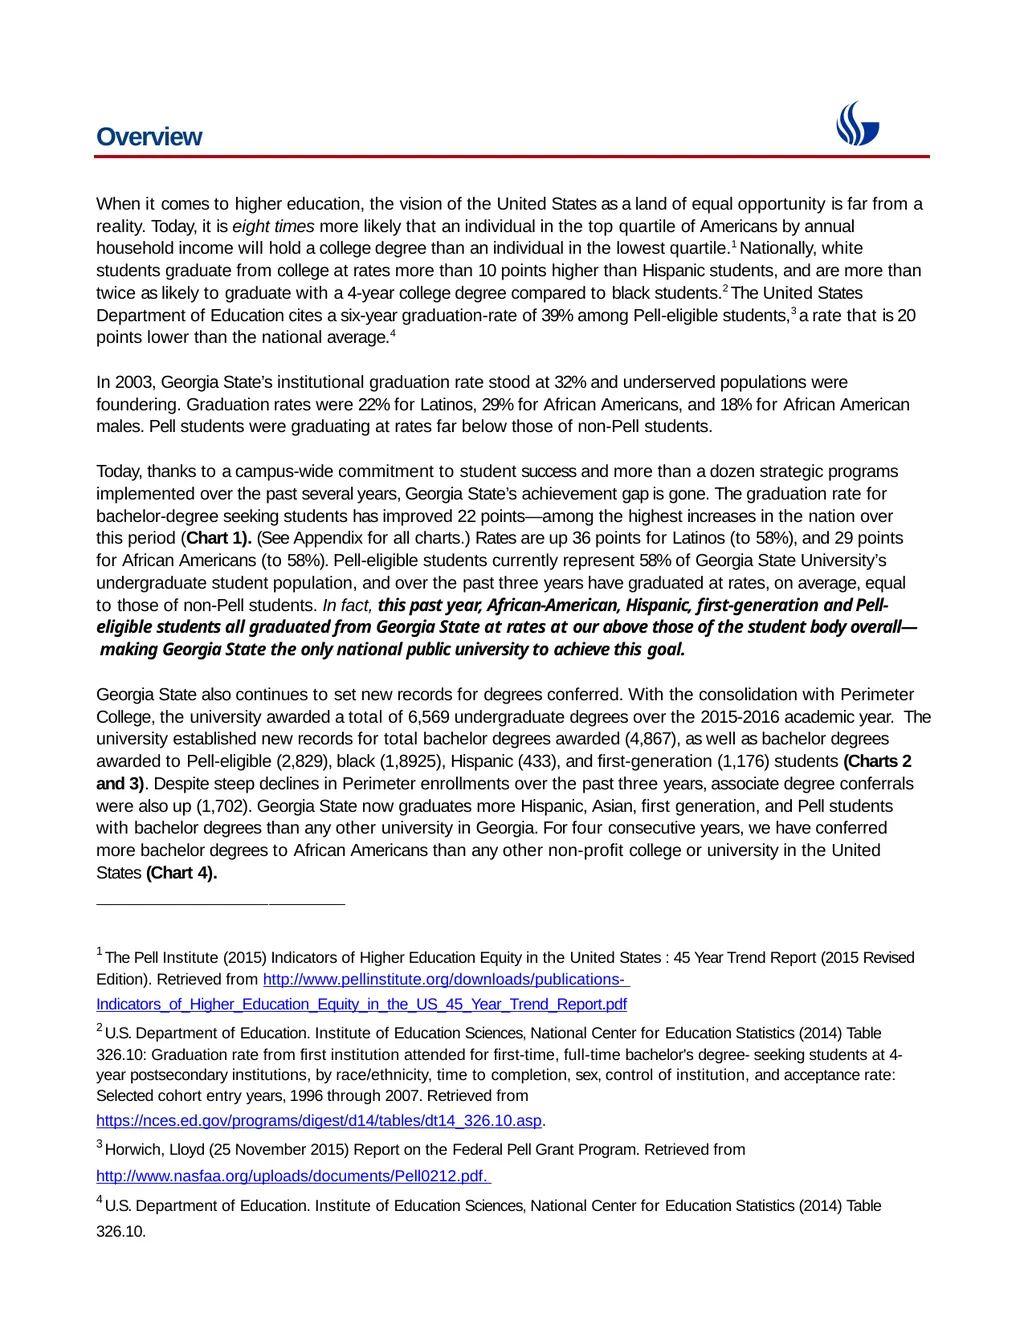
When it comes to higher education, the vision of the United States as a land of equal opportunity is far from a reality. Today, it is eight times more likely that an individual in the top quartile of Americans by annual household income will hold a college degree than an individual in the lowest quartile.1 Nationally, white students graduate from college at rates more than 10 points higher than Hispanic students, and are more than twice as likely to graduate with a 4-year college degree compared to black students.2 The United States Department of Education cites a six-year graduation-rate of 39% among Pell-eligible students,3 a rate that is 20 points lower than the national average.4
In 2003, Georgia State’s institutional graduation rate stood at 32% and underserved populations were foundering. Graduation rates were 22% for Latinos, 29% for African Americans, and 18% for African American males. Pell students were graduating at rates far below those of non-Pell students.
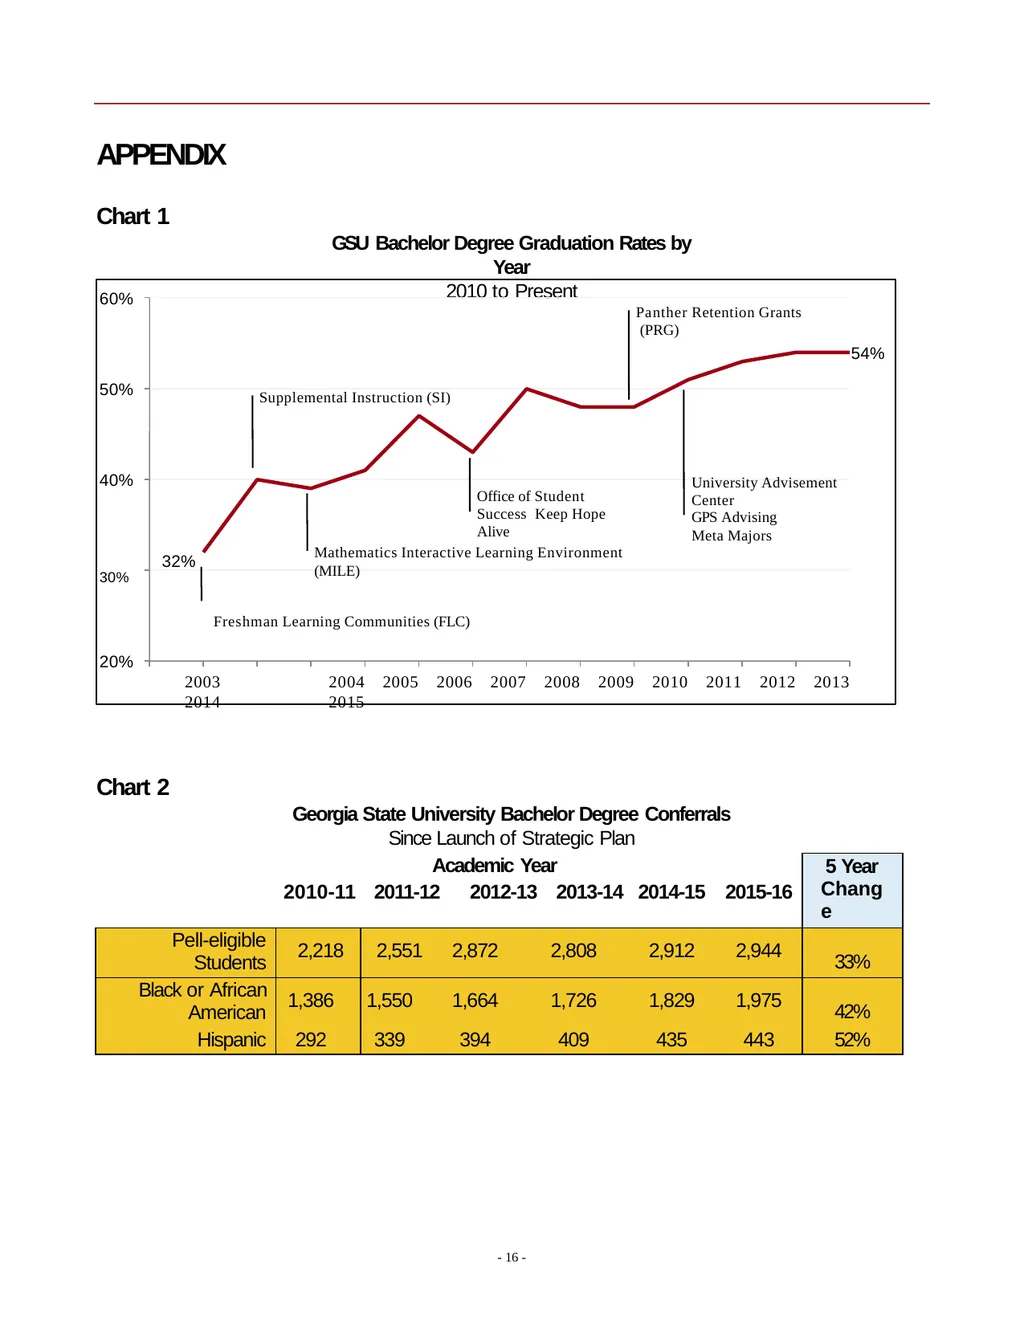
Today, thanks to a campus-wide commitment to student success and more than a dozen strategic programs implemented over the past several years, Georgia State’s achievement gap is gone. The graduation rate for bachelor-degree seeking students has improved 22 points—among the highest increases in the nation over this period (Chart 1). (See Appendix for all charts.) Rates are up 36 points for Latinos (to 58%), and 29 points for African Americans (to 58%). Pell-eligible students currently represent 58% of Georgia State University’s undergraduate student population, and over the past three years have graduated at rates, on average, equal to those of non-Pell students. In fact, this past year, African-American, Hispanic, first-generation and Pell- eligible students all graduated from Georgia State at rates at our above those of the student body overall— making Georgia State the only national public university to achieve this goal.
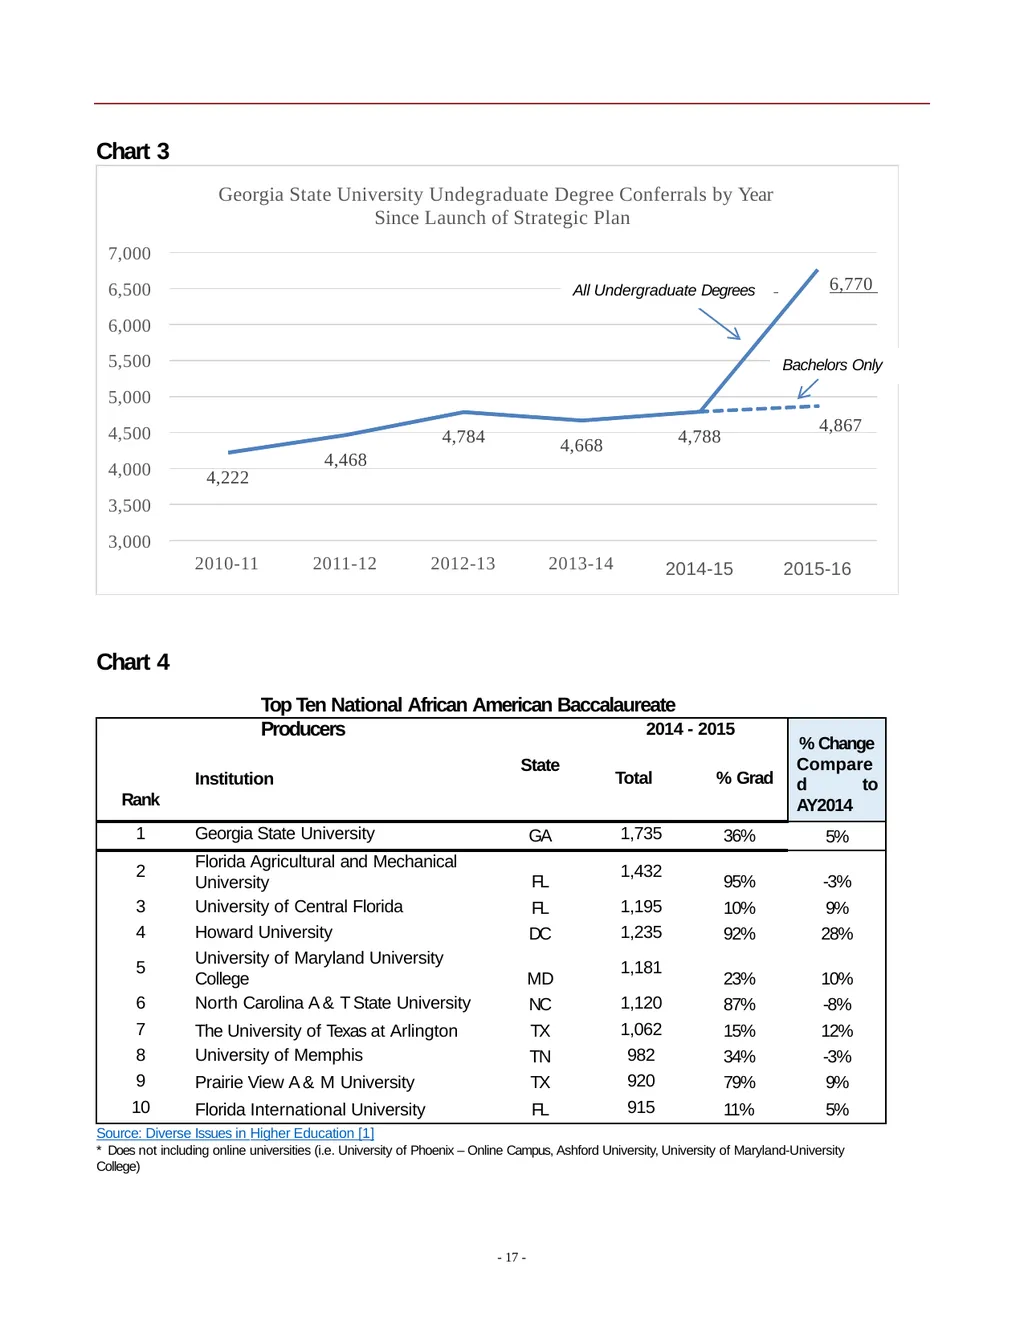
Georgia State also continues to set new records for degrees conferred. With the consolidation with Perimeter College, the university awarded a total of 6,569 undergraduate degrees over the 2015-2016 academic year. The university established new records for total bachelor degrees awarded (4,867), as well as bachelor degrees awarded to Pell-eligible (2,829), black (1,8925), Hispanic (433), and first-generation (1,176) students (Charts 2 and 3). Despite steep declines in Perimeter enrollments over the past three years, associate degree conferrals were also up (1,702). Georgia State now graduates more Hispanic, Asian, first generation, and Pell students with bachelor degrees than any other university in Georgia. For four consecutive years, we have conferred more bachelor degrees to African Americans than any other non-profit college or university in the United States (Chart 4).
1 The Pell Institute (2015) Indicators of Higher Education Equity in the United States : 45 Year Trend Report (2015 Revised Edition). Retrieved from http://www.pellinstitute.org/downloads/publications- Indicators_of_Higher_Education_Equity_in_the_US_45_Year_Trend_Report.pdf
2 U.S. Department of Education. Institute of Education Sciences, National Center for Education Statistics (2014) Table 326.10: Graduation rate from first institution attended for first-time, full-time bachelor's degree- seeking students at 4- year postsecondary institutions, by race/ethnicity, time to completion, sex, control of institution, and acceptance rate: Selected cohort entry years, 1996 through 2007. Retrieved from https://nces.ed.gov/programs/digest/d14/tables/dt14_326.10.asp.
3 Horwich, Lloyd (25 November 2015) Report on the Federal Pell Grant Program. Retrieved from http://www.nasfaa.org/uploads/documents/Pell0212.pdf.
4 U.S. Department of Education. Institute of Education Sciences, National Center for Education Statistics (2014) Table 326.10.<br>
slide3. I. Institutional Mission and Student Body Profile
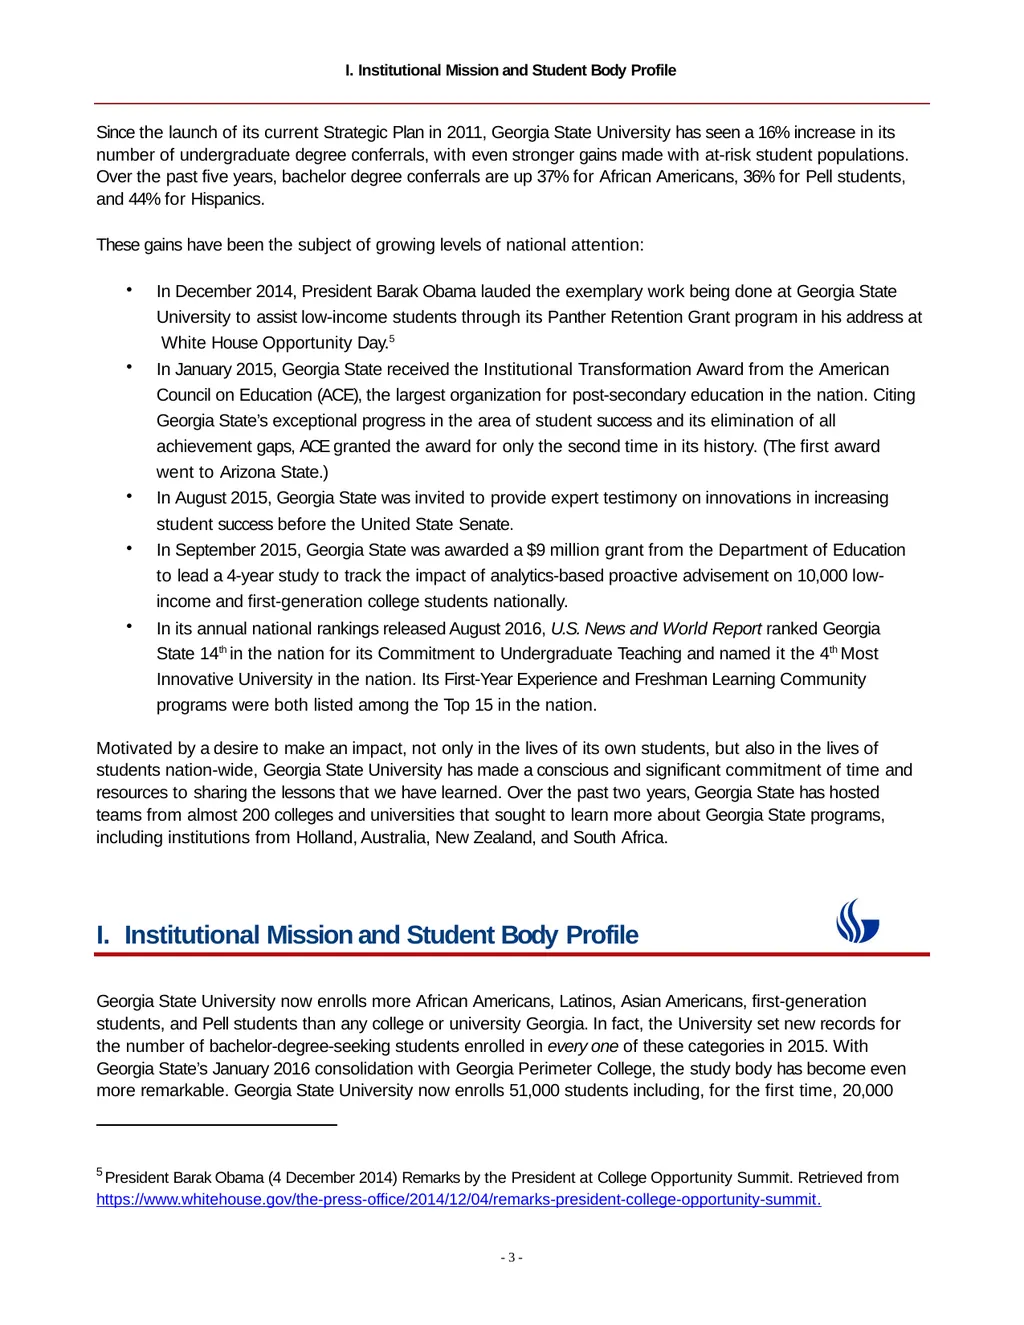
Since the launch of its current Strategic Plan in 2011, Georgia State University has seen a 16% increase in its number of undergraduate degree conferrals, with even stronger gains made with at-risk student populations. Over the past five years, bachelor degree conferrals are up 37% for African Americans, 36% for Pell students, and 44% for Hispanics.
These gains have been the subject of growing levels of national attention:
In December 2014, President Barak Obama lauded the exemplary work being done at Georgia State University to assist low-income students through its Panther Retention Grant program in his address at White House Opportunity Day.5
In January 2015, Georgia State received the Institutional Transformation Award from the American Council on Education (ACE), the largest organization for post-secondary education in the nation. Citing Georgia State’s exceptional progress in the area of student success and its elimination of all achievement gaps, ACE granted the award for only the second time in its history. (The first award went to Arizona State.)
In August 2015, Georgia State was invited to provide expert testimony on innovations in increasing student success before the United State Senate.
In September 2015, Georgia State was awarded a $9 million grant from the Department of Education to lead a 4-year study to track the impact of analytics-based proactive advisement on 10,000 low- income and first-generation college students nationally.
In its annual national rankings released August 2016, U.S. News and World Report ranked Georgia State 14th in the nation for its Commitment to Undergraduate Teaching and named it the 4th Most Innovative University in the nation. Its First-Year Experience and Freshman Learning Community programs were both listed among the Top 15 in the nation.
Motivated by a desire to make an impact, not only in the lives of its own students, but also in the lives of students nation-wide, Georgia State University has made a conscious and significant commitment of time and resources to sharing the lessons that we have learned. Over the past two years, Georgia State has hosted teams from almost 200 colleges and universities that sought to learn more about Georgia State programs, including institutions from Holland, Australia, New Zealand, and South Africa. I. Institutional Mission and Student Body Profile
Georgia State University now enrolls more African Americans, Latinos, Asian Americans, first-generation students, and Pell students than any college or university Georgia. In fact, the University set new records for the number of bachelor-degree-seeking students enrolled in every one of these categories in 2015. With Georgia State’s January 2016 consolidation with Georgia Perimeter College, the study body has become even more remarkable. Georgia State University now enrolls 51,000 students including, for the first time, 20,000 5 President Barak Obama (4 December 2014) Remarks by the President at College Opportunity Summit. Retrieved from https://www.whitehouse.gov/the-press-office/2014/12/04/remarks-president-college-opportunity-summit. - 3 -<br>
slide4. I. Institutional Mission and Student Body Profile
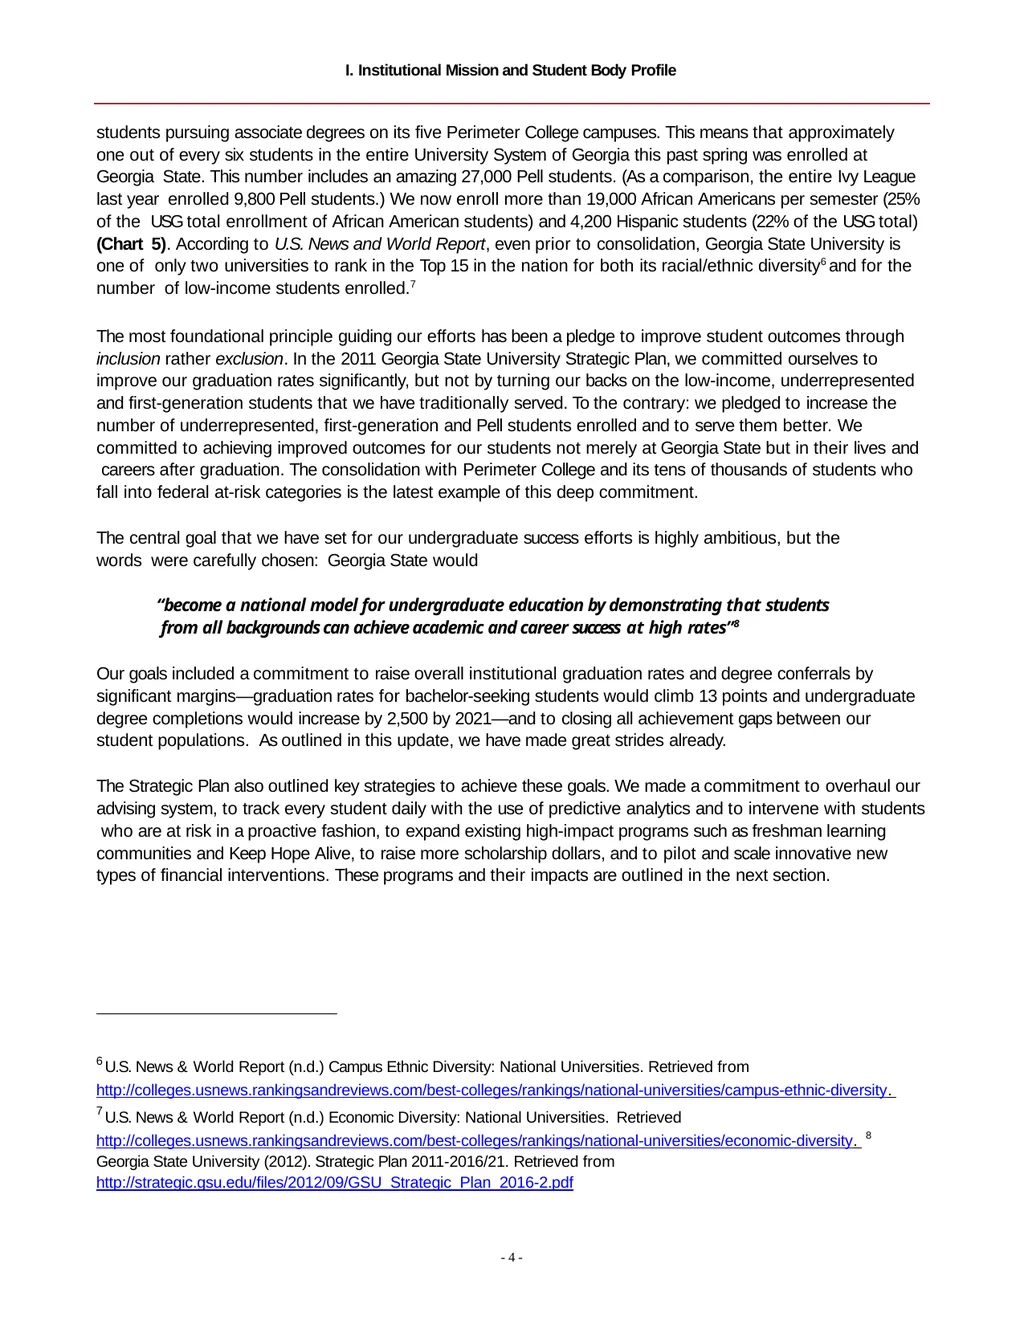
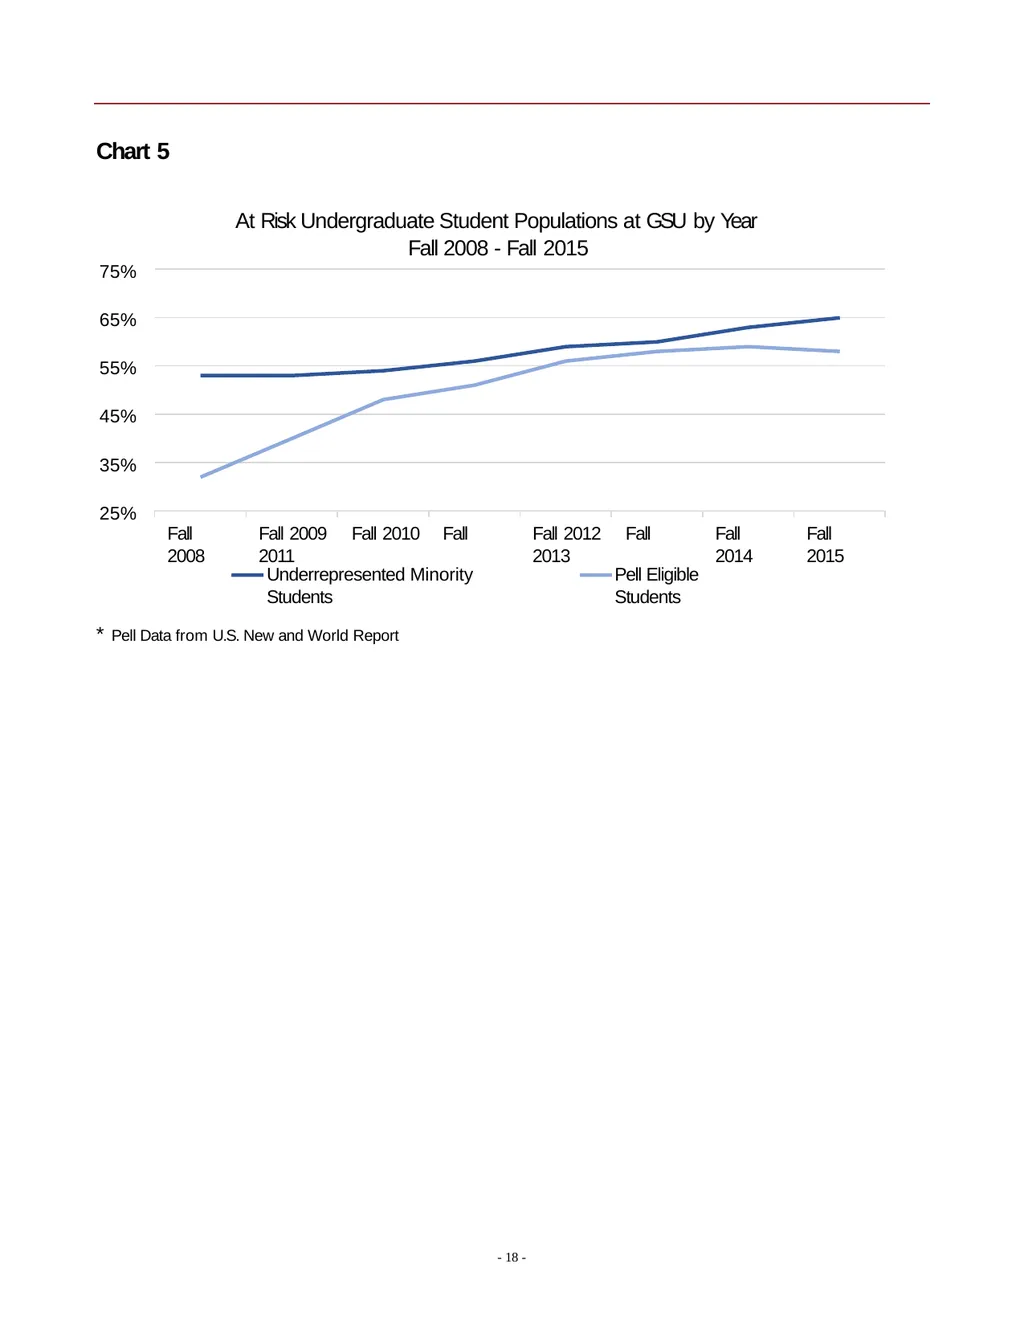
students pursuing associate degrees on its five Perimeter College campuses. This means that approximately one out of every six students in the entire University System of Georgia this past spring was enrolled at Georgia State. This number includes an amazing 27,000 Pell students. (As a comparison, the entire Ivy League last year enrolled 9,800 Pell students.) We now enroll more than 19,000 African Americans per semester (25% of the USG total enrollment of African American students) and 4,200 Hispanic students (22% of the USG total) (Chart 5). According to U.S. News and World Report, even prior to consolidation, Georgia State University is one of only two universities to rank in the Top 15 in the nation for both its racial/ethnic diversity6 and for the number of low-income students enrolled.7
The most foundational principle guiding our efforts has been a pledge to improve student outcomes through inclusion rather exclusion. In the 2011 Georgia State University Strategic Plan, we committed ourselves to improve our graduation rates significantly, but not by turning our backs on the low-income, underrepresented and first-generation students that we have traditionally served. To the contrary: we pledged to increase the number of underrepresented, first-generation and Pell students enrolled and to serve them better. We committed to achieving improved outcomes for our students not merely at Georgia State but in their lives and careers after graduation. The consolidation with Perimeter College and its tens of thousands of students who fall into federal at-risk categories is the latest example of this deep commitment.
The central goal that we have set for our undergraduate success efforts is highly ambitious, but the words were carefully chosen: Georgia State would
“become a national model for undergraduate education by demonstrating that students from all backgrounds can achieve academic and career success at high rates”8
Our goals included a commitment to raise overall institutional graduation rates and degree conferrals by significant margins—graduation rates for bachelor-seeking students would climb 13 points and undergraduate degree completions would increase by 2,500 by 2021—and to closing all achievement gaps between our student populations. As outlined in this update, we have made great strides already.
The Strategic Plan also outlined key strategies to achieve these goals. We made a commitment to overhaul our advising system, to track every student daily with the use of predictive analytics and to intervene with students who are at risk in a proactive fashion, to expand existing high-impact programs such as freshman learning communities and Keep Hope Alive, to raise more scholarship dollars, and to pilot and scale innovative new types of financial interventions. These programs and their impacts are outlined in the next section. 6 U.S. News & World Report (n.d.) Campus Ethnic Diversity: National Universities. Retrieved from http://colleges.usnews.rankingsandreviews.com/best-colleges/rankings/national-universities/campus-ethnic-diversity. 7 U.S. News & World Report (n.d.) Economic Diversity: National Universities. Retrieved
http://colleges.usnews.rankingsandreviews.com/best-colleges/rankings/national-universities/economic-diversity. 8 Georgia State University (2012). Strategic Plan 2011-2016/21. Retrieved from http://strategic.gsu.edu/files/2012/09/GSU_Strategic_Plan_2016-2.pdf - 4 -<br>
slide5. Institutional Completion Goals, High-Impact Strategies and Activities
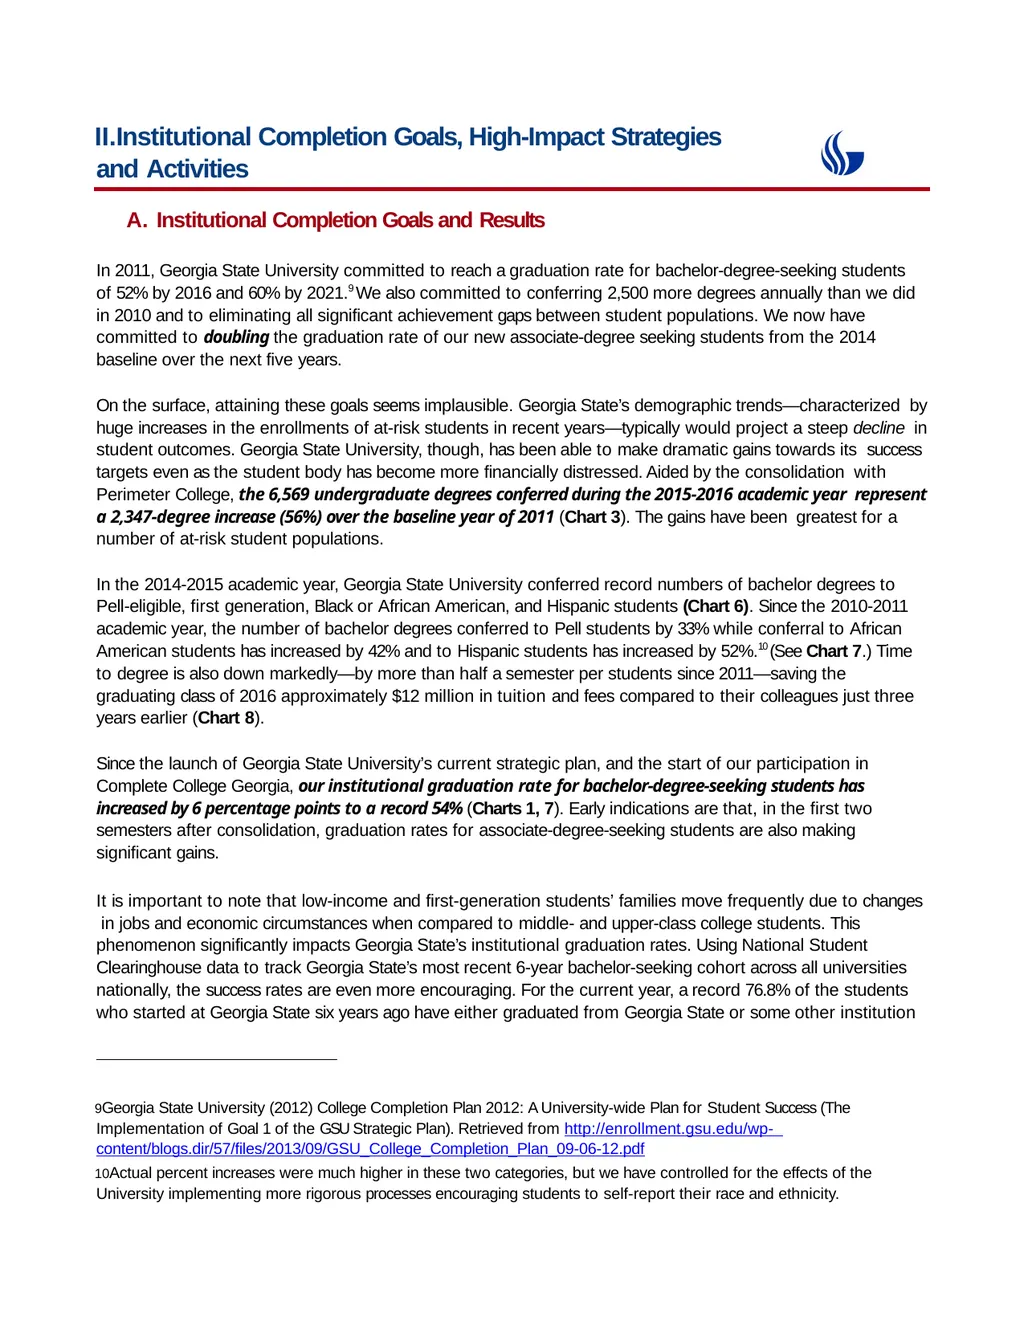
Institutional Completion Goals and Results
In 2011, Georgia State University committed to reach a graduation rate for bachelor-degree-seeking students of 52% by 2016 and 60% by 2021.9 We also committed to conferring 2,500 more degrees annually than we did in 2010 and to eliminating all significant achievement gaps between student populations. We now have committed to doubling the graduation rate of our new associate-degree seeking students from the 2014 baseline over the next five years.
On the surface, attaining these goals seems implausible. Georgia State’s demographic trends—characterized by huge increases in the enrollments of at-risk students in recent years—typically would project a steep decline in student outcomes. Georgia State University, though, has been able to make dramatic gains towards its success targets even as the student body has become more financially distressed. Aided by the consolidation with Perimeter College, the 6,569 undergraduate degrees conferred during the 2015-2016 academic year represent a 2,347-degree increase (56%) over the baseline year of 2011 (Chart 3). The gains have been greatest for a number of at-risk student populations.
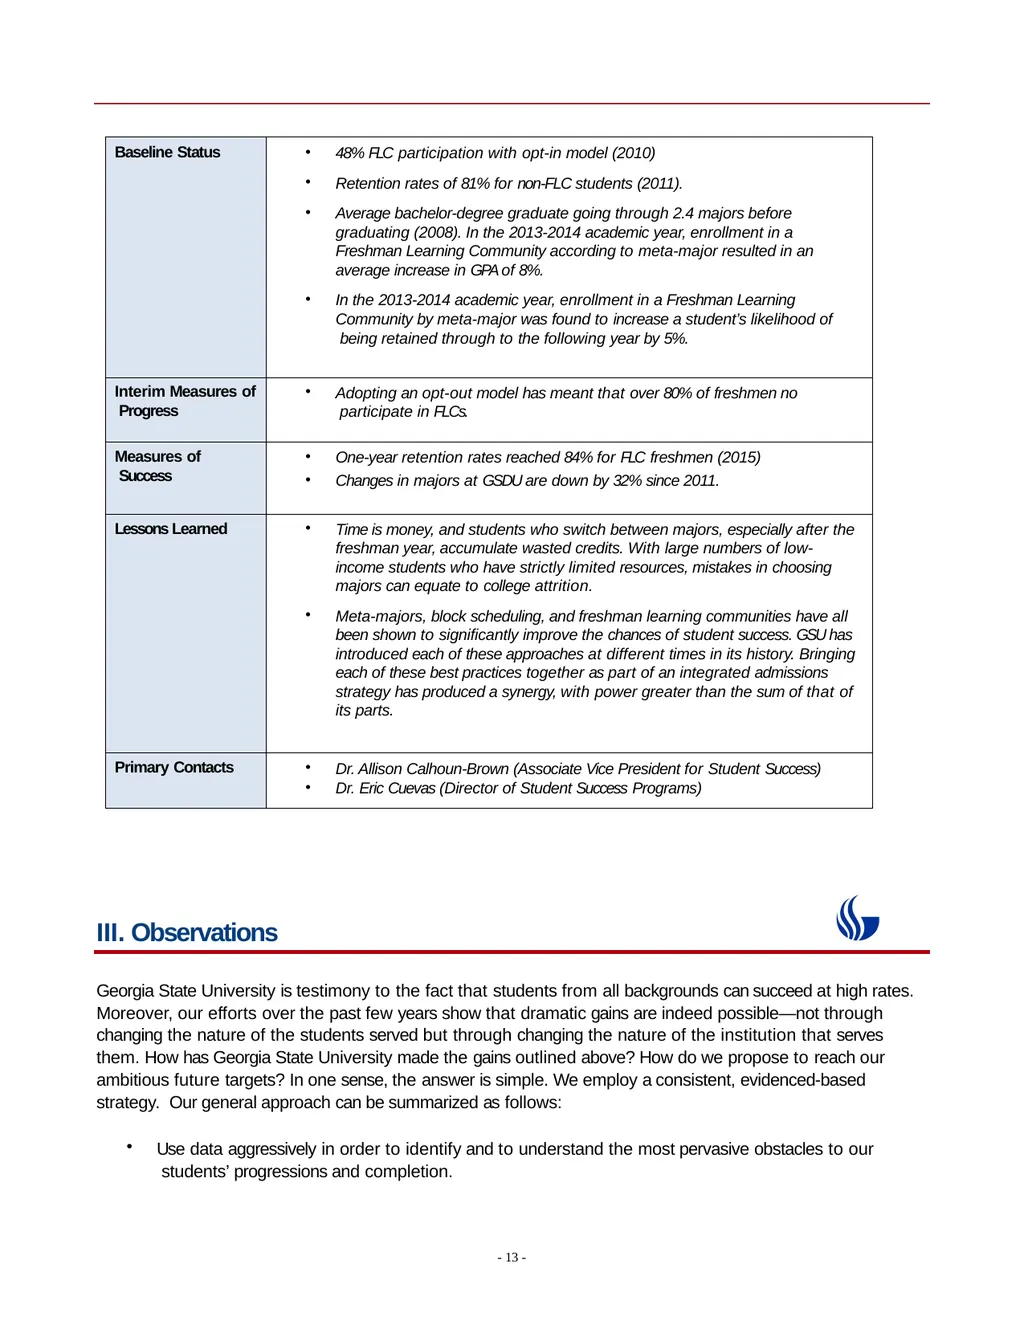
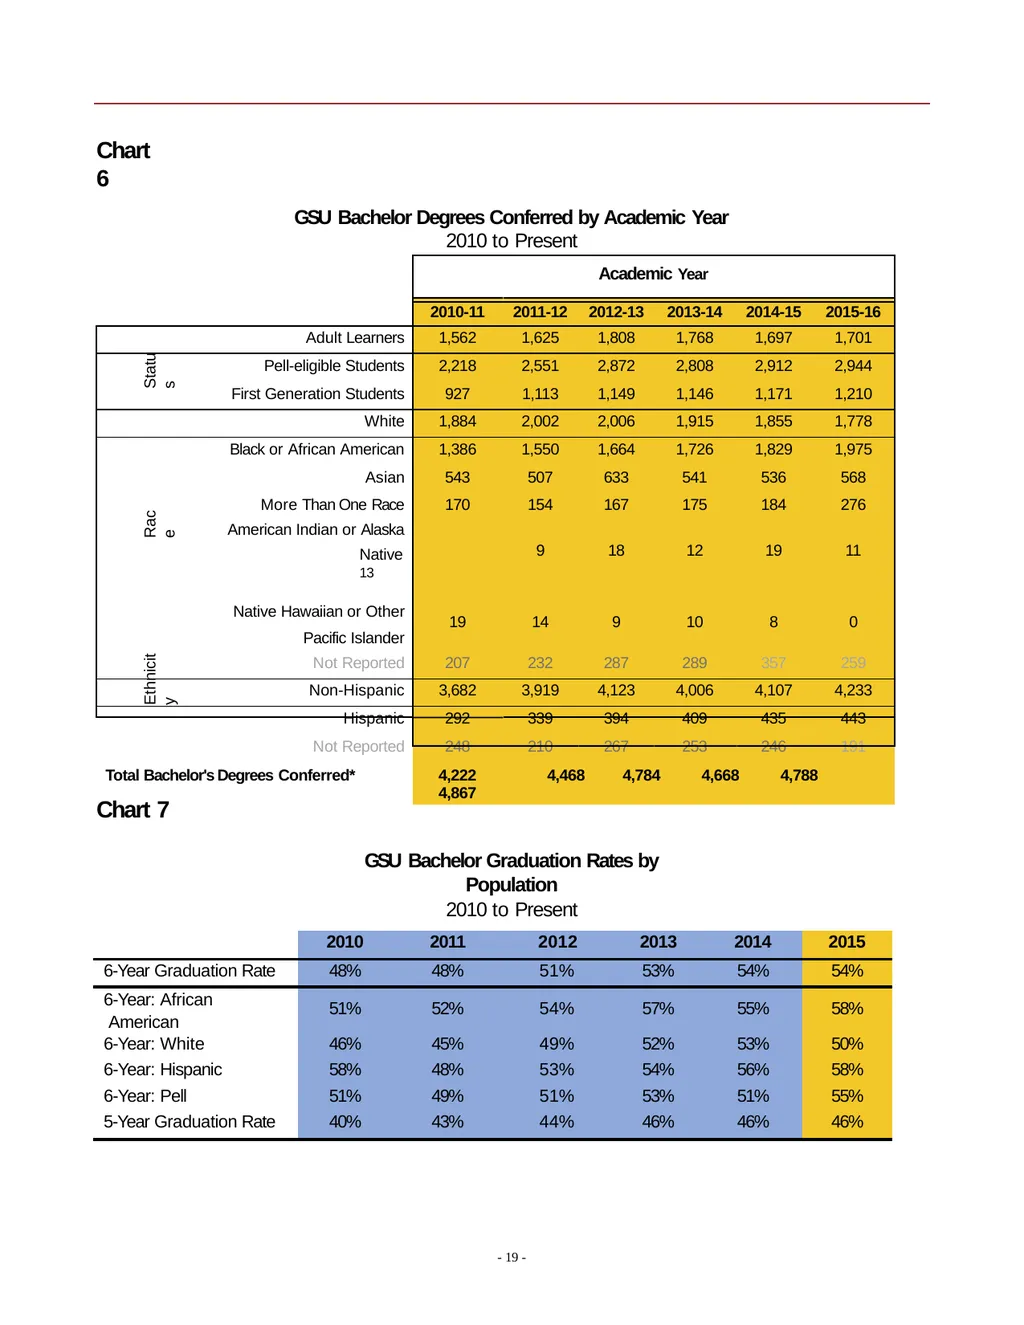
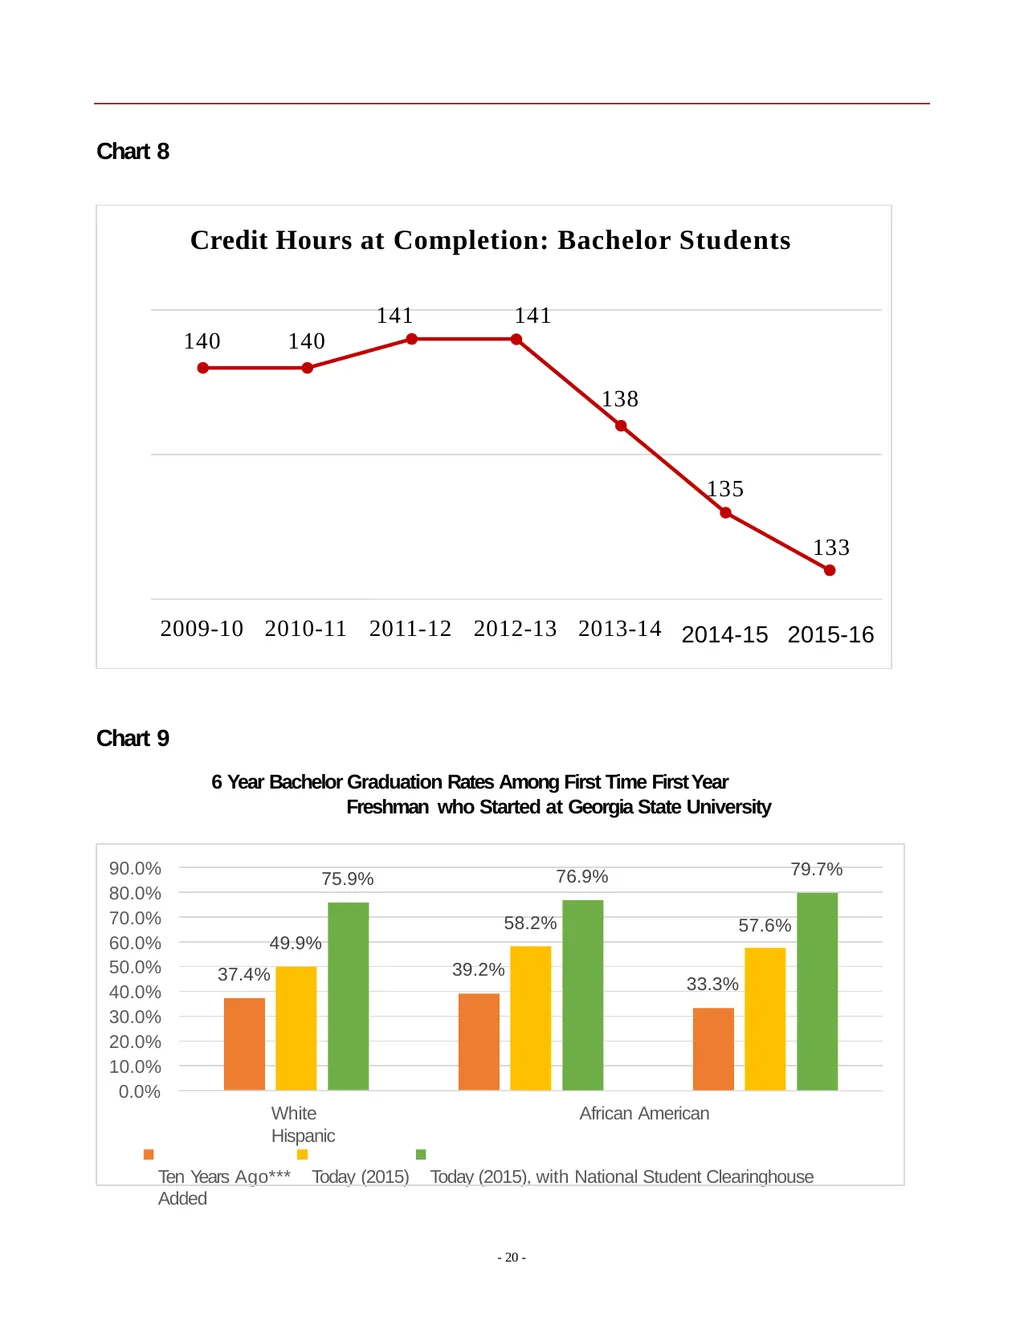
In the 2014-2015 academic year, Georgia State University conferred record numbers of bachelor degrees to Pell-eligible, first generation, Black or African American, and Hispanic students (Chart 6). Since the 2010-2011 academic year, the number of bachelor degrees conferred to Pell students by 33% while conferral to African American students has increased by 42% and to Hispanic students has increased by 52%.10 (See Chart 7.) Time to degree is also down markedly—by more than half a semester per students since 2011—saving the graduating class of 2016 approximately $12 million in tuition and fees compared to their colleagues just three years earlier (Chart 8).
Since the launch of Georgia State University’s current strategic plan, and the start of our participation in Complete College Georgia, our institutional graduation rate for bachelor-degree-seeking students has increased by 6 percentage points to a record 54% (Charts 1, 7). Early indications are that, in the first two semesters after consolidation, graduation rates for associate-degree-seeking students are also making significant gains.
It is important to note that low-income and first-generation students’ families move frequently due to changes in jobs and economic circumstances when compared to middle- and upper-class college students. This phenomenon significantly impacts Georgia State’s institutional graduation rates. Using National Student Clearinghouse data to track Georgia State’s most recent 6-year bachelor-seeking cohort across all universities nationally, the success rates are even more encouraging. For the current year, a record 76.8% of the students who started at Georgia State six years ago have either graduated from Georgia State or some other institution Georgia State University (2012) College Completion Plan 2012: A University-wide Plan for Student Success (The Implementation of Goal 1 of the GSU Strategic Plan). Retrieved from http://enrollment.gsu.edu/wp- content/blogs.dir/57/files/2013/09/GSU_College_Completion_Plan_09-06-12.pdf
Actual percent increases were much higher in these two categories, but we have controlled for the effects of the University implementing more rigorous processes encouraging students to self-report their race and ethnicity.<br>
slide6. or are still actively enrolled in college. The numbers for African American (77%) and Latino (80%) students in this category are even higher (Chart 9).
This combination of large increases in Pell enrollments and significantly rising graduation rates confounds the conventional wisdom. Nationally, one can track a strong correlation between increases in Pell rates and decreases in graduation rates. Georgia State’s completion efforts have made us a clear outlier nationally. In fact, among all of our peer institutions as defined by the BOR, Georgia State now has both the highest Pell rates and the highest graduation rates.
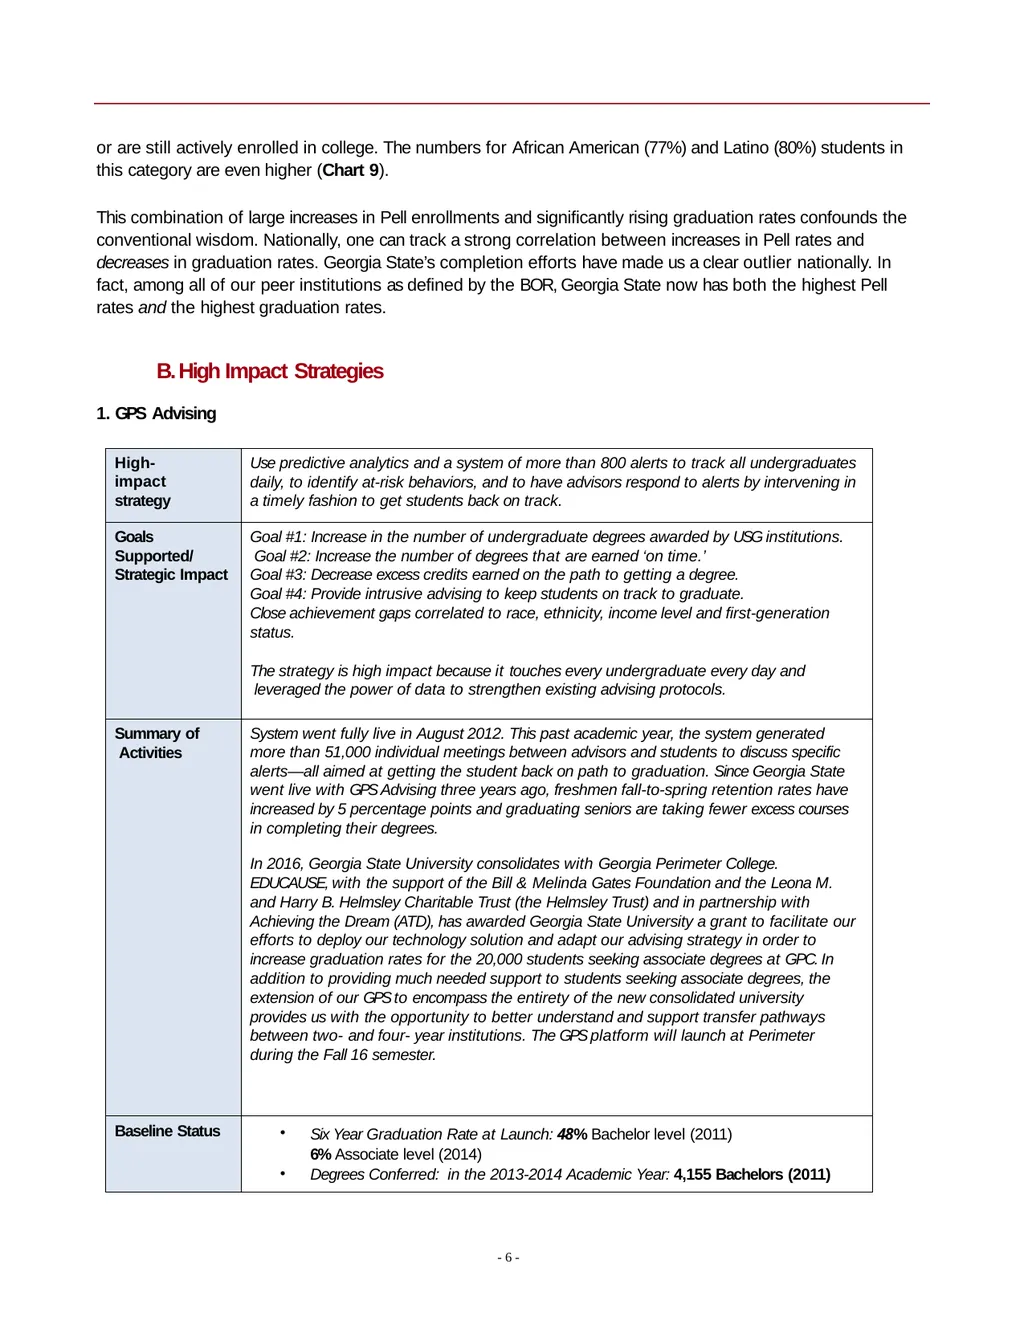
B. High Impact Strategies
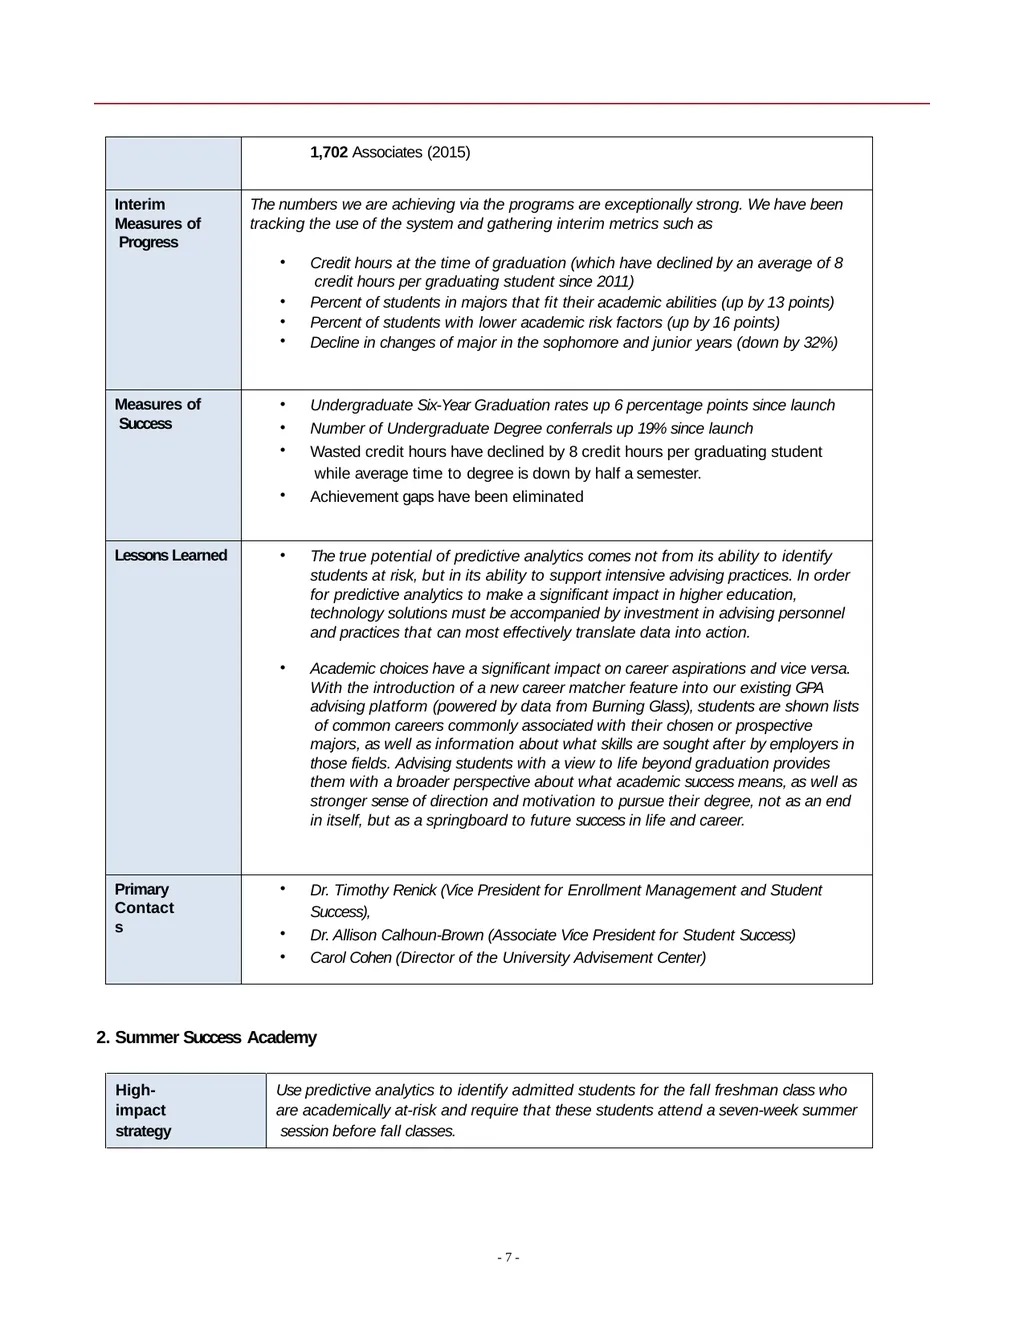
1. GPS Advising - 6 -<br>
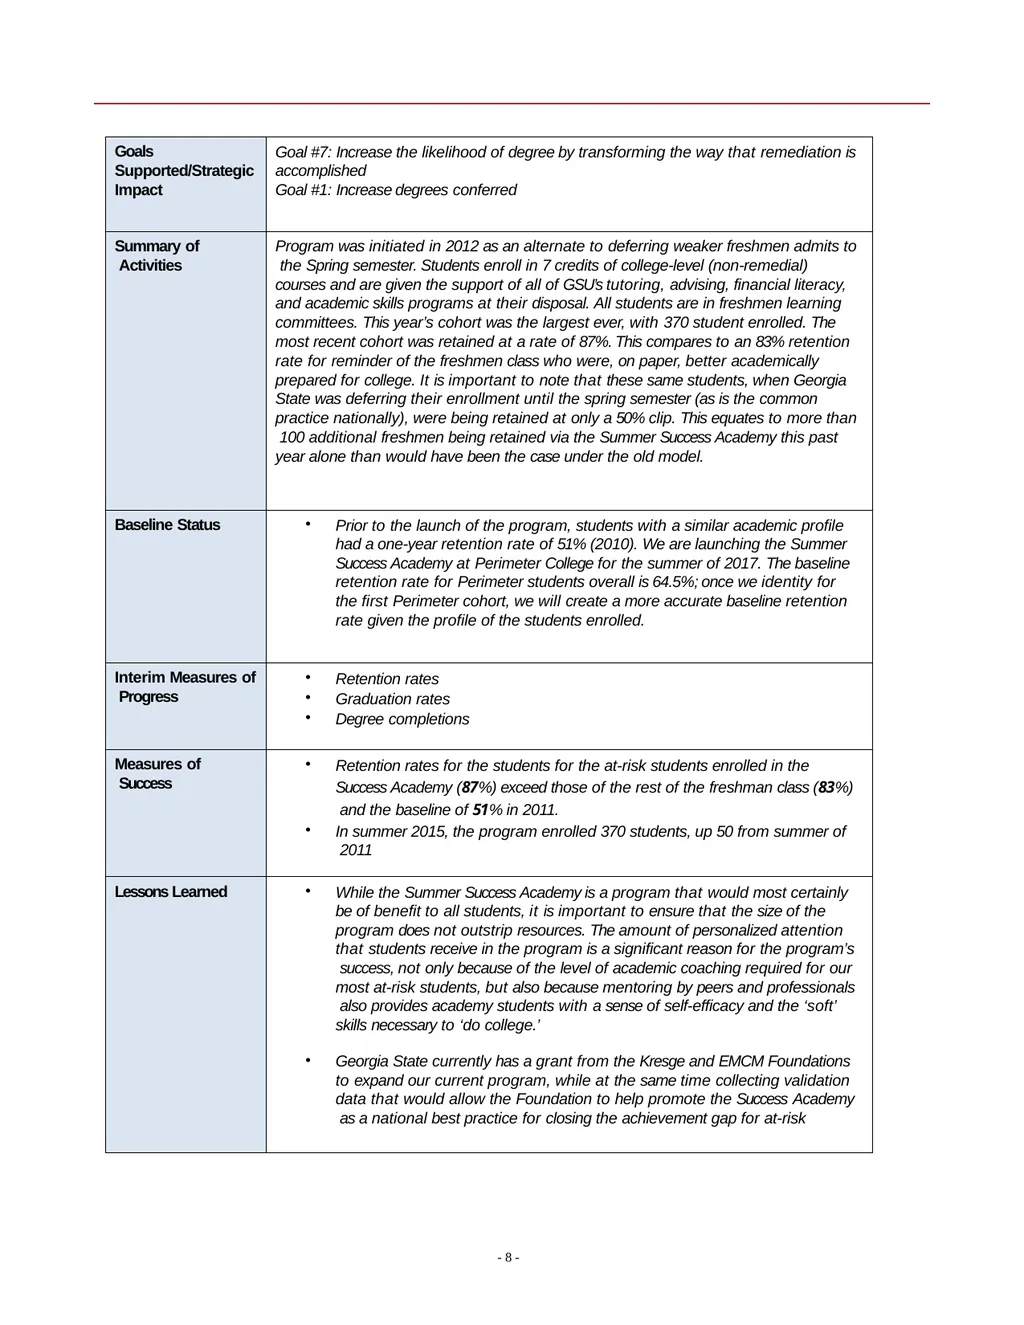
slide7. 2. Summer Success Academy High-impact strategy Use predictive analytics to identify admitted students for the fall freshman class who are academically at-risk and require that these students attend a seven-week summer session before fall classes. - 7 -<br>
slide8. - 8 -<br>
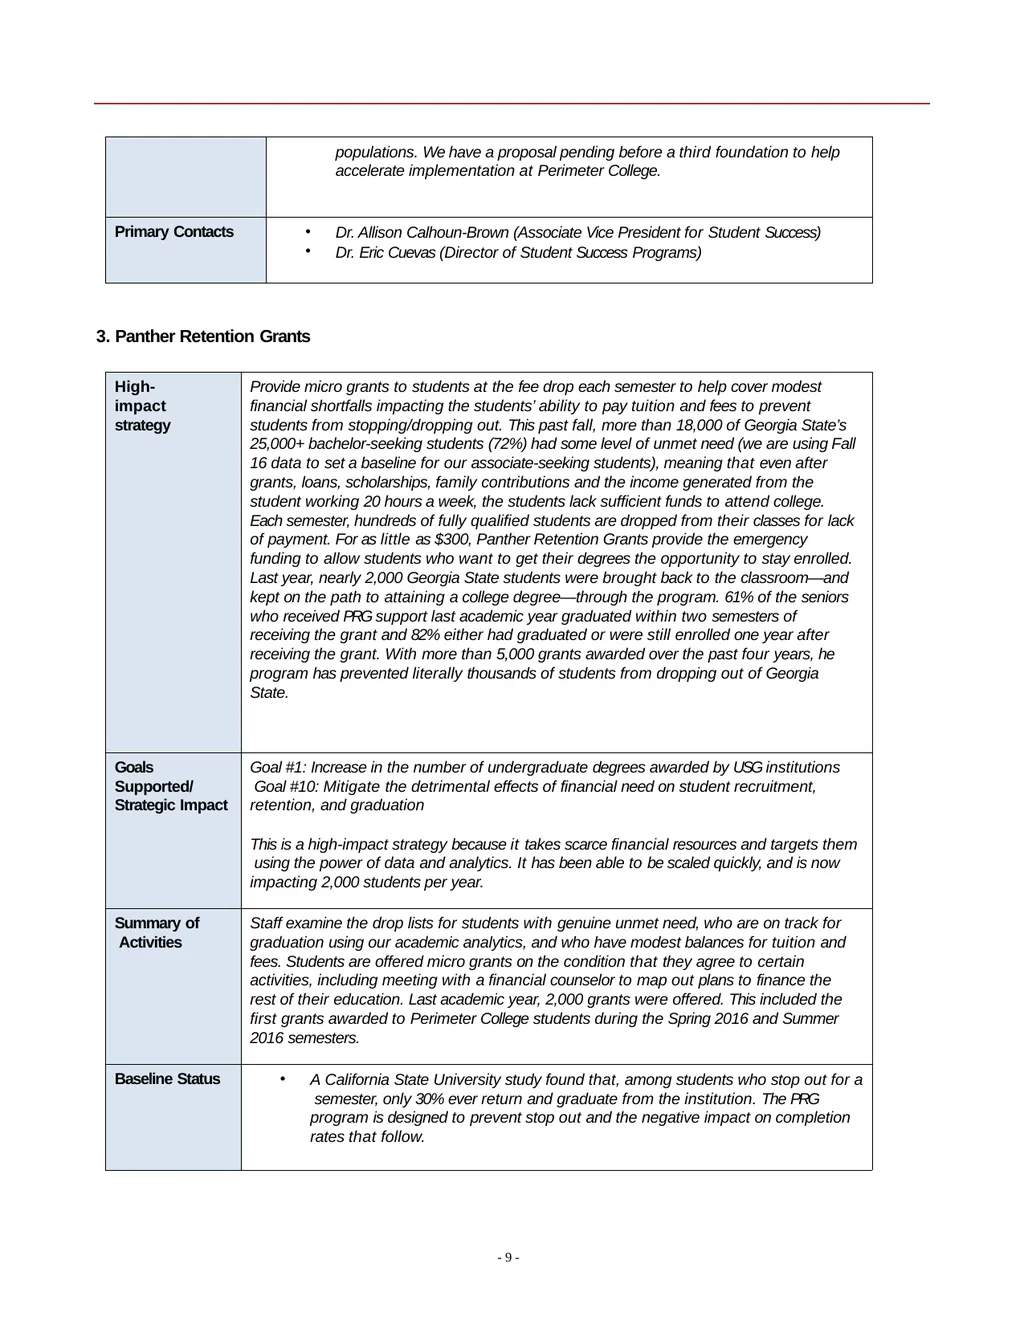
slide9. - 9 - 3. Panther Retention Grants<br>
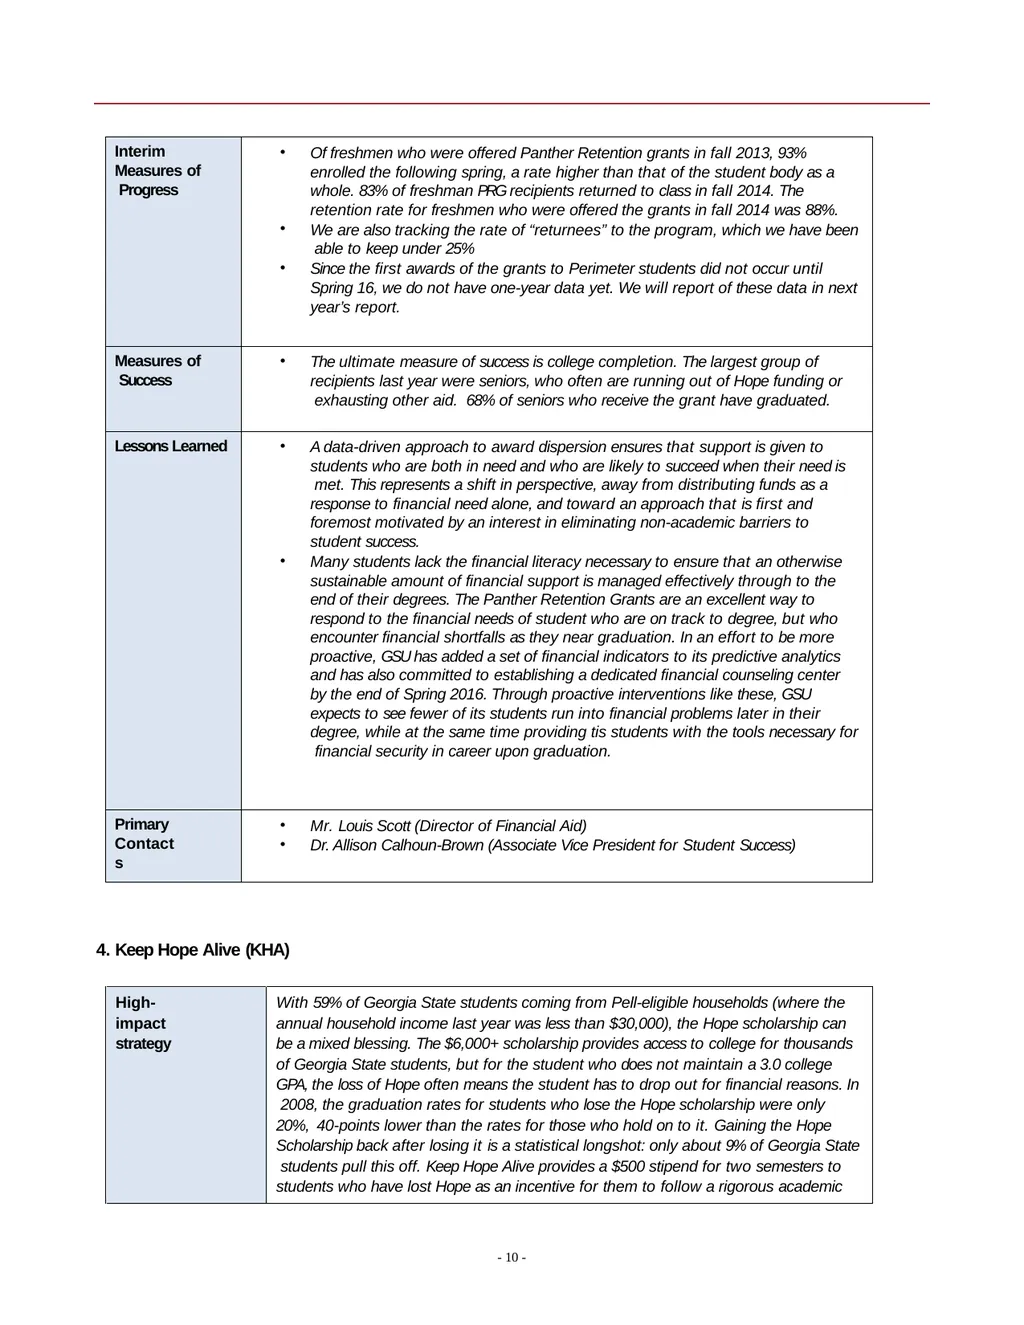
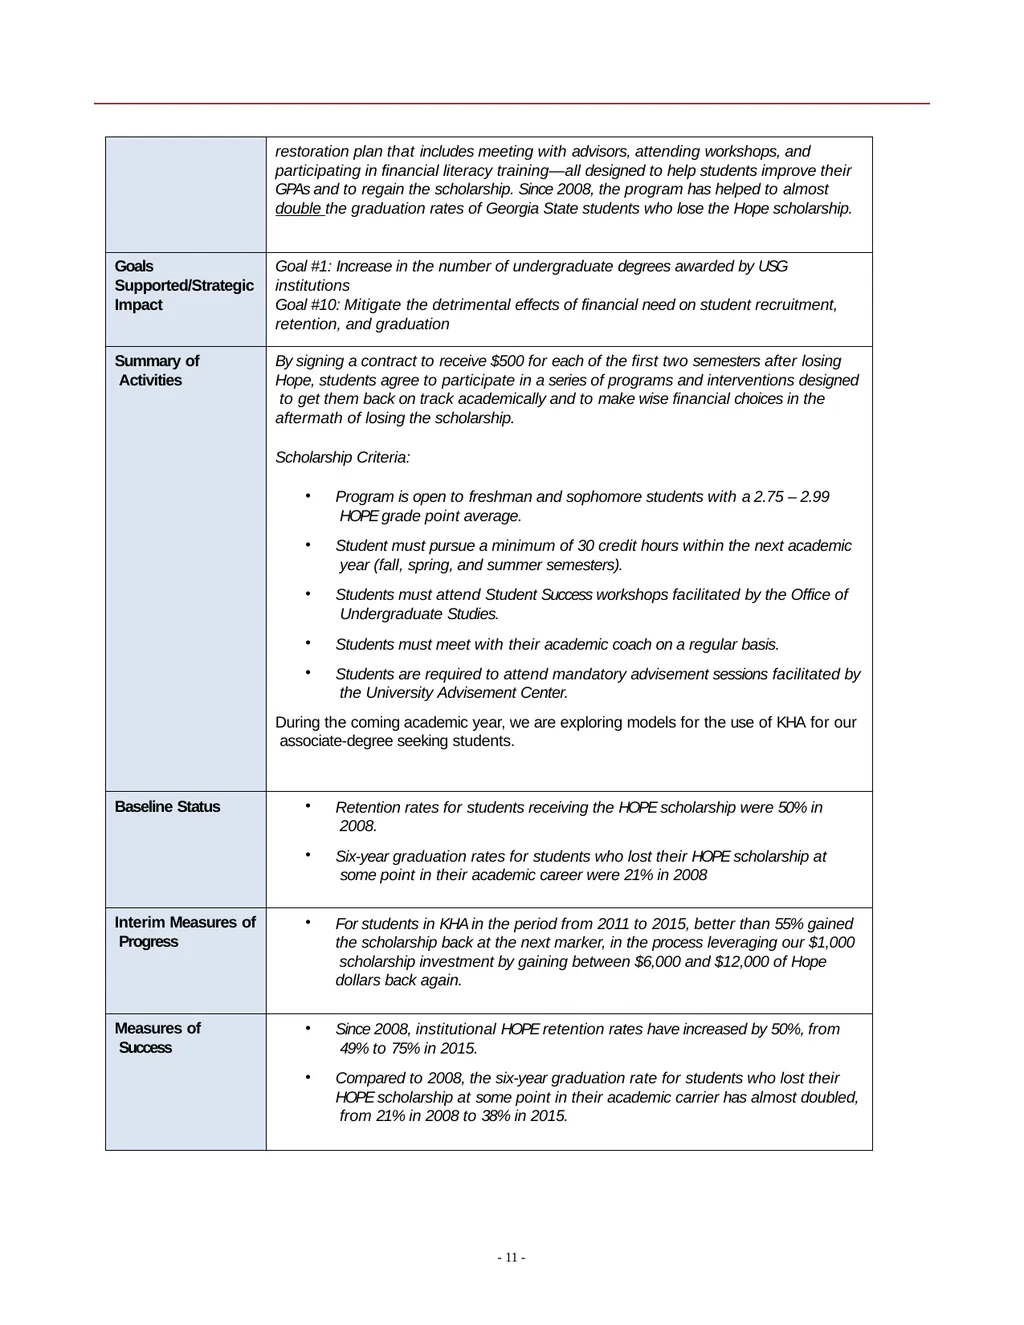
slide10. 4. Keep Hope Alive (KHA) High-impact strategy With 59% of Georgia State students coming from Pell-eligible households (where the annual household income last year was less than $30,000), the Hope scholarship can be a mixed blessing. The $6,000+ scholarship provides access to college for thousands of Georgia State students, but for the student who does not maintain a 3.0 college GPA, the loss of Hope often means the student has to drop out for financial reasons. In 2008, the graduation rates for students who lose the Hope scholarship were only 20%, 40-points lower than the rates for those who hold on to it. Gaining the Hope Scholarship back after losing it is a statistical longshot: only about 9% of Georgia State students pull this off. Keep Hope Alive provides a $500 stipend for two semesters to students who have lost Hope as an incentive for them to follow a rigorous academic - 10 -<br>
slide11. - 11 -<br>
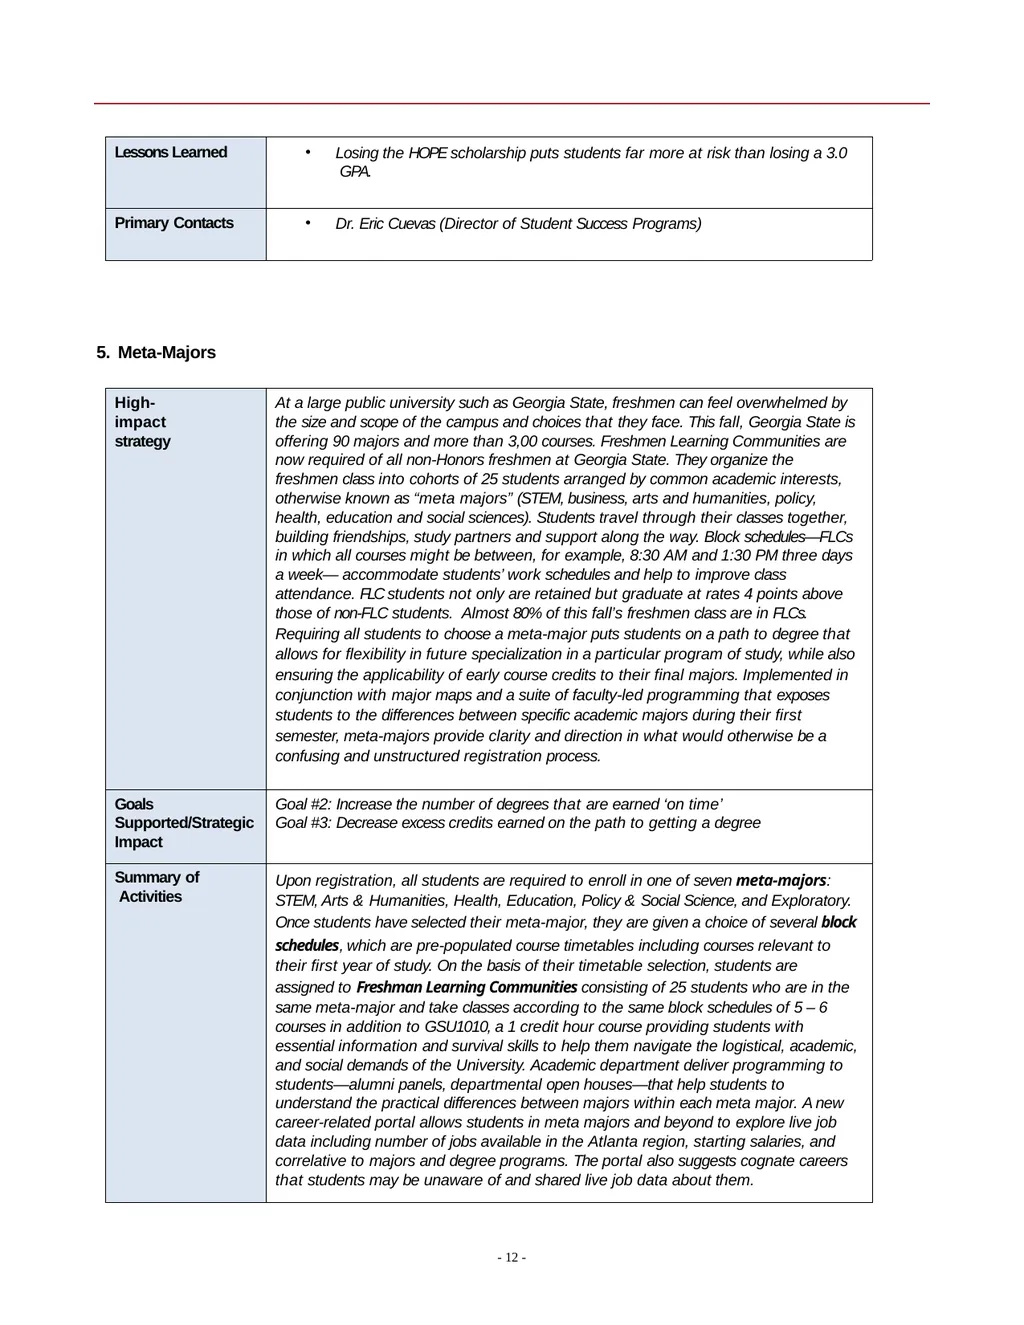
slide12. - 12 - 5. Meta-Majors<br>
slide13. Observations
Georgia State University is testimony to the fact that students from all backgrounds can succeed at high rates. Moreover, our efforts over the past few years show that dramatic gains are indeed possible—not through changing the nature of the students served but through changing the nature of the institution that serves them. How has Georgia State University made the gains outlined above? How do we propose to reach our ambitious future targets? In one sense, the answer is simple. We employ a consistent, evidenced-based strategy. Our general approach can be summarized as follows:
Use data aggressively in order to identify and to understand the most pervasive obstacles to our students’ progressions and completion. - 13 -<br>
slide14. Be willing to address the problems by becoming an early adopter. This means piloting new strategies and experimenting with new technologies. After all, we will not solve decades-old problems by the same old means.
Track the impacts of the new interventions via data and make adjustments as necessary to improve results.
Scale the initiatives that prove effective to have maximal impact. In fact, many of the programs that we offer are currently touching 10,000 students or more annually.
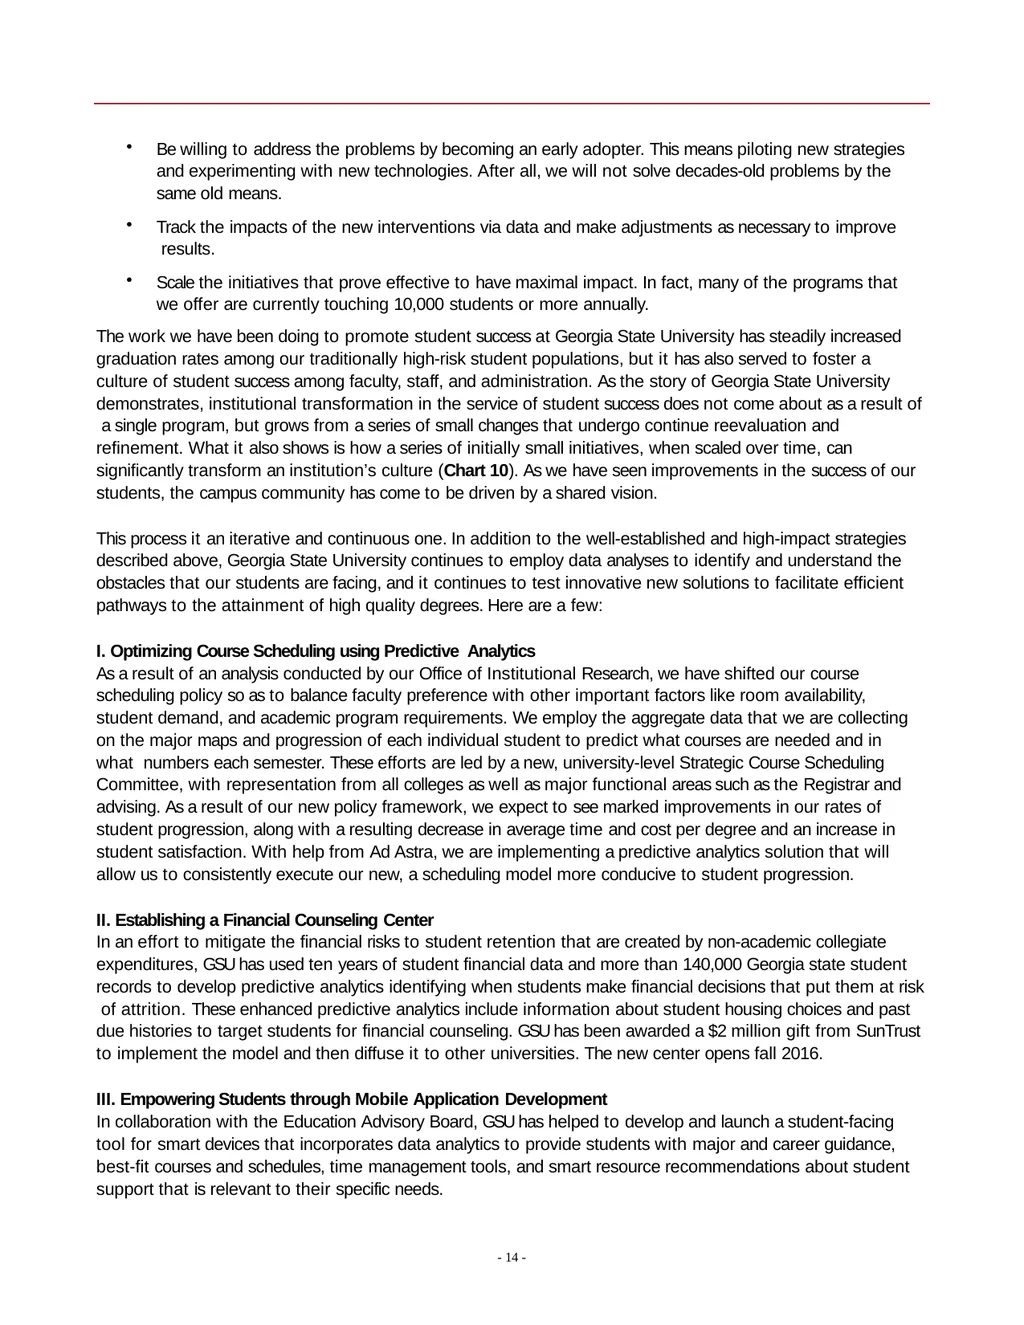
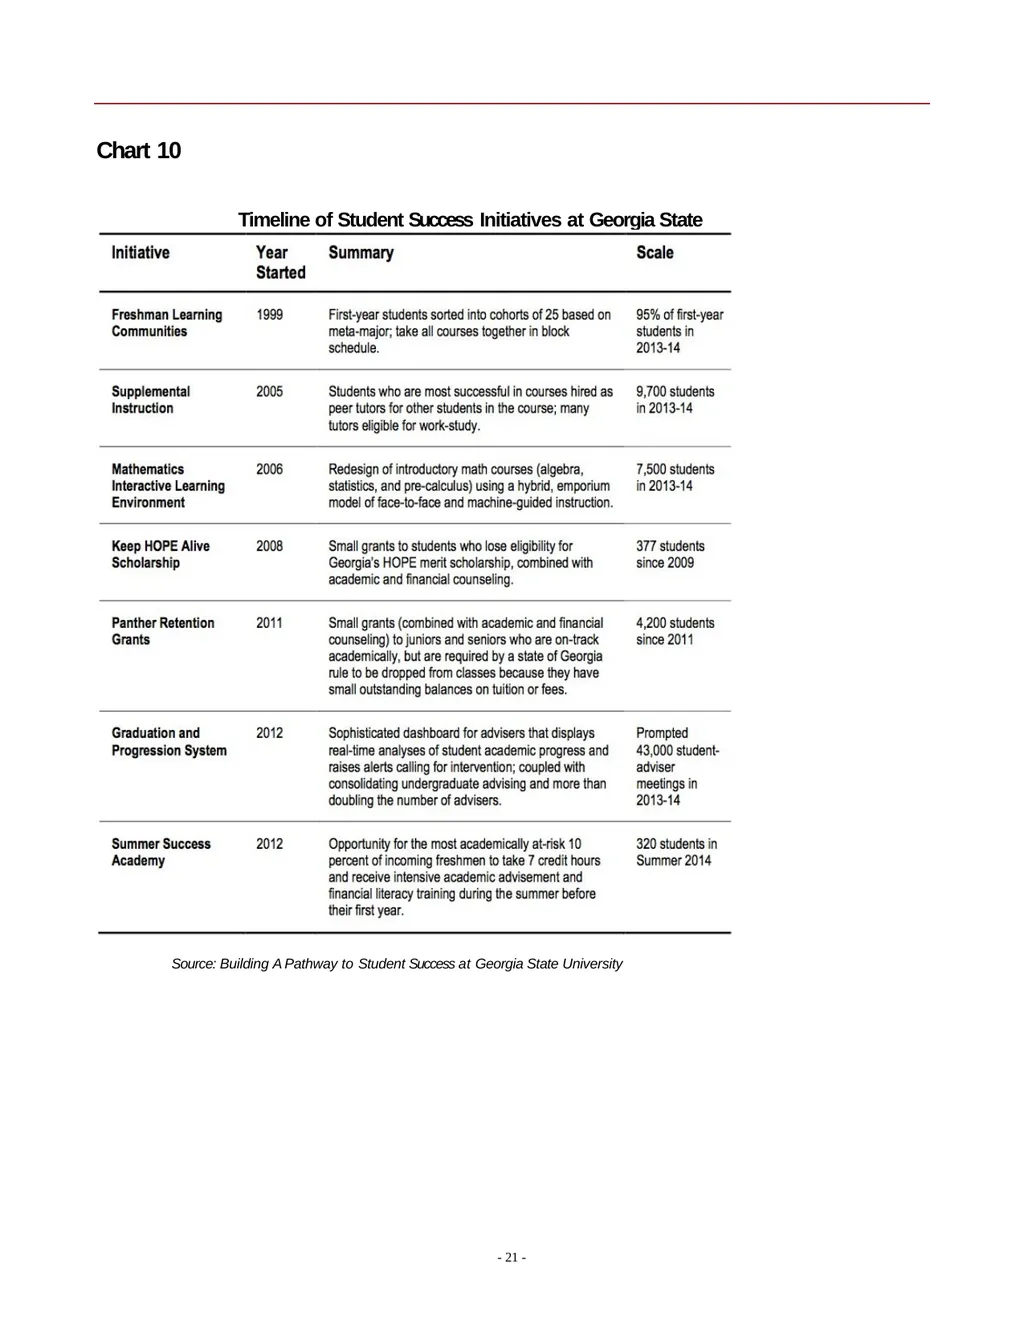
The work we have been doing to promote student success at Georgia State University has steadily increased graduation rates among our traditionally high-risk student populations, but it has also served to foster a culture of student success among faculty, staff, and administration. As the story of Georgia State University demonstrates, institutional transformation in the service of student success does not come about as a result of a single program, but grows from a series of small changes that undergo continue reevaluation and refinement. What it also shows is how a series of initially small initiatives, when scaled over time, can significantly transform an institution’s culture (Chart 10). As we have seen improvements in the success of our students, the campus community has come to be driven by a shared vision.
This process it an iterative and continuous one. In addition to the well-established and high-impact strategies described above, Georgia State University continues to employ data analyses to identify and understand the obstacles that our students are facing, and it continues to test innovative new solutions to facilitate efficient pathways to the attainment of high quality degrees. Here are a few:
Optimizing Course Scheduling using Predictive Analytics
As a result of an analysis conducted by our Office of Institutional Research, we have shifted our course scheduling policy so as to balance faculty preference with other important factors like room availability, student demand, and academic program requirements. We employ the aggregate data that we are collecting on the major maps and progression of each individual student to predict what courses are needed and in what numbers each semester. These efforts are led by a new, university-level Strategic Course Scheduling Committee, with representation from all colleges as well as major functional areas such as the Registrar and advising. As a result of our new policy framework, we expect to see marked improvements in our rates of student progression, along with a resulting decrease in average time and cost per degree and an increase in student satisfaction. With help from Ad Astra, we are implementing a predictive analytics solution that will allow us to consistently execute our new, a scheduling model more conducive to student progression.
Establishing a Financial Counseling Center
In an effort to mitigate the financial risks to student retention that are created by non-academic collegiate expenditures, GSU has used ten years of student financial data and more than 140,000 Georgia state student records to develop predictive analytics identifying when students make financial decisions that put them at risk of attrition. These enhanced predictive analytics include information about student housing choices and past due histories to target students for financial counseling. GSU has been awarded a $2 million gift from SunTrust to implement the model and then diffuse it to other universities. The new center opens fall 2016.
Empowering Students through Mobile Application Development
In collaboration with the Education Advisory Board, GSU has helped to develop and launch a student-facing tool for smart devices that incorporates data analytics to provide students with major and career guidance, best-fit courses and schedules, time management tools, and smart resource recommendations about student support that is relevant to their specific needs. - 14 -<br>
slide15. Scaling Hybrid, Adaptive Learning Courses
Building on our success in the use of adaptive learning technology in introductory mathematics courses, we have received a grant from the Gates Foundation to scale up the use of adaptive technologies in high- enrollment Economics, Psychology and Political Science. By year three of the project, Georgia State will deliver 20,000 seats annually of hybrid, adaptive-learning-assisted classes.
Creating Pathways from College to Career
We are launching a multi-year initiative supported by the Goizueta Foundation to combine the latest data research and student-facing technologies to deliver a four-year program of career development for students from the freshman year through graduation.
Implementing Student Success Programs at Perimeter College
We already have launched at Perimeter College GPS Advising, Panther Retention Grants and several other programs that were pioneered and have proven transformative at the Atlanta campus. We are about to announce a $4.5 million gift to help in the effort to extend a range of eight additional high-impact student- success practices to Georgia State’s Perimeter College.
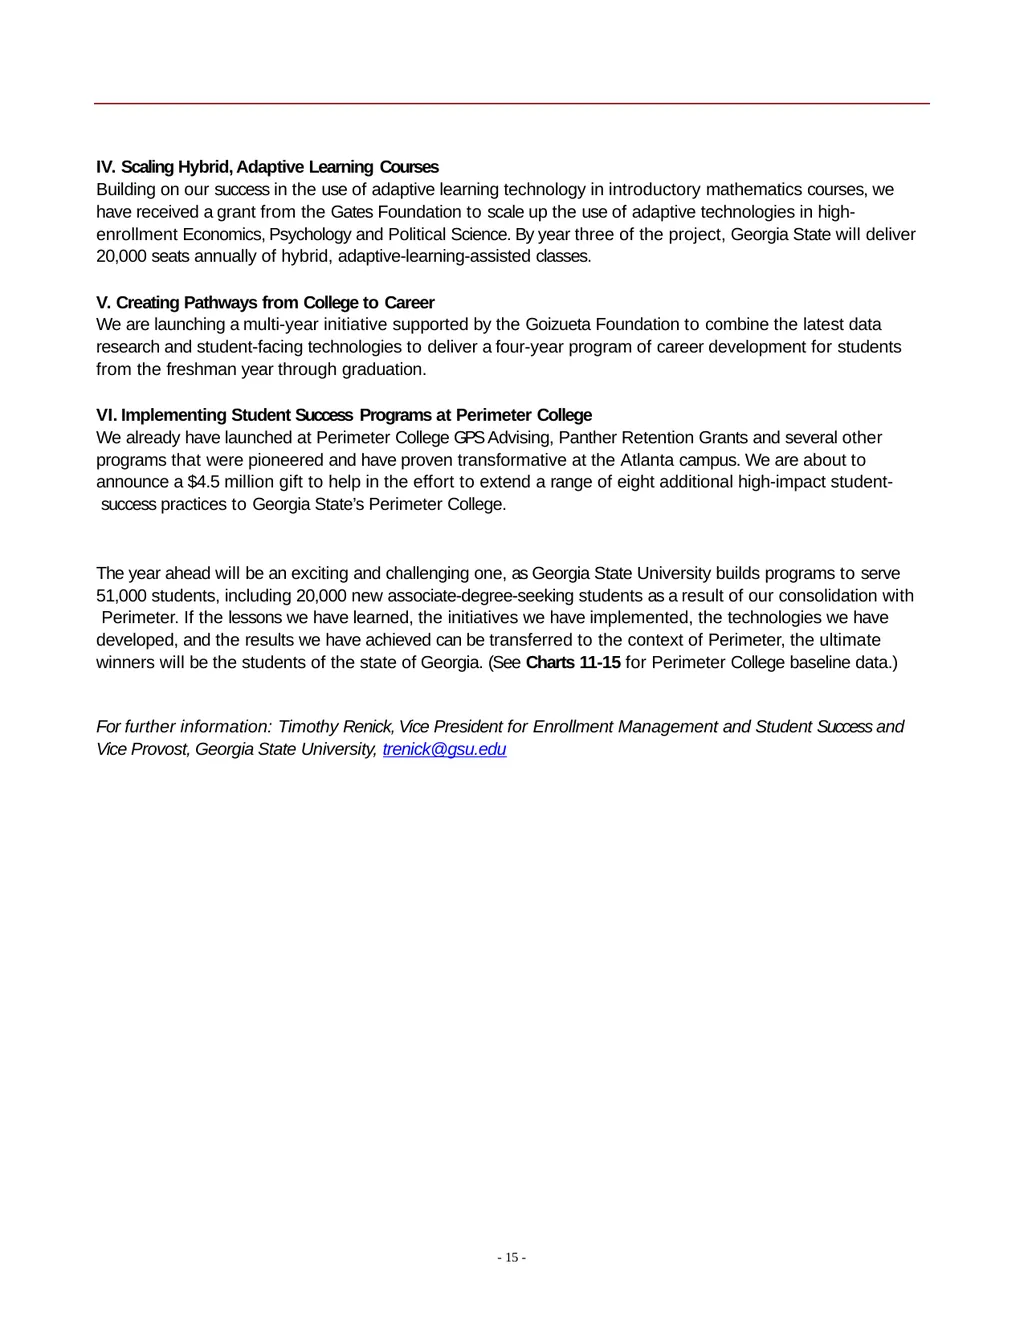
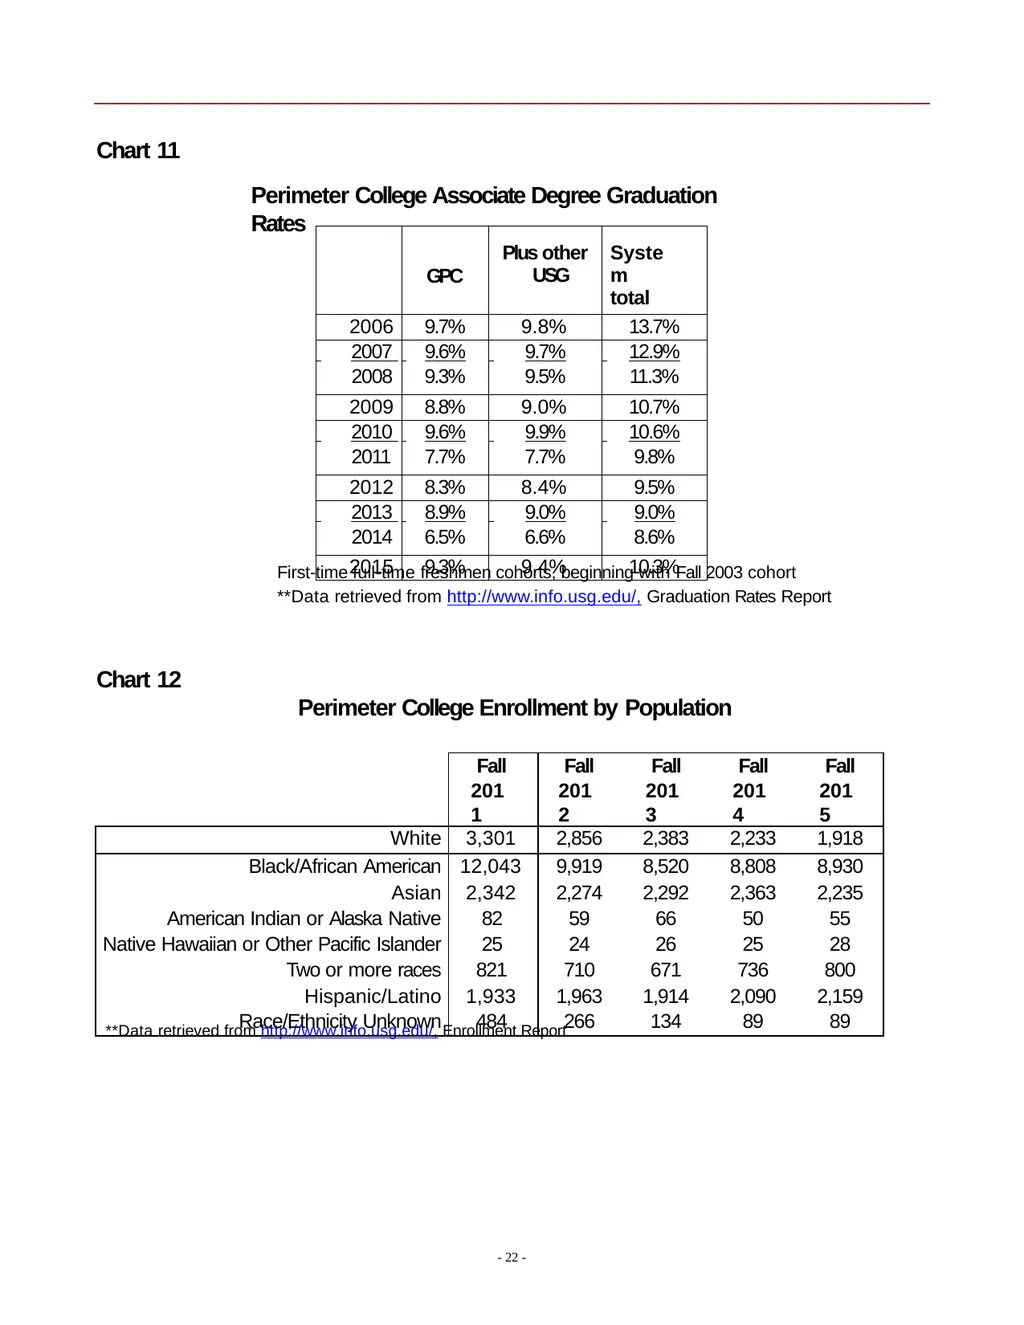
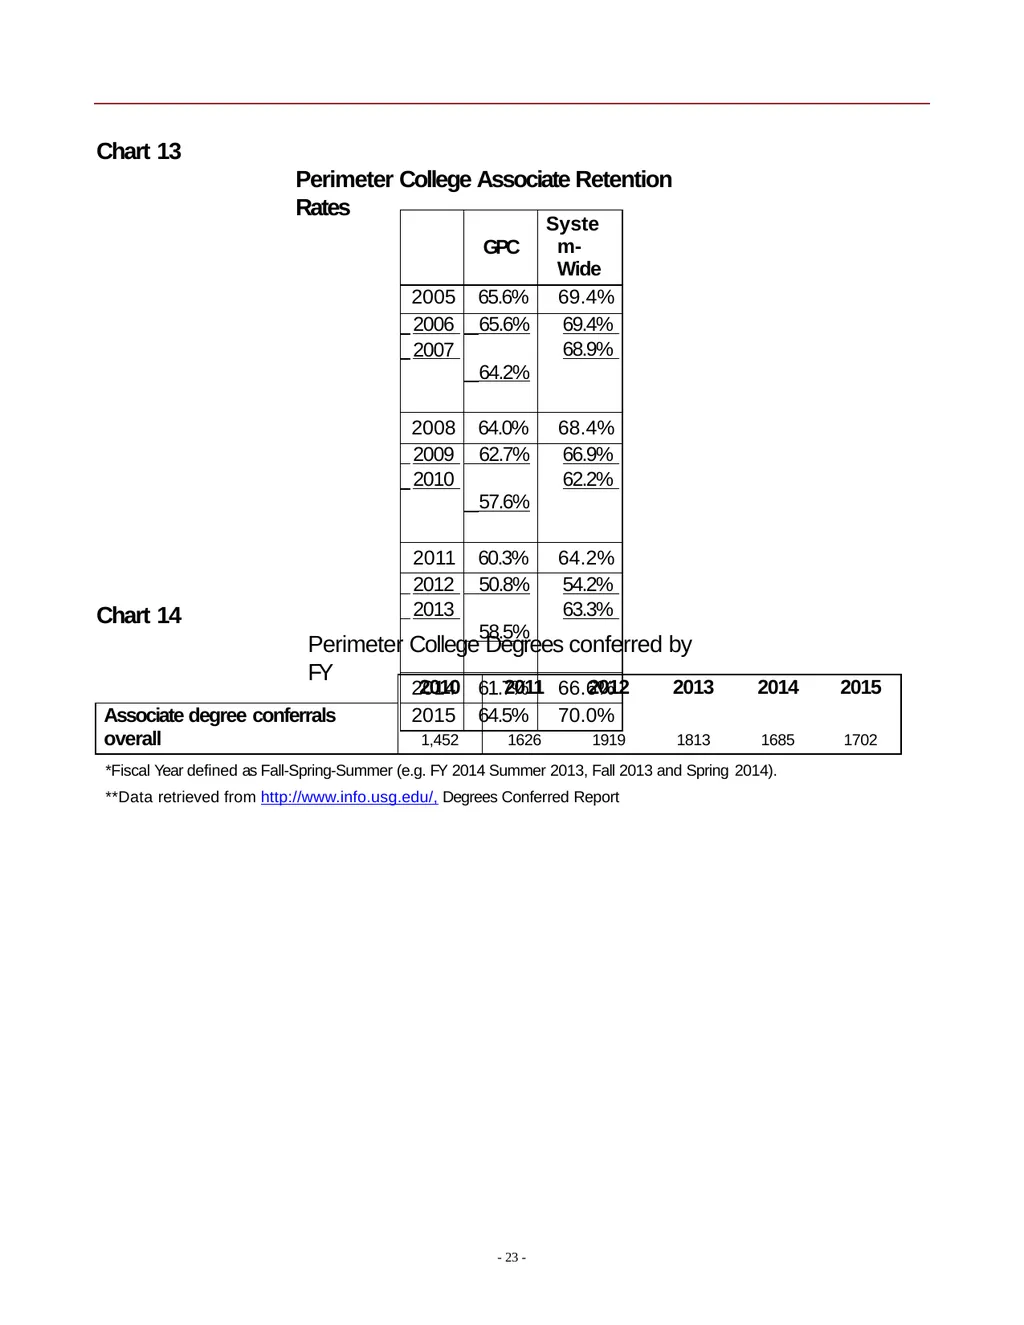
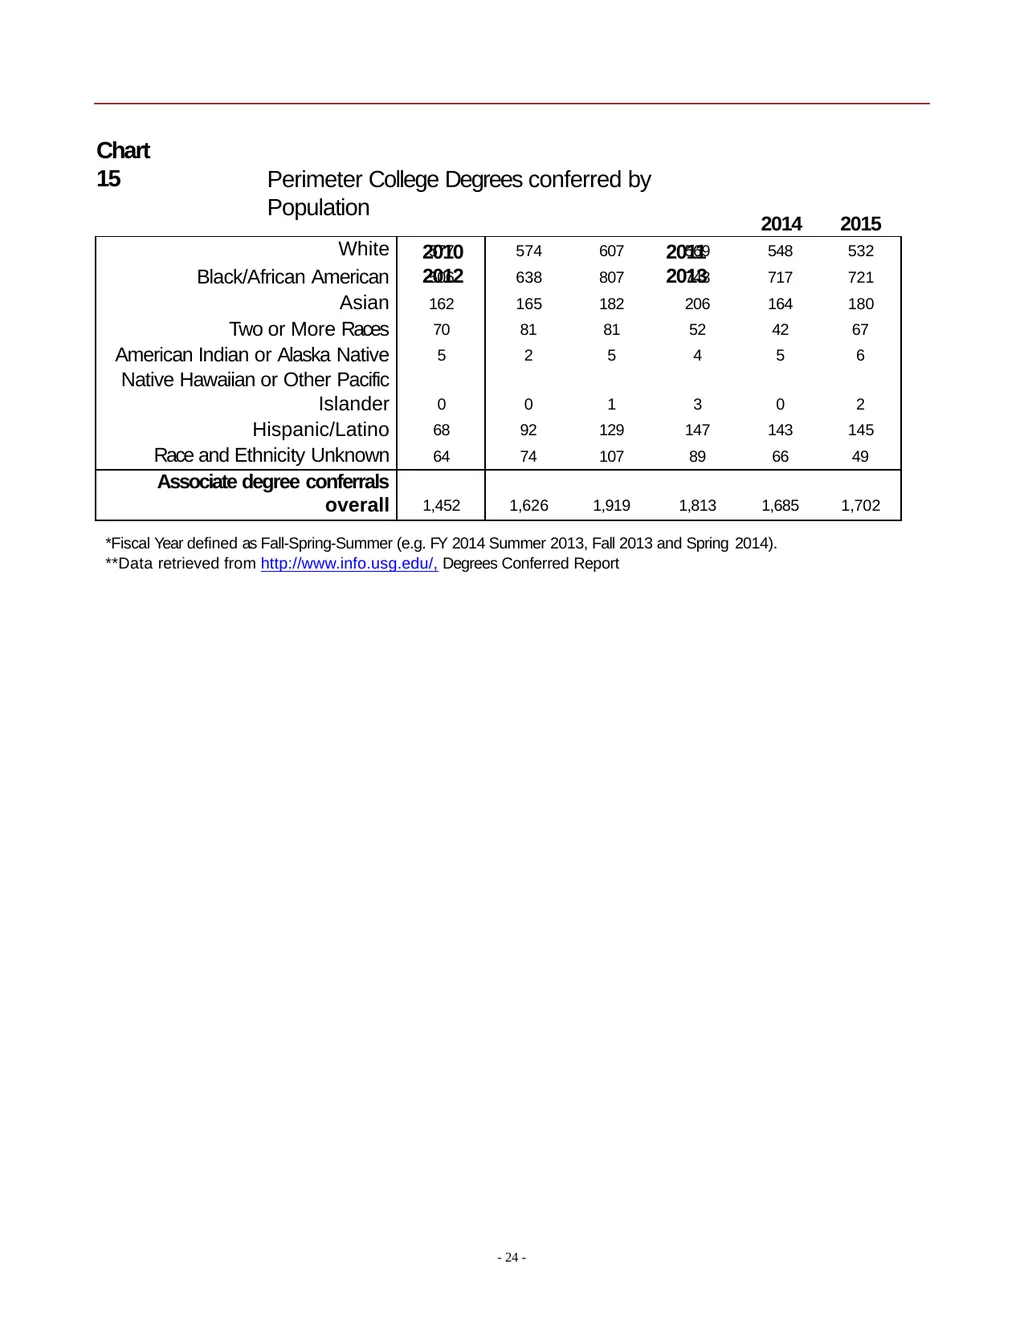
The year ahead will be an exciting and challenging one, as Georgia State University builds programs to serve 51,000 students, including 20,000 new associate-degree-seeking students as a result of our consolidation with Perimeter. If the lessons we have learned, the initiatives we have implemented, the technologies we have developed, and the results we have achieved can be transferred to the context of Perimeter, the ultimate winners will be the students of the state of Georgia. (See Charts 11-15 for Perimeter College baseline data.)
For further information: Timothy Renick, Vice President for Enrollment Management and Student Success and Vice Provost, Georgia State University, trenick@gsu.edu - 15 -<br>
slide16. APPENDIX
Chart 1
GSU Bachelor Degree Graduation Rates by Year
2010 to Present 54% 30% 32% 40% 50% 60% 20%
2003 2004 2005 2006 2007 2008 2009 2010 2011 2012 2013 2014 2015
Chart 2
Georgia State University Bachelor Degree Conferrals
Since Launch of Strategic Plan Supplemental Instruction (SI) Mathematics Interactive Learning Environment (MILE)
Freshman Learning Communities (FLC) Office of Student Success Keep Hope Alive Panther Retention Grants (PRG) University Advisement Center
GPS Advising
Meta Majors - 16 -<br>
slide17. Chart 4
Top Ten National African American Baccalaureate Producers Source: Diverse Issues in Higher Education [1]
* Does not including online universities (i.e. University of Phoenix – Online Campus, Ashford University, University of Maryland-University College) 4,222 4,468 4,784 4,668 4,788 6,770 4,867 7,000
6,500
6,000
5,500
5,000
4,500
4,000
3,500
3,000 2010-11 2011-12 2012-13 2013-14 2014-15 2015-16 Chart 3
Georgia State University Undegraduate Degree Conferrals by Year Since Launch of Strategic Plan Bachelors Only All Undergraduate Degrees - 17 -<br>
slide18. * Pell Data from U.S. New and World Report Fall 2008 Fall 2009 Fall 2010 Fall 2011 Fall 2012 Fall 2013 Fall 2014 Fall 2015 Chart 5
At Risk Undergraduate Student Populations at GSU by Year Fall 2008 - Fall 2015
75%
65%
55%
45%
35%
25% Underrepresented Minority Students Pell Eligible Students - 18 -<br>
slide19. Chart 6 Status Race Ethnicity Chart 7
GSU Bachelor Graduation Rates by Population
2010 to Present - 19 -<br>
slide20. Chart 9
6 Year Bachelor Graduation Rates Among First Time First Year Freshman who Started at Georgia State University 140 140 138
135
133 2009-10 2010-11 2011-12 2012-13 2013-14 2014-15 2015-16 Chart 8
Credit Hours at Completion: Bachelor Students
141 141 33.3% 49.9%
37.4% 75.9% 76.9%
58.2%
39.2% 79.7%
57.6% 90.0%
80.0%
70.0%
60.0%
50.0%
40.0%
30.0%
20.0%
10.0%
0.0% White African American Hispanic
Ten Years Ago*** Today (2015) Today (2015), with National Student Clearinghouse Added - 20 -<br>
slide21. Chart 10
Timeline of Student Success Initiatives at Georgia State University Source: Building A Pathway to Student Success at Georgia State University - 21 -<br>
slide22. Chart 11
Perimeter College Associate Degree Graduation Rates - 22 - First-time full-time freshmen cohorts, beginning with Fall 2003 cohort
**Data retrieved from http://www.info.usg.edu/, Graduation Rates Report
Chart 12
Perimeter College Enrollment by Population **Data retrieved from http://www.info.usg.edu/, Enrollment Report<br>
slide23. Chart 13
Perimeter College Associate Retention Rates - 23 - Chart 14
Perimeter College Degrees conferred by FY *Fiscal Year defined as Fall-Spring-Summer (e.g. FY 2014 Summer 2013, Fall 2013 and Spring 2014).
**Data retrieved from http://www.info.usg.edu/, Degrees Conferred Report<br>
slide24. Chart 15 - 24 - Perimeter College Degrees conferred by Population
2010 2011 2012 2013 2014 2015 *Fiscal Year defined as Fall-Spring-Summer (e.g. FY 2014 Summer 2013, Fall 2013 and Spring 2014).
**Data retrieved from http://www.info.usg.edu/, Degrees Conferred Report<br>
Georgia State University Complete College Georgia<br>
slide2. Overview
When it comes to higher education, the vision of the United States as a land of equal opportunity is far from a reality. Today, it is eight times more likely that an individual in the top quartile of Americans by annual household income will hold a college degree than an individual in the lowest quartile.1 Nationally, white students graduate from college at rates more than 10 points higher than Hispanic students, and are more than twice as likely to graduate with a 4-year college degree compared to black students.2 The United States Department of Education cites a six-year graduation-rate of 39% among Pell-eligible students,3 a rate that is 20 points lower than the national average.4
In 2003, Georgia State’s institutional graduation rate stood at 32% and underserved populations were foundering. Graduation rates were 22% for Latinos, 29% for African Americans, and 18% for African American males. Pell students were graduating at rates far below those of non-Pell students.
Today, thanks to a campus-wide commitment to student success and more than a dozen strategic programs implemented over the past several years, Georgia State’s achievement gap is gone. The graduation rate for bachelor-degree seeking students has improved 22 points—among the highest increases in the nation over this period (Chart 1). (See Appendix for all charts.) Rates are up 36 points for Latinos (to 58%), and 29 points for African Americans (to 58%). Pell-eligible students currently represent 58% of Georgia State University’s undergraduate student population, and over the past three years have graduated at rates, on average, equal to those of non-Pell students. In fact, this past year, African-American, Hispanic, first-generation and Pell- eligible students all graduated from Georgia State at rates at our above those of the student body overall— making Georgia State the only national public university to achieve this goal.
Georgia State also continues to set new records for degrees conferred. With the consolidation with Perimeter College, the university awarded a total of 6,569 undergraduate degrees over the 2015-2016 academic year. The university established new records for total bachelor degrees awarded (4,867), as well as bachelor degrees awarded to Pell-eligible (2,829), black (1,8925), Hispanic (433), and first-generation (1,176) students (Charts 2 and 3). Despite steep declines in Perimeter enrollments over the past three years, associate degree conferrals were also up (1,702). Georgia State now graduates more Hispanic, Asian, first generation, and Pell students with bachelor degrees than any other university in Georgia. For four consecutive years, we have conferred more bachelor degrees to African Americans than any other non-profit college or university in the United States (Chart 4).
1 The Pell Institute (2015) Indicators of Higher Education Equity in the United States : 45 Year Trend Report (2015 Revised Edition). Retrieved from http://www.pellinstitute.org/downloads/publications- Indicators_of_Higher_Education_Equity_in_the_US_45_Year_Trend_Report.pdf
2 U.S. Department of Education. Institute of Education Sciences, National Center for Education Statistics (2014) Table 326.10: Graduation rate from first institution attended for first-time, full-time bachelor's degree- seeking students at 4- year postsecondary institutions, by race/ethnicity, time to completion, sex, control of institution, and acceptance rate: Selected cohort entry years, 1996 through 2007. Retrieved from https://nces.ed.gov/programs/digest/d14/tables/dt14_326.10.asp.
3 Horwich, Lloyd (25 November 2015) Report on the Federal Pell Grant Program. Retrieved from http://www.nasfaa.org/uploads/documents/Pell0212.pdf.
4 U.S. Department of Education. Institute of Education Sciences, National Center for Education Statistics (2014) Table 326.10.<br>
slide3. I. Institutional Mission and Student Body Profile
Since the launch of its current Strategic Plan in 2011, Georgia State University has seen a 16% increase in its number of undergraduate degree conferrals, with even stronger gains made with at-risk student populations. Over the past five years, bachelor degree conferrals are up 37% for African Americans, 36% for Pell students, and 44% for Hispanics.
These gains have been the subject of growing levels of national attention:
In December 2014, President Barak Obama lauded the exemplary work being done at Georgia State University to assist low-income students through its Panther Retention Grant program in his address at White House Opportunity Day.5
In January 2015, Georgia State received the Institutional Transformation Award from the American Council on Education (ACE), the largest organization for post-secondary education in the nation. Citing Georgia State’s exceptional progress in the area of student success and its elimination of all achievement gaps, ACE granted the award for only the second time in its history. (The first award went to Arizona State.)
In August 2015, Georgia State was invited to provide expert testimony on innovations in increasing student success before the United State Senate.
In September 2015, Georgia State was awarded a $9 million grant from the Department of Education to lead a 4-year study to track the impact of analytics-based proactive advisement on 10,000 low- income and first-generation college students nationally.
In its annual national rankings released August 2016, U.S. News and World Report ranked Georgia State 14th in the nation for its Commitment to Undergraduate Teaching and named it the 4th Most Innovative University in the nation. Its First-Year Experience and Freshman Learning Community programs were both listed among the Top 15 in the nation.
Motivated by a desire to make an impact, not only in the lives of its own students, but also in the lives of students nation-wide, Georgia State University has made a conscious and significant commitment of time and resources to sharing the lessons that we have learned. Over the past two years, Georgia State has hosted teams from almost 200 colleges and universities that sought to learn more about Georgia State programs, including institutions from Holland, Australia, New Zealand, and South Africa. I. Institutional Mission and Student Body Profile
Georgia State University now enrolls more African Americans, Latinos, Asian Americans, first-generation students, and Pell students than any college or university Georgia. In fact, the University set new records for the number of bachelor-degree-seeking students enrolled in every one of these categories in 2015. With Georgia State’s January 2016 consolidation with Georgia Perimeter College, the study body has become even more remarkable. Georgia State University now enrolls 51,000 students including, for the first time, 20,000 5 President Barak Obama (4 December 2014) Remarks by the President at College Opportunity Summit. Retrieved from https://www.whitehouse.gov/the-press-office/2014/12/04/remarks-president-college-opportunity-summit. - 3 -<br>
slide4. I. Institutional Mission and Student Body Profile
students pursuing associate degrees on its five Perimeter College campuses. This means that approximately one out of every six students in the entire University System of Georgia this past spring was enrolled at Georgia State. This number includes an amazing 27,000 Pell students. (As a comparison, the entire Ivy League last year enrolled 9,800 Pell students.) We now enroll more than 19,000 African Americans per semester (25% of the USG total enrollment of African American students) and 4,200 Hispanic students (22% of the USG total) (Chart 5). According to U.S. News and World Report, even prior to consolidation, Georgia State University is one of only two universities to rank in the Top 15 in the nation for both its racial/ethnic diversity6 and for the number of low-income students enrolled.7
The most foundational principle guiding our efforts has been a pledge to improve student outcomes through inclusion rather exclusion. In the 2011 Georgia State University Strategic Plan, we committed ourselves to improve our graduation rates significantly, but not by turning our backs on the low-income, underrepresented and first-generation students that we have traditionally served. To the contrary: we pledged to increase the number of underrepresented, first-generation and Pell students enrolled and to serve them better. We committed to achieving improved outcomes for our students not merely at Georgia State but in their lives and careers after graduation. The consolidation with Perimeter College and its tens of thousands of students who fall into federal at-risk categories is the latest example of this deep commitment.
The central goal that we have set for our undergraduate success efforts is highly ambitious, but the words were carefully chosen: Georgia State would
“become a national model for undergraduate education by demonstrating that students from all backgrounds can achieve academic and career success at high rates”8
Our goals included a commitment to raise overall institutional graduation rates and degree conferrals by significant margins—graduation rates for bachelor-seeking students would climb 13 points and undergraduate degree completions would increase by 2,500 by 2021—and to closing all achievement gaps between our student populations. As outlined in this update, we have made great strides already.
The Strategic Plan also outlined key strategies to achieve these goals. We made a commitment to overhaul our advising system, to track every student daily with the use of predictive analytics and to intervene with students who are at risk in a proactive fashion, to expand existing high-impact programs such as freshman learning communities and Keep Hope Alive, to raise more scholarship dollars, and to pilot and scale innovative new types of financial interventions. These programs and their impacts are outlined in the next section. 6 U.S. News & World Report (n.d.) Campus Ethnic Diversity: National Universities. Retrieved from http://colleges.usnews.rankingsandreviews.com/best-colleges/rankings/national-universities/campus-ethnic-diversity. 7 U.S. News & World Report (n.d.) Economic Diversity: National Universities. Retrieved
http://colleges.usnews.rankingsandreviews.com/best-colleges/rankings/national-universities/economic-diversity. 8 Georgia State University (2012). Strategic Plan 2011-2016/21. Retrieved from http://strategic.gsu.edu/files/2012/09/GSU_Strategic_Plan_2016-2.pdf - 4 -<br>
slide5. Institutional Completion Goals, High-Impact Strategies and Activities
Institutional Completion Goals and Results
In 2011, Georgia State University committed to reach a graduation rate for bachelor-degree-seeking students of 52% by 2016 and 60% by 2021.9 We also committed to conferring 2,500 more degrees annually than we did in 2010 and to eliminating all significant achievement gaps between student populations. We now have committed to doubling the graduation rate of our new associate-degree seeking students from the 2014 baseline over the next five years.
On the surface, attaining these goals seems implausible. Georgia State’s demographic trends—characterized by huge increases in the enrollments of at-risk students in recent years—typically would project a steep decline in student outcomes. Georgia State University, though, has been able to make dramatic gains towards its success targets even as the student body has become more financially distressed. Aided by the consolidation with Perimeter College, the 6,569 undergraduate degrees conferred during the 2015-2016 academic year represent a 2,347-degree increase (56%) over the baseline year of 2011 (Chart 3). The gains have been greatest for a number of at-risk student populations.
In the 2014-2015 academic year, Georgia State University conferred record numbers of bachelor degrees to Pell-eligible, first generation, Black or African American, and Hispanic students (Chart 6). Since the 2010-2011 academic year, the number of bachelor degrees conferred to Pell students by 33% while conferral to African American students has increased by 42% and to Hispanic students has increased by 52%.10 (See Chart 7.) Time to degree is also down markedly—by more than half a semester per students since 2011—saving the graduating class of 2016 approximately $12 million in tuition and fees compared to their colleagues just three years earlier (Chart 8).
Since the launch of Georgia State University’s current strategic plan, and the start of our participation in Complete College Georgia, our institutional graduation rate for bachelor-degree-seeking students has increased by 6 percentage points to a record 54% (Charts 1, 7). Early indications are that, in the first two semesters after consolidation, graduation rates for associate-degree-seeking students are also making significant gains.
It is important to note that low-income and first-generation students’ families move frequently due to changes in jobs and economic circumstances when compared to middle- and upper-class college students. This phenomenon significantly impacts Georgia State’s institutional graduation rates. Using National Student Clearinghouse data to track Georgia State’s most recent 6-year bachelor-seeking cohort across all universities nationally, the success rates are even more encouraging. For the current year, a record 76.8% of the students who started at Georgia State six years ago have either graduated from Georgia State or some other institution Georgia State University (2012) College Completion Plan 2012: A University-wide Plan for Student Success (The Implementation of Goal 1 of the GSU Strategic Plan). Retrieved from http://enrollment.gsu.edu/wp- content/blogs.dir/57/files/2013/09/GSU_College_Completion_Plan_09-06-12.pdf
Actual percent increases were much higher in these two categories, but we have controlled for the effects of the University implementing more rigorous processes encouraging students to self-report their race and ethnicity.<br>
slide6. or are still actively enrolled in college. The numbers for African American (77%) and Latino (80%) students in this category are even higher (Chart 9).
This combination of large increases in Pell enrollments and significantly rising graduation rates confounds the conventional wisdom. Nationally, one can track a strong correlation between increases in Pell rates and decreases in graduation rates. Georgia State’s completion efforts have made us a clear outlier nationally. In fact, among all of our peer institutions as defined by the BOR, Georgia State now has both the highest Pell rates and the highest graduation rates.
B. High Impact Strategies
1. GPS Advising - 6 -<br>
slide7. 2. Summer Success Academy High-impact strategy Use predictive analytics to identify admitted students for the fall freshman class who are academically at-risk and require that these students attend a seven-week summer session before fall classes. - 7 -<br>
slide8. - 8 -<br>
slide9. - 9 - 3. Panther Retention Grants<br>
slide10. 4. Keep Hope Alive (KHA) High-impact strategy With 59% of Georgia State students coming from Pell-eligible households (where the annual household income last year was less than $30,000), the Hope scholarship can be a mixed blessing. The $6,000+ scholarship provides access to college for thousands of Georgia State students, but for the student who does not maintain a 3.0 college GPA, the loss of Hope often means the student has to drop out for financial reasons. In 2008, the graduation rates for students who lose the Hope scholarship were only 20%, 40-points lower than the rates for those who hold on to it. Gaining the Hope Scholarship back after losing it is a statistical longshot: only about 9% of Georgia State students pull this off. Keep Hope Alive provides a $500 stipend for two semesters to students who have lost Hope as an incentive for them to follow a rigorous academic - 10 -<br>
slide11. - 11 -<br>
slide12. - 12 - 5. Meta-Majors<br>
slide13. Observations
Georgia State University is testimony to the fact that students from all backgrounds can succeed at high rates. Moreover, our efforts over the past few years show that dramatic gains are indeed possible—not through changing the nature of the students served but through changing the nature of the institution that serves them. How has Georgia State University made the gains outlined above? How do we propose to reach our ambitious future targets? In one sense, the answer is simple. We employ a consistent, evidenced-based strategy. Our general approach can be summarized as follows:
Use data aggressively in order to identify and to understand the most pervasive obstacles to our students’ progressions and completion. - 13 -<br>
slide14. Be willing to address the problems by becoming an early adopter. This means piloting new strategies and experimenting with new technologies. After all, we will not solve decades-old problems by the same old means.
Track the impacts of the new interventions via data and make adjustments as necessary to improve results.
Scale the initiatives that prove effective to have maximal impact. In fact, many of the programs that we offer are currently touching 10,000 students or more annually.
The work we have been doing to promote student success at Georgia State University has steadily increased graduation rates among our traditionally high-risk student populations, but it has also served to foster a culture of student success among faculty, staff, and administration. As the story of Georgia State University demonstrates, institutional transformation in the service of student success does not come about as a result of a single program, but grows from a series of small changes that undergo continue reevaluation and refinement. What it also shows is how a series of initially small initiatives, when scaled over time, can significantly transform an institution’s culture (Chart 10). As we have seen improvements in the success of our students, the campus community has come to be driven by a shared vision.
This process it an iterative and continuous one. In addition to the well-established and high-impact strategies described above, Georgia State University continues to employ data analyses to identify and understand the obstacles that our students are facing, and it continues to test innovative new solutions to facilitate efficient pathways to the attainment of high quality degrees. Here are a few:
Optimizing Course Scheduling using Predictive Analytics
As a result of an analysis conducted by our Office of Institutional Research, we have shifted our course scheduling policy so as to balance faculty preference with other important factors like room availability, student demand, and academic program requirements. We employ the aggregate data that we are collecting on the major maps and progression of each individual student to predict what courses are needed and in what numbers each semester. These efforts are led by a new, university-level Strategic Course Scheduling Committee, with representation from all colleges as well as major functional areas such as the Registrar and advising. As a result of our new policy framework, we expect to see marked improvements in our rates of student progression, along with a resulting decrease in average time and cost per degree and an increase in student satisfaction. With help from Ad Astra, we are implementing a predictive analytics solution that will allow us to consistently execute our new, a scheduling model more conducive to student progression.
Establishing a Financial Counseling Center
In an effort to mitigate the financial risks to student retention that are created by non-academic collegiate expenditures, GSU has used ten years of student financial data and more than 140,000 Georgia state student records to develop predictive analytics identifying when students make financial decisions that put them at risk of attrition. These enhanced predictive analytics include information about student housing choices and past due histories to target students for financial counseling. GSU has been awarded a $2 million gift from SunTrust to implement the model and then diffuse it to other universities. The new center opens fall 2016.
Empowering Students through Mobile Application Development
In collaboration with the Education Advisory Board, GSU has helped to develop and launch a student-facing tool for smart devices that incorporates data analytics to provide students with major and career guidance, best-fit courses and schedules, time management tools, and smart resource recommendations about student support that is relevant to their specific needs. - 14 -<br>
slide15. Scaling Hybrid, Adaptive Learning Courses
Building on our success in the use of adaptive learning technology in introductory mathematics courses, we have received a grant from the Gates Foundation to scale up the use of adaptive technologies in high- enrollment Economics, Psychology and Political Science. By year three of the project, Georgia State will deliver 20,000 seats annually of hybrid, adaptive-learning-assisted classes.
Creating Pathways from College to Career
We are launching a multi-year initiative supported by the Goizueta Foundation to combine the latest data research and student-facing technologies to deliver a four-year program of career development for students from the freshman year through graduation.
Implementing Student Success Programs at Perimeter College
We already have launched at Perimeter College GPS Advising, Panther Retention Grants and several other programs that were pioneered and have proven transformative at the Atlanta campus. We are about to announce a $4.5 million gift to help in the effort to extend a range of eight additional high-impact student- success practices to Georgia State’s Perimeter College.
The year ahead will be an exciting and challenging one, as Georgia State University builds programs to serve 51,000 students, including 20,000 new associate-degree-seeking students as a result of our consolidation with Perimeter. If the lessons we have learned, the initiatives we have implemented, the technologies we have developed, and the results we have achieved can be transferred to the context of Perimeter, the ultimate winners will be the students of the state of Georgia. (See Charts 11-15 for Perimeter College baseline data.)
For further information: Timothy Renick, Vice President for Enrollment Management and Student Success and Vice Provost, Georgia State University, trenick@gsu.edu - 15 -<br>
slide16. APPENDIX
Chart 1
GSU Bachelor Degree Graduation Rates by Year
2010 to Present 54% 30% 32% 40% 50% 60% 20%
2003 2004 2005 2006 2007 2008 2009 2010 2011 2012 2013 2014 2015
Chart 2
Georgia State University Bachelor Degree Conferrals
Since Launch of Strategic Plan Supplemental Instruction (SI) Mathematics Interactive Learning Environment (MILE)
Freshman Learning Communities (FLC) Office of Student Success Keep Hope Alive Panther Retention Grants (PRG) University Advisement Center
GPS Advising
Meta Majors - 16 -<br>
slide17. Chart 4
Top Ten National African American Baccalaureate Producers Source: Diverse Issues in Higher Education [1]
* Does not including online universities (i.e. University of Phoenix – Online Campus, Ashford University, University of Maryland-University College) 4,222 4,468 4,784 4,668 4,788 6,770 4,867 7,000
6,500
6,000
5,500
5,000
4,500
4,000
3,500
3,000 2010-11 2011-12 2012-13 2013-14 2014-15 2015-16 Chart 3
Georgia State University Undegraduate Degree Conferrals by Year Since Launch of Strategic Plan Bachelors Only All Undergraduate Degrees - 17 -<br>
slide18. * Pell Data from U.S. New and World Report Fall 2008 Fall 2009 Fall 2010 Fall 2011 Fall 2012 Fall 2013 Fall 2014 Fall 2015 Chart 5
At Risk Undergraduate Student Populations at GSU by Year Fall 2008 - Fall 2015
75%
65%
55%
45%
35%
25% Underrepresented Minority Students Pell Eligible Students - 18 -<br>
slide19. Chart 6 Status Race Ethnicity Chart 7
GSU Bachelor Graduation Rates by Population
2010 to Present - 19 -<br>
slide20. Chart 9
6 Year Bachelor Graduation Rates Among First Time First Year Freshman who Started at Georgia State University 140 140 138
135
133 2009-10 2010-11 2011-12 2012-13 2013-14 2014-15 2015-16 Chart 8
Credit Hours at Completion: Bachelor Students
141 141 33.3% 49.9%
37.4% 75.9% 76.9%
58.2%
39.2% 79.7%
57.6% 90.0%
80.0%
70.0%
60.0%
50.0%
40.0%
30.0%
20.0%
10.0%
0.0% White African American Hispanic
Ten Years Ago*** Today (2015) Today (2015), with National Student Clearinghouse Added - 20 -<br>
slide21. Chart 10
Timeline of Student Success Initiatives at Georgia State University Source: Building A Pathway to Student Success at Georgia State University - 21 -<br>
slide22. Chart 11
Perimeter College Associate Degree Graduation Rates - 22 - First-time full-time freshmen cohorts, beginning with Fall 2003 cohort
**Data retrieved from http://www.info.usg.edu/, Graduation Rates Report
Chart 12
Perimeter College Enrollment by Population **Data retrieved from http://www.info.usg.edu/, Enrollment Report<br>
slide23. Chart 13
Perimeter College Associate Retention Rates - 23 - Chart 14
Perimeter College Degrees conferred by FY *Fiscal Year defined as Fall-Spring-Summer (e.g. FY 2014 Summer 2013, Fall 2013 and Spring 2014).
**Data retrieved from http://www.info.usg.edu/, Degrees Conferred Report<br>
slide24. Chart 15 - 24 - Perimeter College Degrees conferred by Population
2010 2011 2012 2013 2014 2015 *Fiscal Year defined as Fall-Spring-Summer (e.g. FY 2014 Summer 2013, Fall 2013 and Spring 2014).
**Data retrieved from http://www.info.usg.edu/, Degrees Conferred Report<br>