04
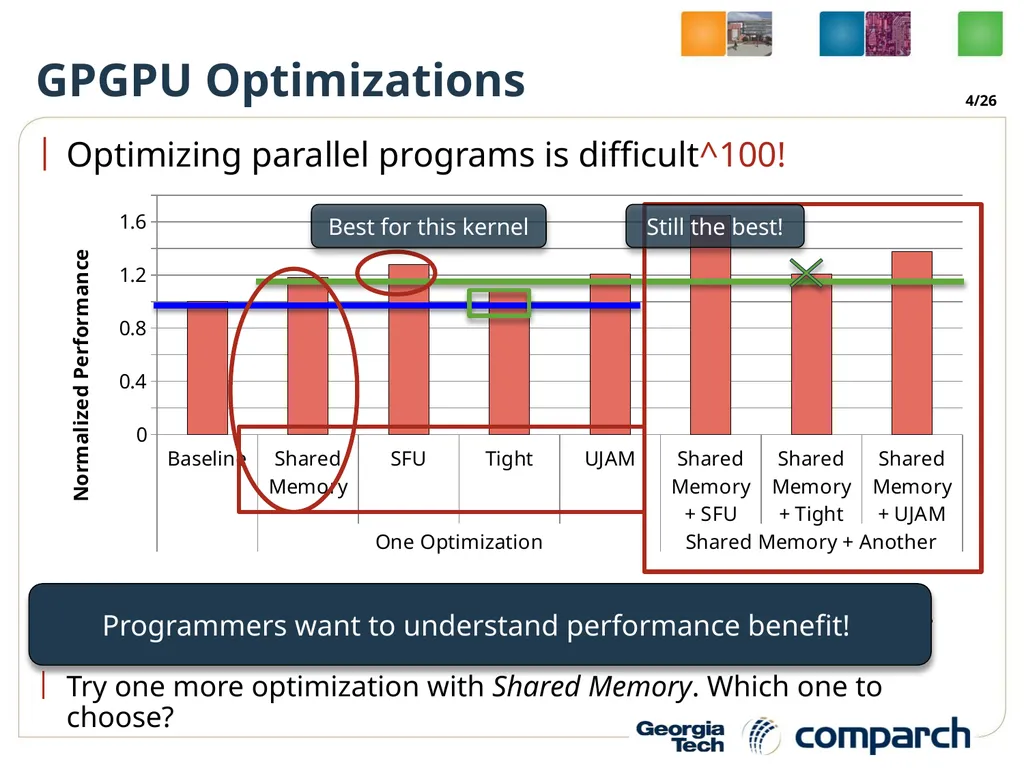
GPGPU Optimizations Optimizing parallel programs is difficult^100!
Most of programmers apply optimization techniques one by one.
Try one more optimization with Shared Memory. Which one to choose? 4/26 Best for this kernel Still the best! Programmers want to understand performance benefit!<br>
05
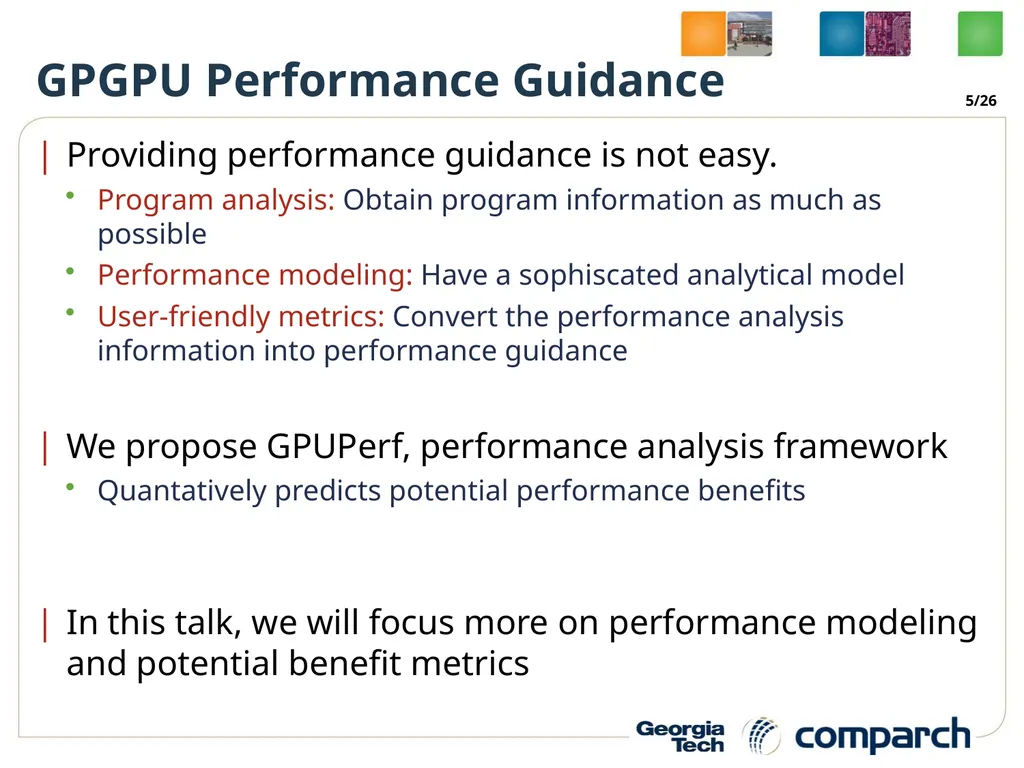
GPGPU Performance Guidance Providing performance guidance is not easy.
Program analysis: Obtain program information as much as possible
Performance modeling: Have a sophiscated analytical model
User-friendly metrics: Convert the performance analysis information into performance guidance
We propose GPUPerf, performance analysis framework
Quantatively predicts potential performance benefits
In this talk, we will focus more on performance modeling and potential benefit metrics 5/26<br>
06
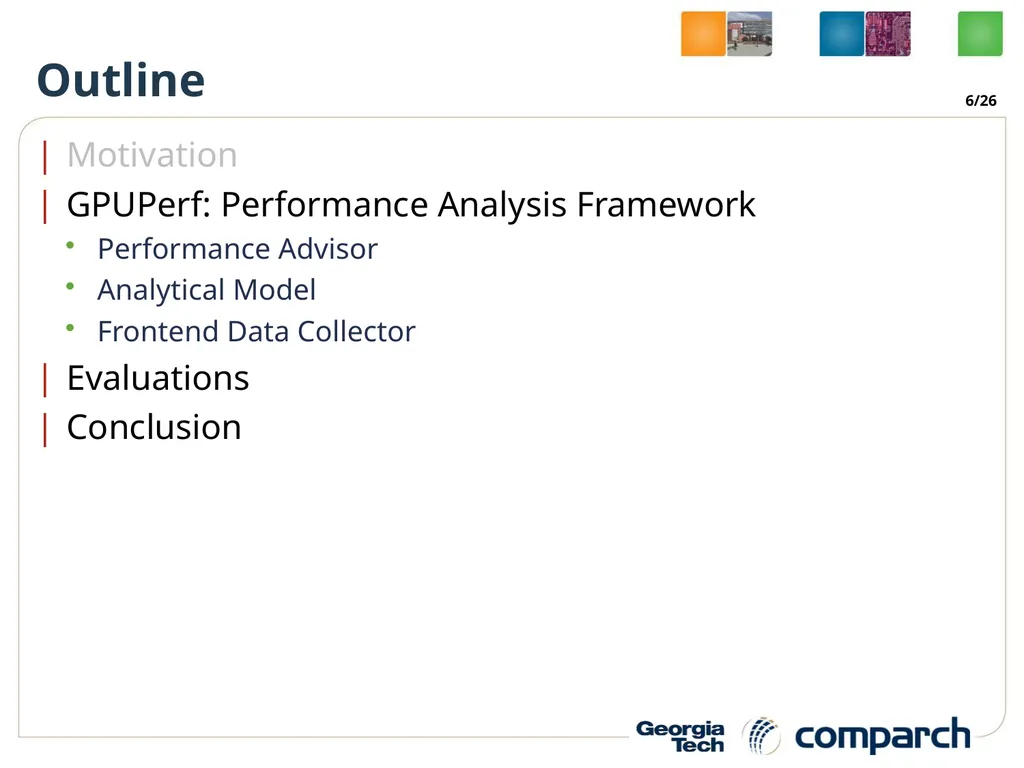
Outline Motivation
GPUPerf: Performance Analysis Framework
Performance Advisor
Analytical Model
Frontend Data Collector
Evaluations
Conclusion 6/26<br>
07
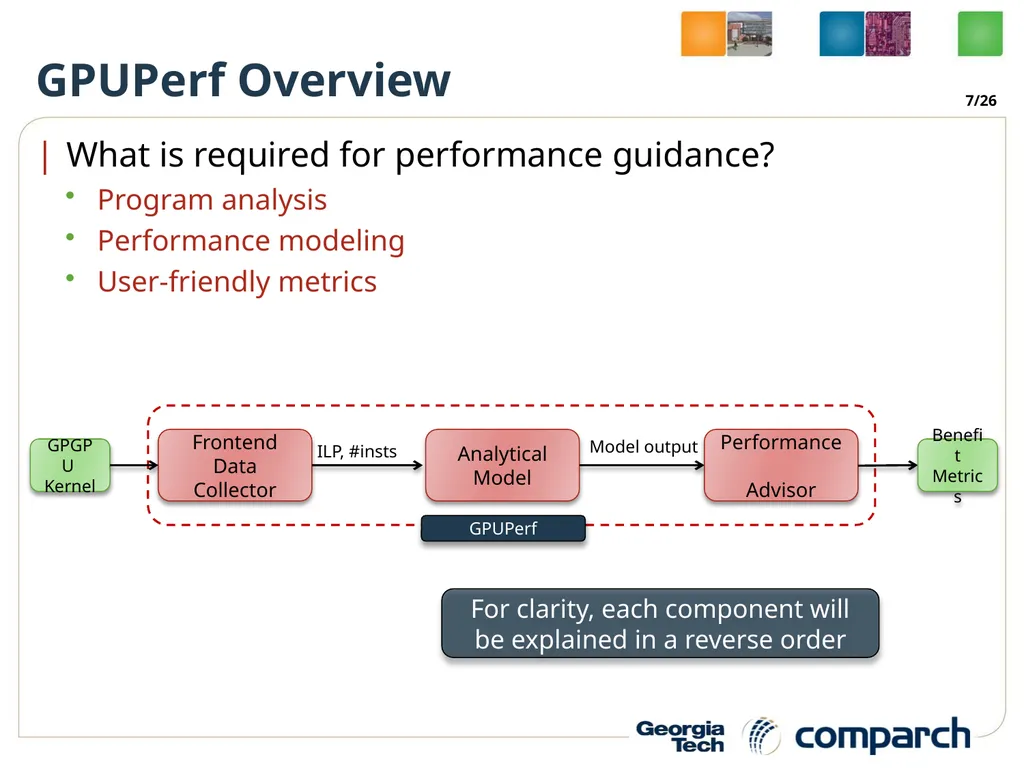
What is required for performance guidance?
Program analysis
Performance modeling
User-friendly metrics GPGPU �Kernel GPUPerf Overview Frontend
Data Collector Analytical
Model Performance �Advisor GPUPerf 7/26 ILP, #insts Model output Benefit
Metrics For clarity, each component will be explained in a reverse order<br>
08
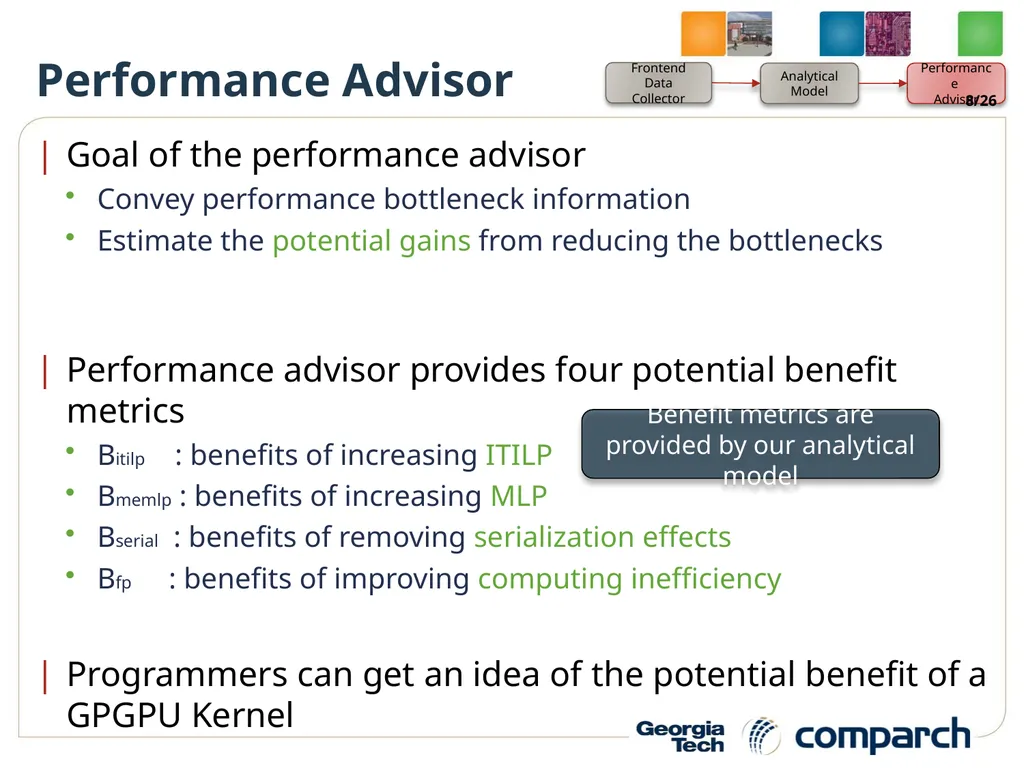
Performance Advisor Goal of the performance advisor
Convey performance bottleneck information
Estimate the potential gains from reducing the bottlenecks
Performance advisor provides four potential benefit metrics
Bitilp : benefits of increasing ITILP
Bmemlp : benefits of increasing MLP
Bserial : benefits of removing serialization effects
Bfp : benefits of improving computing inefficiency
Programmers can get an idea of the potential benefit of a GPGPU Kernel Benefit metrics are provided by our analytical model 8/26<br>
09
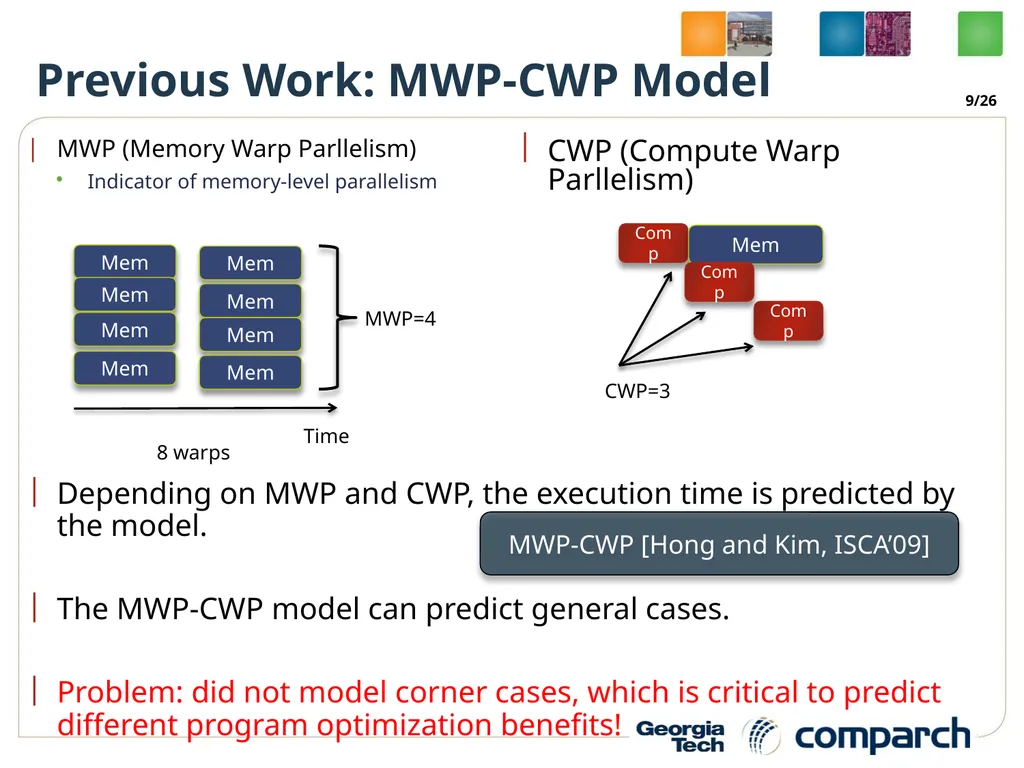
Previous Work: MWP-CWP Model 9/26 Depending on MWP and CWP, the execution time is predicted by the model.
The MWP-CWP model can predict general cases.
Problem: did not model corner cases, which is critical to predict different program optimization benefits! MWP (Memory Warp Parllelism)
Indicator of memory-level parallelism CWP (Compute Warp Parllelism) MWP-CWP [Hong and Kim, ISCA’09]<br>
10
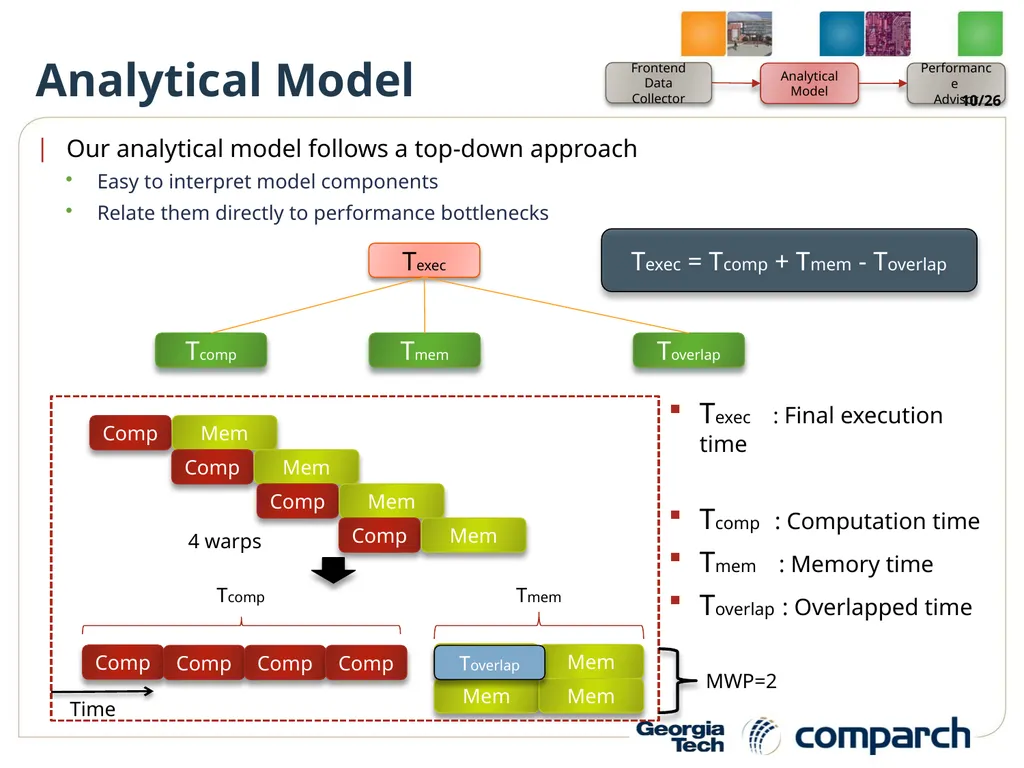
Analytical Model Our analytical model follows a top-down approach
Easy to interpret model components
Relate them directly to performance bottlenecks Texec Tcomp Tmem Toverlap Texec : Final execution time
Tcomp : Computation time
Tmem : Memory time
Toverlap : Overlapped time Tcomp Tmem Toverlap Texec = Tcomp + Tmem - Toverlap 10/26 4 warps MWP=2 Time<br>
11
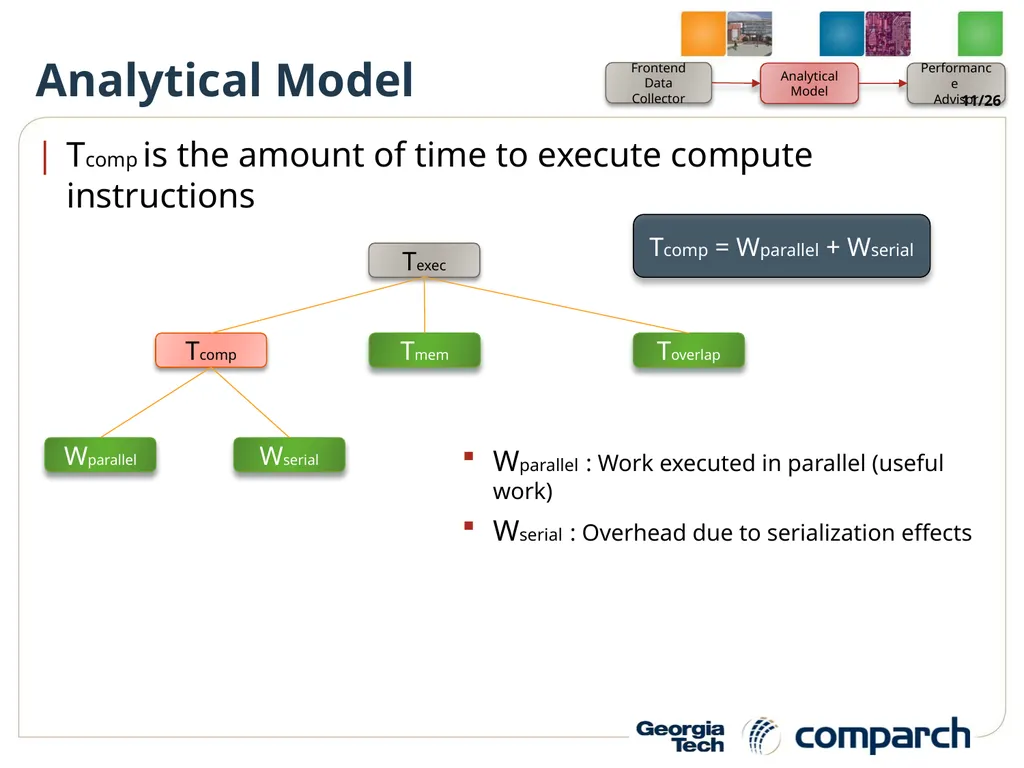
Analytical Model Tcomp is the amount of time to execute compute instructions Texec Tcomp Tmem Toverlap Wserial Wparallel Wparallel : Work executed in parallel (useful work)
Wserial : Overhead due to serialization effects Tcomp = Wparallel + Wserial 11/26<br>
12
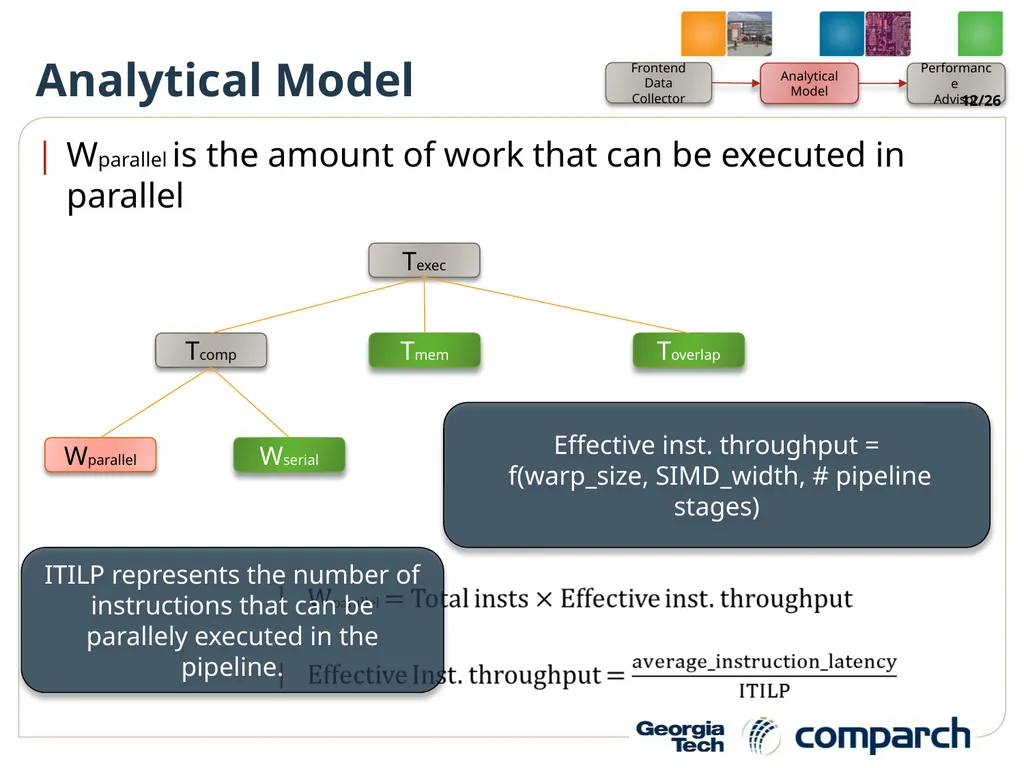
Analytical Model Wparallel is the amount of work that can be executed in parallel Texec Tcomp Tmem Toverlap Wserial Wparallel Effective inst. throughput =
f(warp_size, SIMD_width, # pipeline stages) 12/26 ITILP represents the number of instructions that can be parallely executed in the pipeline.<br>
13
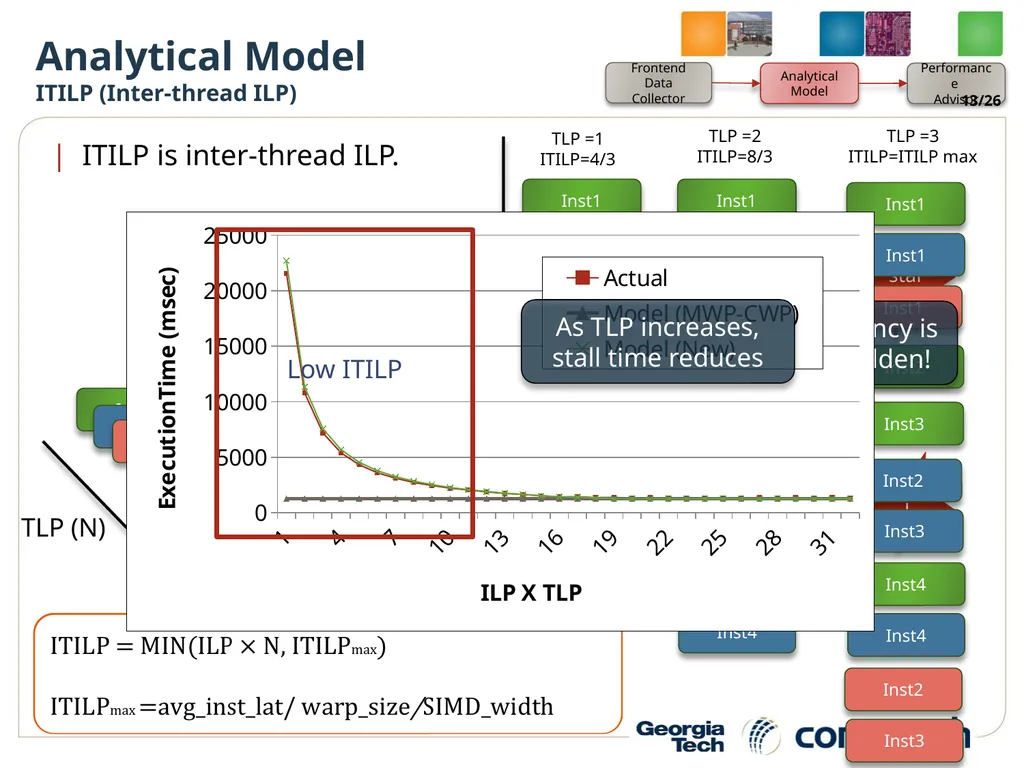
Analytical Model�ITILP (Inter-thread ILP) ITILP is inter-thread ILP. Time TLP (N) 13/26 Execution latency is already all hidden! TLP =1 TLP =2 TLP =3 ILP =4/3 TLP =1
ITILP=4/3 TLP =2
ITILP=8/3 TLP =3
ITILP=ITILP max Low ITILP As TLP increases, stall time reduces<br>
14
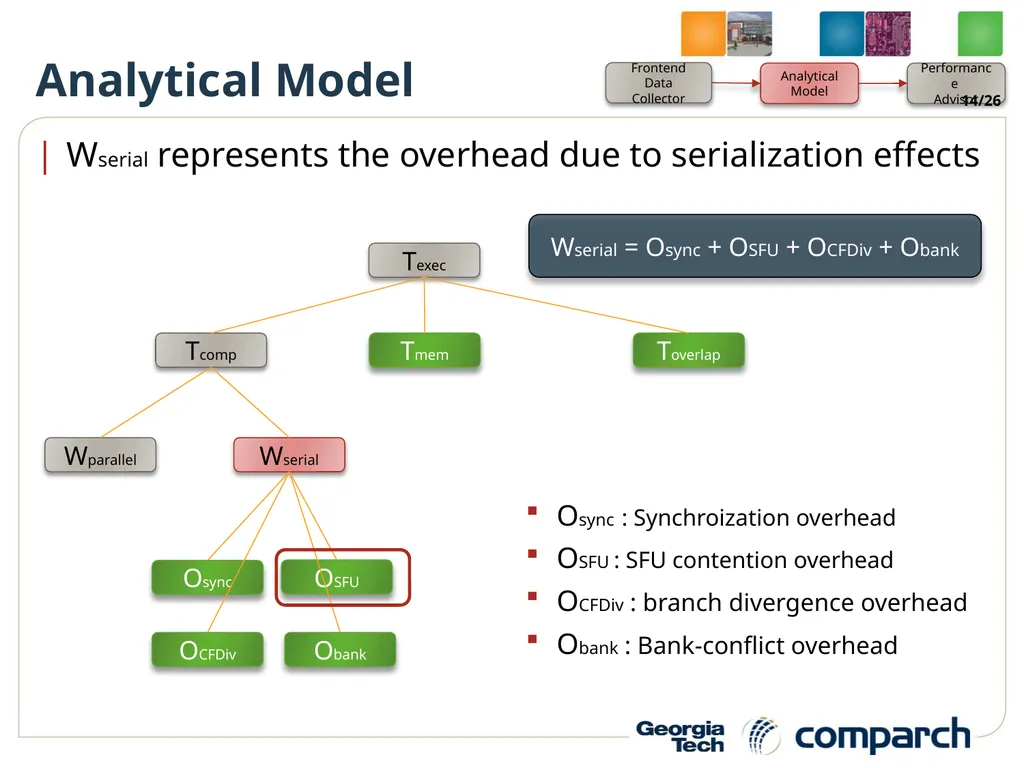
Analytical Model Wserial represents the overhead due to serialization effects Texec Tcomp Tmem Toverlap Wserial Wparallel Osync OSFU OCFDiv Obank Wserial = Osync + OSFU + OCFDiv + Obank Osync : Synchroization overhead
OSFU : SFU contention overhead
OCFDiv : branch divergence overhead
Obank : Bank-conflict overhead 14/26<br>
15
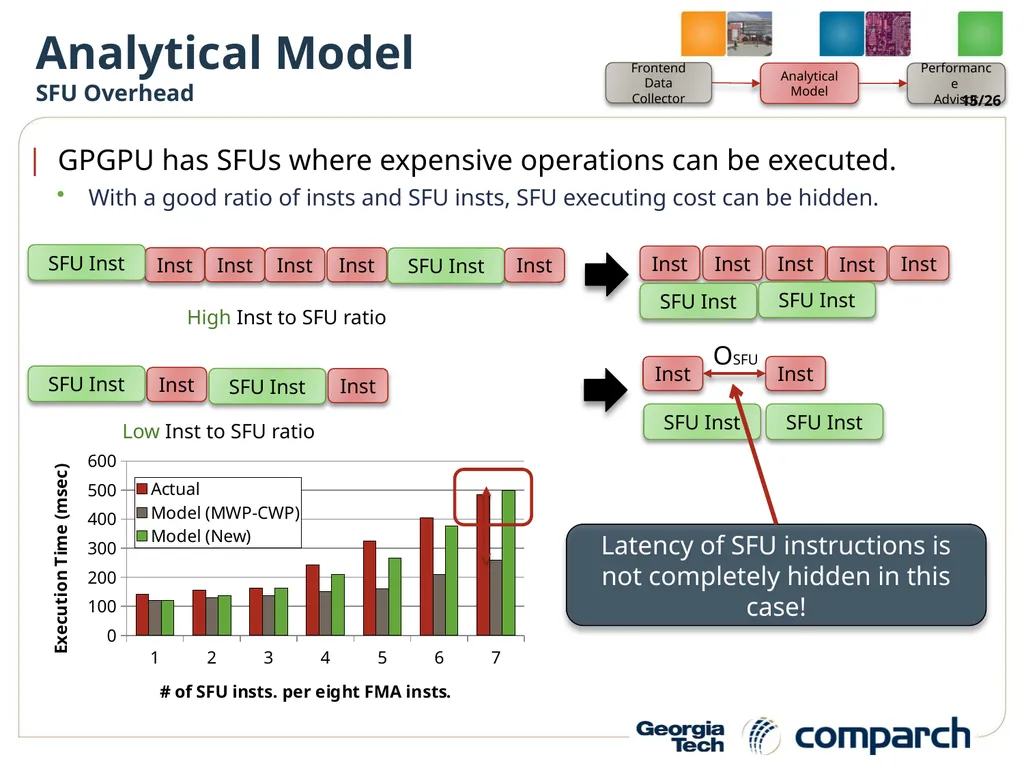
Analytical Model�SFU Overhead GPGPU has SFUs where expensive operations can be executed.
With a good ratio of insts and SFU insts, SFU executing cost can be hidden. Inst SFU Inst Inst Inst Inst Inst Inst Inst Inst Inst SFU Inst Inst SFU Inst SFU Inst Inst SFU Inst SFU Inst Inst Inst SFU Inst Inst SFU Inst Latency of SFU instructions is not completely hidden in this case! 15/26 High Inst to SFU ratio Low Inst to SFU ratio<br>
16
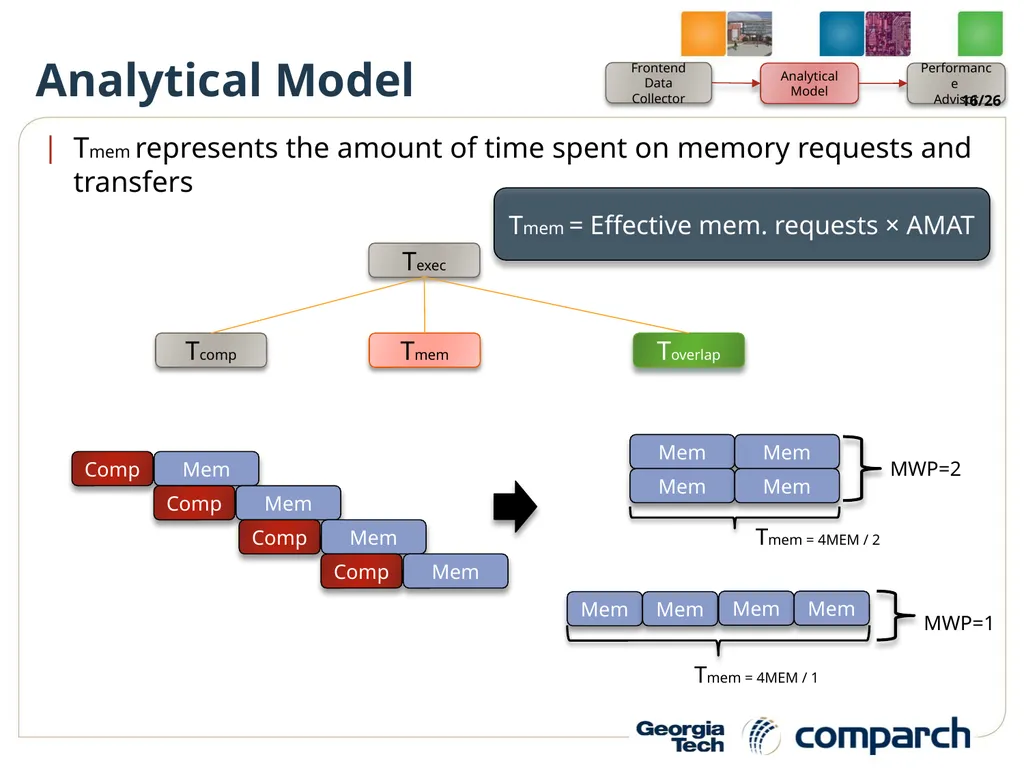
Analytical Model Texec Tcomp Tmem Toverlap Tmem represents the amount of time spent on memory requests and transfers Mem Mem Mem Mem Mem Mem Mem Mem Tmem = 4MEM / 2 Tmem = 4MEM / 1 Tmem = Effective mem. requests × AMAT 16/26 MWP=2 MWP=1<br>
17
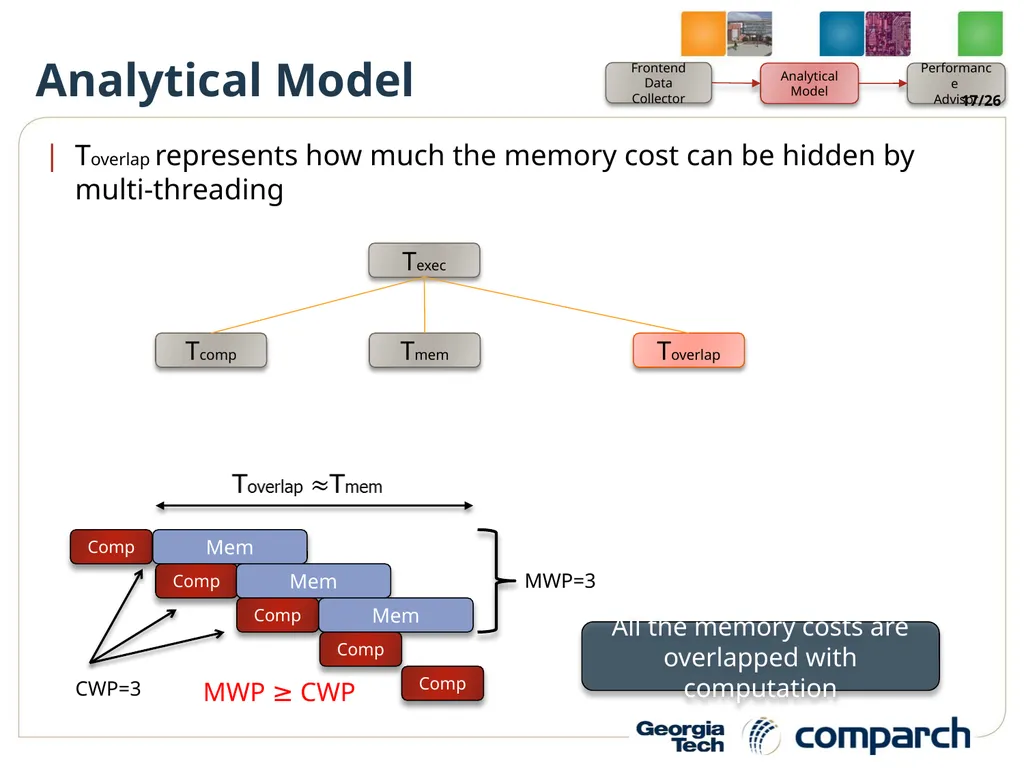
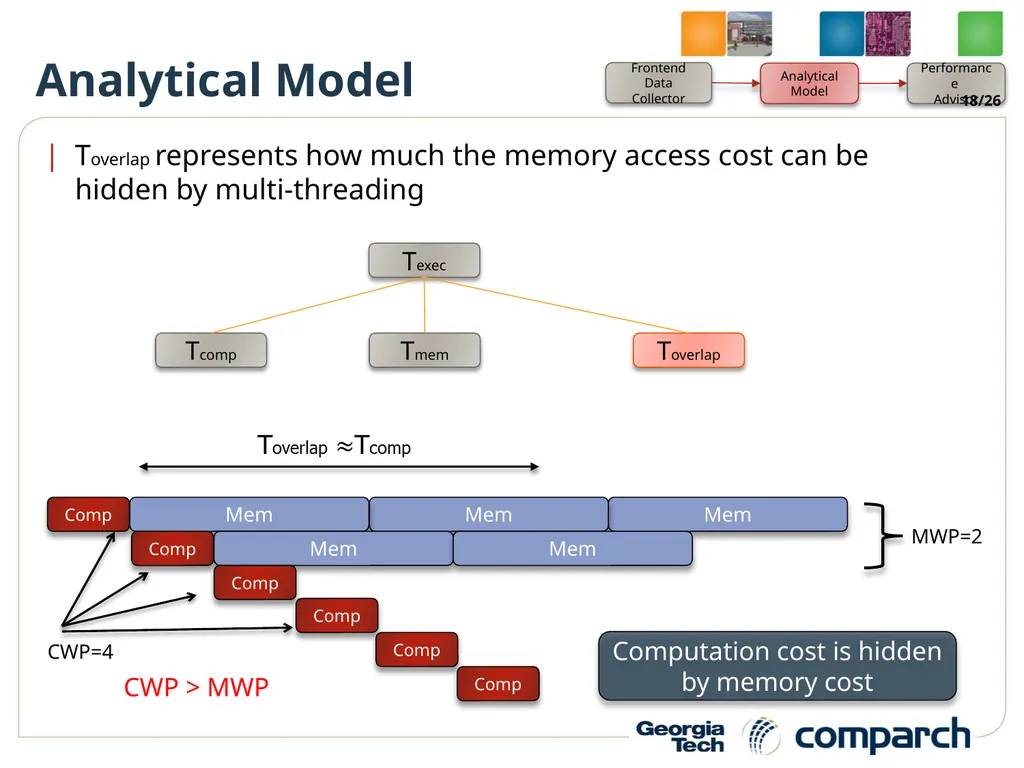
Analytical Model Toverlap represents how much the memory cost can be hidden by multi-threading Texec Tcomp Tmem Toverlap All the memory costs are overlapped with computation 17/26 MWP=3 CWP=3<br>
18
Mem Mem Analytical Model Toverlap represents how much the memory access cost can be hidden by multi-threading Texec Tcomp Tmem Toverlap Comp Mem Mem Comp Comp Comp Comp Computation cost is hidden by memory cost 18/26 CWP > MWP MWP=2 CWP=4<br>
19
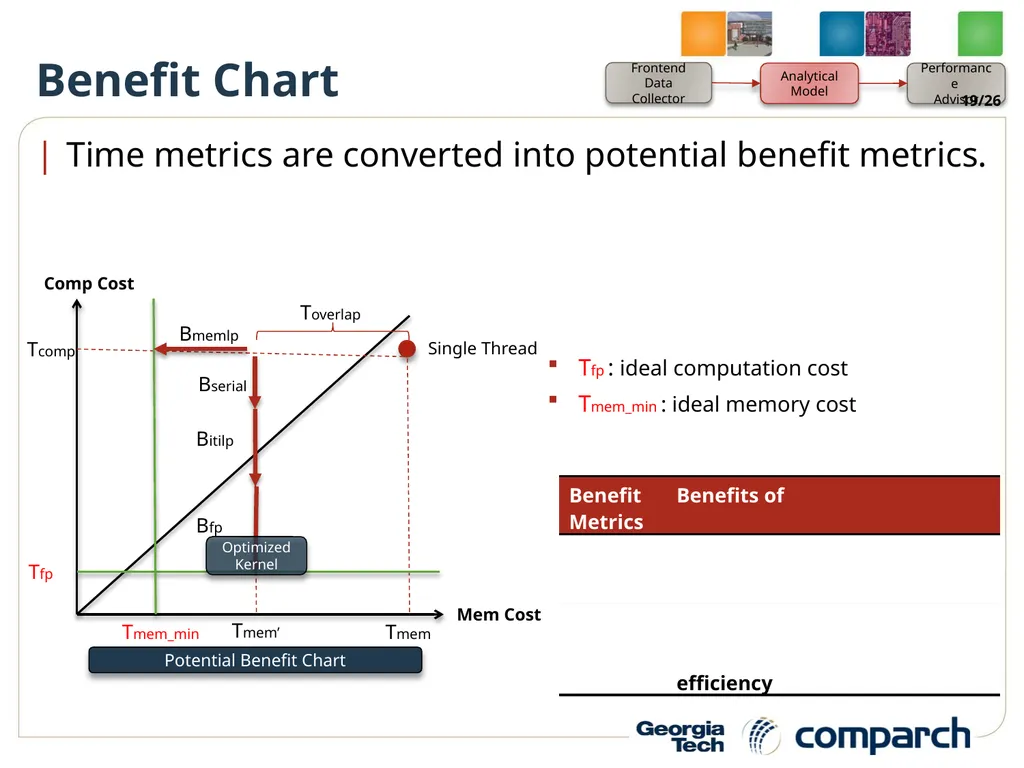
Benefit Chart Time metrics are converted into potential benefit metrics. Tmem Mem Cost Comp Cost Tcomp Tmem’ Toverlap Tmem_min Tfp Potential Benefit Chart Bmemlp Bserial Bitilp Bfp Tfp : ideal computation cost
Tmem_min : ideal memory cost 19/26 Single Thread Optimized Kernel<br>
20
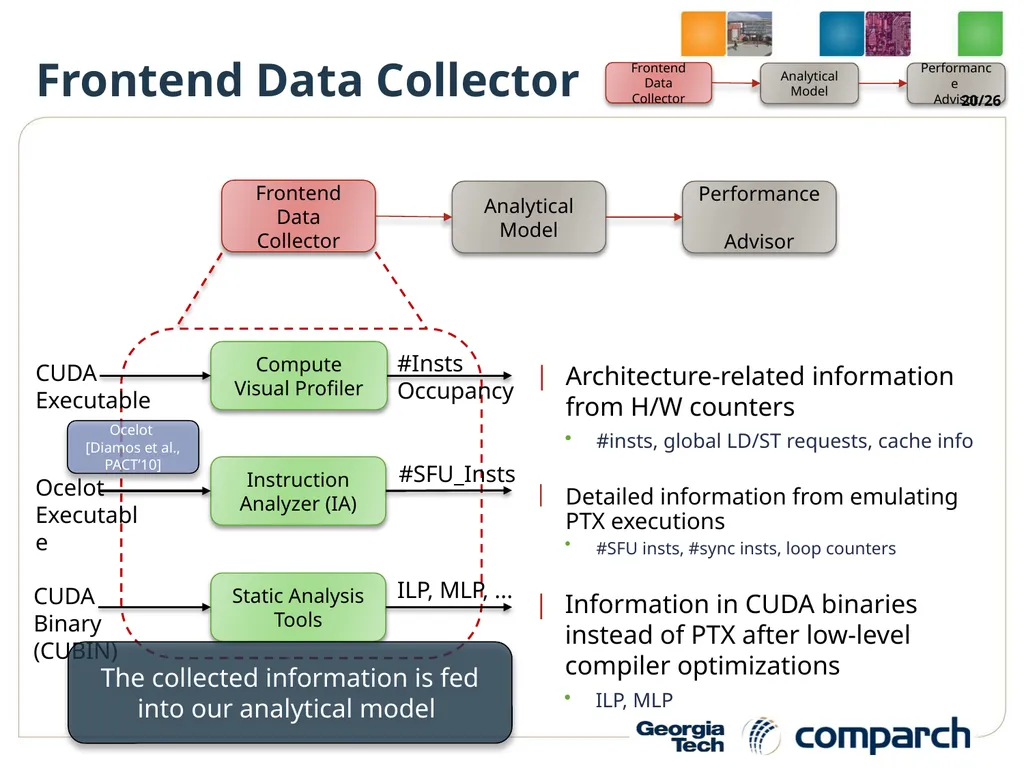
Frontend Data Collector Architecture-related information from H/W counters
#insts, global LD/ST requests, cache info Compute
Visual Profiler Instruction
Analyzer (IA) Static Analysis
Tools CUDA Executable Ocelot
Executable CUDA Binary
(CUBIN) #Insts
Occupancy #SFU_Insts ILP, MLP, ... Information in CUDA binaries instead of PTX after low-level compiler optimizations
ILP, MLP Detailed information from emulating PTX executions
#SFU insts, #sync insts, loop counters The collected information is fed into our analytical model 20/26 Ocelot
[Diamos et al., PACT’10]<br>
21
Outline Motivation
GPUPerf: A Performance Analysis Framework
Performance Advisor
Analytical Model
Frontend Data Collector
Evaluations
Conclusion 21/26<br>
22
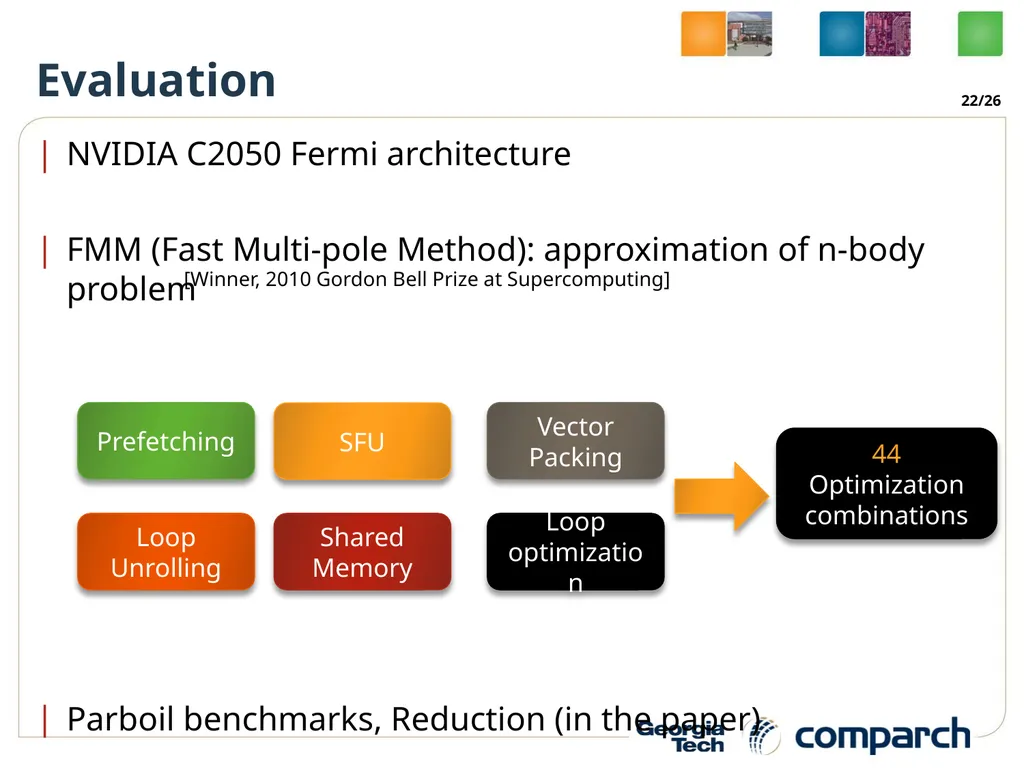
Evaluation 22/26 NVIDIA C2050 Fermi architecture
FMM (Fast Multi-pole Method): approximation of n-body problem
Parboil benchmarks, Reduction (in the paper) Prefetching Loop Unrolling SFU Shared Memory Vector Packing Loop optimization [Winner, 2010 Gordon Bell Prize at Supercomputing] 44 Optimization combinations<br>
23
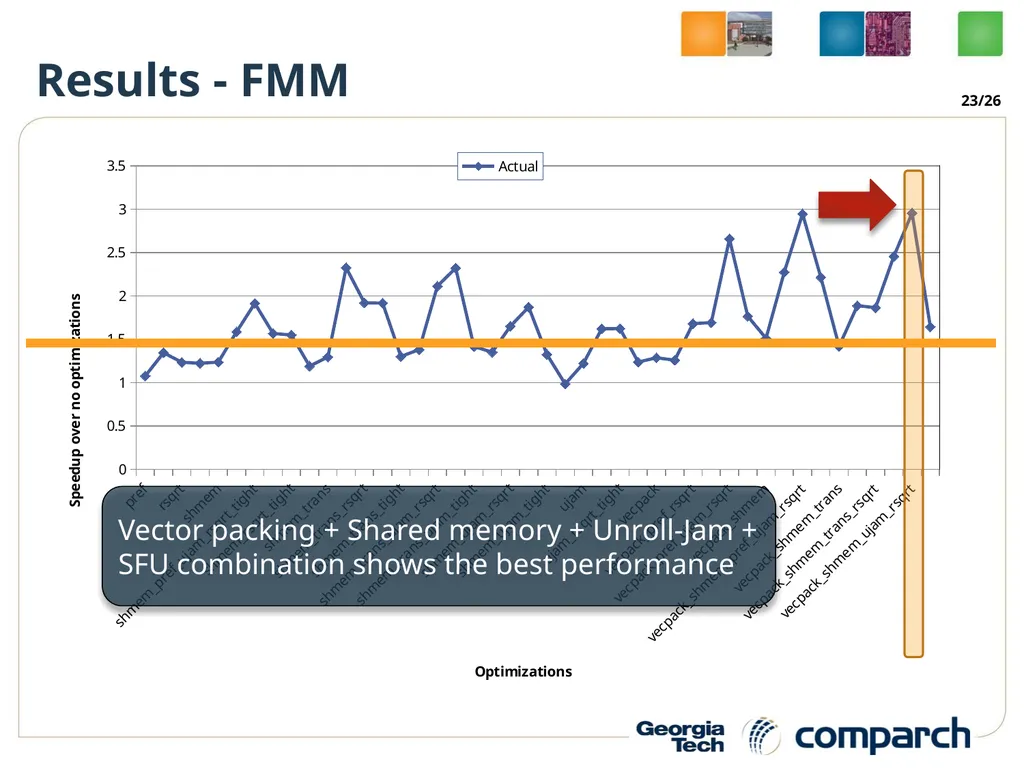
Results - FMM 23/26 Vector packing + Shared memory + Unroll-Jam + SFU combination shows the best performance<br>
24
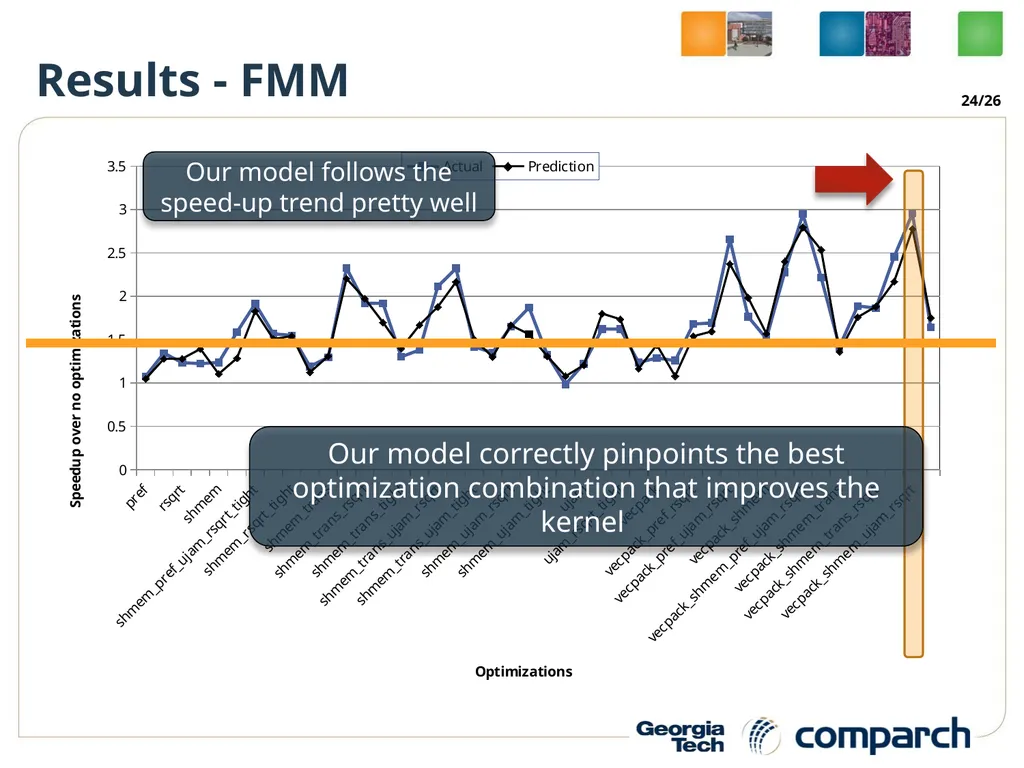
Results - FMM 24/26 Our model follows the speed-up trend pretty well Our model correctly pinpoints the best optimization combination that improves the kernel<br>
25
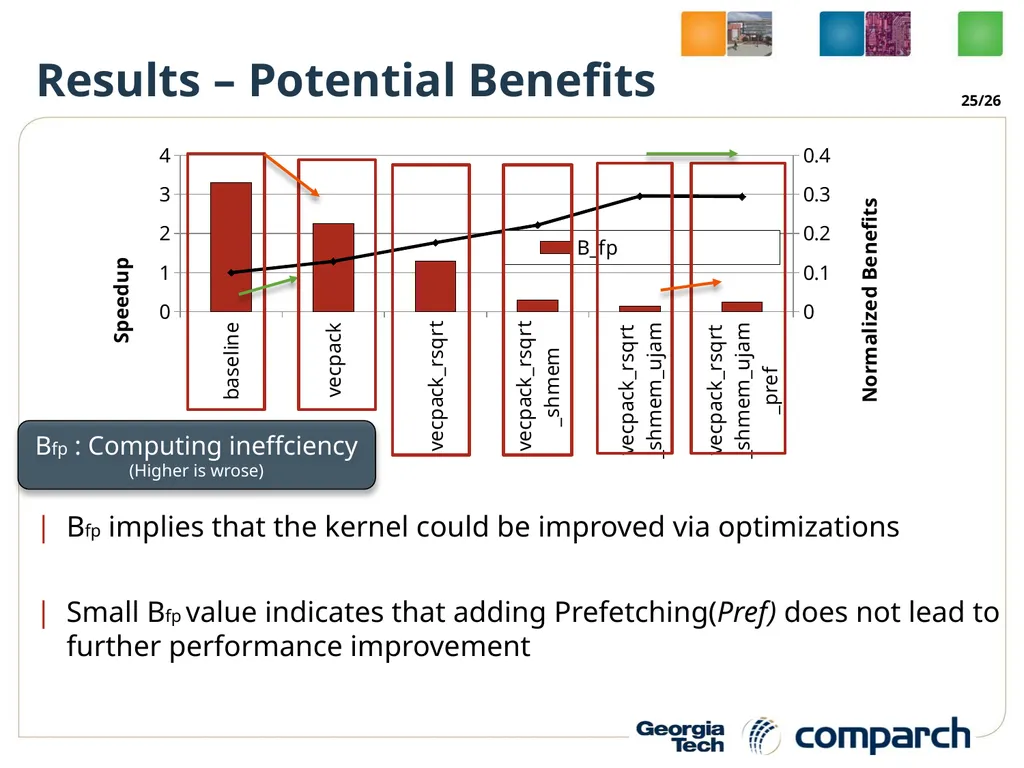
Results – Potential Benefits Bfp implies that the kernel could be improved via optimizations
Small Bfp value indicates that adding Prefetching(Pref) does not lead to further performance improvement 25/26 Bfp : Computing ineffciency
(Higher is wrose)<br>
26
Conclusion We propose performance analysis framework.
Front-end data collector, analytical model and performance advisor.
Performance advisor provides potential benefit metrics, which can guide performance tuning for GPGPU code.
(Bmemlp, Bserial, Bitilp, Bfp).
44 optimization combinations in FMM are well predicted.
Future work: the performance benefit advisor can be inputs to compilers. 26/26<br>