
A Primer on How State Flex Coordinators Can Use
T
Published · 98 slides · 0 views
1 / 1








Description
A Primer on How State Flex Coordinators Can Use the Financial Indicators in CAHMPAS Funded by: Cooperative Agreement for the National Evaluation of the Rural Hospital Flexibility Program. Technical and Non-Financial Assistance for the
Related Topics
Share
Embed code
Download this presentation From Below
"A Primer on How State Flex Coordinators Can Use" is the property of its rightful owner. Permission is granted to download and print the materials on this website for personal, non-commercial use only, and to display it on your personal computer provided you do not modify the materials and that you retain all copyright notices contained in the materials. By downloading content from our website, you accept the terms of this agreement.
Presentation Transcript
01
A Primer on How State Flex Coordinators Can Use the Financial Indicators in CAHMPAS Funded by: Cooperative Agreement for the National Evaluation of the Rural Hospital Flexibility Program. Technical and Non-Financial Assistance for the Office of Rural Health Policy, HRSA, U.S. DHHS (PHS Grant No. U27RH01080), 7/1/2018-6/30/2023, $1,480,000. CAHMPAS Team
North Carolina Rural Health Research and Policy Analysis Center
Cecil G. Sheps Center for Health Services Research
725 Martin Luther King, Jr. Boulevard
Chapel Hill, NC 27514
monitoring@flexmonitoring.org<br>
North Carolina Rural Health Research and Policy Analysis Center
Cecil G. Sheps Center for Health Services Research
725 Martin Luther King, Jr. Boulevard
Chapel Hill, NC 27514
monitoring@flexmonitoring.org<br>
02
Purpose 2 To highlight the financial indicators in CAHMPAS
To describe how Flex Coordinators can use the information to assess the financial performance and condition of CAHs in their state
To illustrate how to identify financial strengths and weaknesses for the design of interventions and targeting of Flex funds by Flex Coordinators<br>
To describe how Flex Coordinators can use the information to assess the financial performance and condition of CAHs in their state
To illustrate how to identify financial strengths and weaknesses for the design of interventions and targeting of Flex funds by Flex Coordinators<br>
03
Contents 1. Introduction to CAHs
2. Overview of CAHMPAS
3. How to measure CAH financial performance using the Indicators
4. How to compare CAH financial performance using peer groups
5. How to evaluate CAH financial performance using benchmarks
How SFCs can use the financial indicators in CAHMPAS: an example
7. Limitations
8. What is next? 3<br>
2. Overview of CAHMPAS
3. How to measure CAH financial performance using the Indicators
4. How to compare CAH financial performance using peer groups
5. How to evaluate CAH financial performance using benchmarks
How SFCs can use the financial indicators in CAHMPAS: an example
7. Limitations
8. What is next? 3<br>
04
1. Introduction to CAHs 4<br>
05
Sources of Revenue to CAHs Medicare
73% of inpatient revenue
37% of outpatient revenue
Medicaid
Commercial payers
Self-pay
Contributions
Grants
Local government 5<br>
73% of inpatient revenue
37% of outpatient revenue
Medicaid
Commercial payers
Self-pay
Contributions
Grants
Local government 5<br>
06
Legislation Legislation enacted as part of the Balanced Budget Act (BBA) of 1997 authorized states to establish State Medicare Rural Hospital Flexibility Programs (Flex Program), under which certain facilities participating in Medicare can become Critical Access Hospitals (CAH). 6<br>
07
Differences from PPS CAHs receive Cost Based Reimbursement - 99% of “allowable costs” for Medicare beneficiaries
That is, NOT the Inpatient Prospective Payment System (IPPS) and Hospital Outpatient Prospective Payment System (OPPS).
A common misconception is that CAHs receive 99% of all costs instead of Medicare costs. 7<br>
That is, NOT the Inpatient Prospective Payment System (IPPS) and Hospital Outpatient Prospective Payment System (OPPS).
A common misconception is that CAHs receive 99% of all costs instead of Medicare costs. 7<br>
08
Criteria to be a CAH Be located in a state that has established a State Flex Program (as of December 2008, only CT, DE, MD, NJ, and RI did not have such a program);
Be located in a rural area or be treated as rural under a special provision that allows qualified hospital providers in urban areas to be treated as rural for purposes of becoming a CAH;
Furnish 24-hour emergency care services, using either on-site or on-call staff; 8<br>
Be located in a rural area or be treated as rural under a special provision that allows qualified hospital providers in urban areas to be treated as rural for purposes of becoming a CAH;
Furnish 24-hour emergency care services, using either on-site or on-call staff; 8<br>
09
Criteria to be a CAH Provide no more than 25 inpatient acute care beds that can be used for either inpatient or swing bed services. A swing bed can be used to provide either acute or skilled nursing facility care. A CAH may also operate a distinct part rehabilitation or psychiatric unit, each with up to 10 beds;
Have an average annual length of stay of 96 hours or less; 9<br>
Have an average annual length of stay of 96 hours or less; 9<br>
10
Criteria to be a CAH Be located either more than 35 miles from the nearest hospital or CAH or more than 15 miles in areas with mountainous terrain or only secondary roads OR prior to January 1, 2006 were State certified as a “necessary provider” of health care services to residents in the area. 10<br>
11
Allowable Costs Payment for inpatient or outpatient CAH services is NOT subject to the following reasonable cost principles:
Lesser of cost or charges; and
Reasonable compensation equivalent limits.
In addition, payment to a CAH for inpatient services is not subject to ceilings on hospital inpatient operating costs or the preadmission payment window provisions applicable to hospitals paid under the Inpatient Prospective Payment System and Outpatient Prospective Payment System. 11<br>
Lesser of cost or charges; and
Reasonable compensation equivalent limits.
In addition, payment to a CAH for inpatient services is not subject to ceilings on hospital inpatient operating costs or the preadmission payment window provisions applicable to hospitals paid under the Inpatient Prospective Payment System and Outpatient Prospective Payment System. 11<br>
12
Medicare Cost Report Financial Indicators in CAHMPAS are derived from data in the Medicare Cost Report, which is publicly available for every hospital receiving Medicare reimbursement
Timing, data quality can be an issue
The Medicare Cost Report contains wealth of data on key variables such as total gross charges (list price), gross and net revenues, expenses, patient visits, payer mix (how many patients have Medicare, Medicaid) 12<br>
Timing, data quality can be an issue
The Medicare Cost Report contains wealth of data on key variables such as total gross charges (list price), gross and net revenues, expenses, patient visits, payer mix (how many patients have Medicare, Medicaid) 12<br>
13
Medicare Cost Report The report is very long, several hundreds of pages, and may reach into the thousands with supporting documents. The report is divided into worksheets. The website below explains the various worksheets and what data go into each block.
http://www.costreportdata.com/worksheet_formats.html 13<br>
http://www.costreportdata.com/worksheet_formats.html 13<br>
14
Interim Rate and Settlement Process A CAH’s initial payment rates are based on the last cost report filed as an acute care hospital
Any fluctuation between the interim rates set and paid throughout the year, and the actual costs for the year, is reflected in the end-of-year cost report settlement.
If Medicare paid too much, the CAH must repay some money to the program. If Medicare’s estimated payments are less than what the cost report says they should have been, the hospital will receive additional payment from Medicare. 14<br>
Any fluctuation between the interim rates set and paid throughout the year, and the actual costs for the year, is reflected in the end-of-year cost report settlement.
If Medicare paid too much, the CAH must repay some money to the program. If Medicare’s estimated payments are less than what the cost report says they should have been, the hospital will receive additional payment from Medicare. 14<br>
15
2. Overview of the Financial Indicators in CAHMPAS 15<br>
16
Purpose of Financial Indicators One of the most important characteristics of a CAH is its financial performance and condition
We want to know whether a CAH has the financial capacity to meet its mission
Financial indicators are single numbers that:
Have easily interpretable financial significance
Facilitate comparisons
Results sometimes focus on financial strengths and weaknesses 16<br>
We want to know whether a CAH has the financial capacity to meet its mission
Financial indicators are single numbers that:
Have easily interpretable financial significance
Facilitate comparisons
Results sometimes focus on financial strengths and weaknesses 16<br>
17
Interpreting Indicators A single indicator value has little meaning:
One point in time that may not be representative
Can’t tell if it is better or worse than other hospitals
Therefore, two techniques are commonly used to help interpret “the numbers”:
Trend (time series) analysis
Comparative (cross-sectional) analysis
Both techniques are used in CAHMPAS 17<br>
One point in time that may not be representative
Can’t tell if it is better or worse than other hospitals
Therefore, two techniques are commonly used to help interpret “the numbers”:
Trend (time series) analysis
Comparative (cross-sectional) analysis
Both techniques are used in CAHMPAS 17<br>
18
Financial Indicators Help to identify:
Questions to ask
Issues to address
Problems to solve
Do not necessarily provide
Answers
Explanations
Solutions 18<br>
Questions to ask
Issues to address
Problems to solve
Do not necessarily provide
Answers
Explanations
Solutions 18<br>
19
Evolution of CAHMPAS How to measure CAH performance1
Indicator selection principles, data quality and availability, and performance metrics
How to compare CAH performance2
Peer groups as a meaningful basis for performance comparisons
How to evaluate CAH performance3
Relative (medians) or absolute (benchmarks) 19 1. Pink GH, Holmes GM, D’Alpe C, McGee P, Strunk. L, Slifkin RT. Financial Indicators for Critical Access Hospitals. Journal of Rural Health 22(3):229-236, Summer 2006 2. Pink GH, Holmes GM, Thompson RE, Slifkin RT. Variations in Financial Performance Among Critical Access Hospitals. Journal of Rural Health 23(4), 299-305, Fall 2007 3. Pink GH, Holmes GM, Slifkin RT, Thompson RE. Developing Financial Benchmarks for Critical Access Hospitals,Health Care Financing Review 30(3), Spring 2009<br>
Indicator selection principles, data quality and availability, and performance metrics
How to compare CAH performance2
Peer groups as a meaningful basis for performance comparisons
How to evaluate CAH performance3
Relative (medians) or absolute (benchmarks) 19 1. Pink GH, Holmes GM, D’Alpe C, McGee P, Strunk. L, Slifkin RT. Financial Indicators for Critical Access Hospitals. Journal of Rural Health 22(3):229-236, Summer 2006 2. Pink GH, Holmes GM, Thompson RE, Slifkin RT. Variations in Financial Performance Among Critical Access Hospitals. Journal of Rural Health 23(4), 299-305, Fall 2007 3. Pink GH, Holmes GM, Slifkin RT, Thompson RE. Developing Financial Benchmarks for Critical Access Hospitals,Health Care Financing Review 30(3), Spring 2009<br>
20
Objectives of the Financial Indicators in CAHMPAS To select and construct a set of financial performance measures that are relevant to CAHs
To provide comparative information that CAH boards and administrators can use to improve financial performance
To improve the quality of Medicare Cost Report data reported by CAHs (our goal) 20<br>
To provide comparative information that CAH boards and administrators can use to improve financial performance
To improve the quality of Medicare Cost Report data reported by CAHs (our goal) 20<br>
21
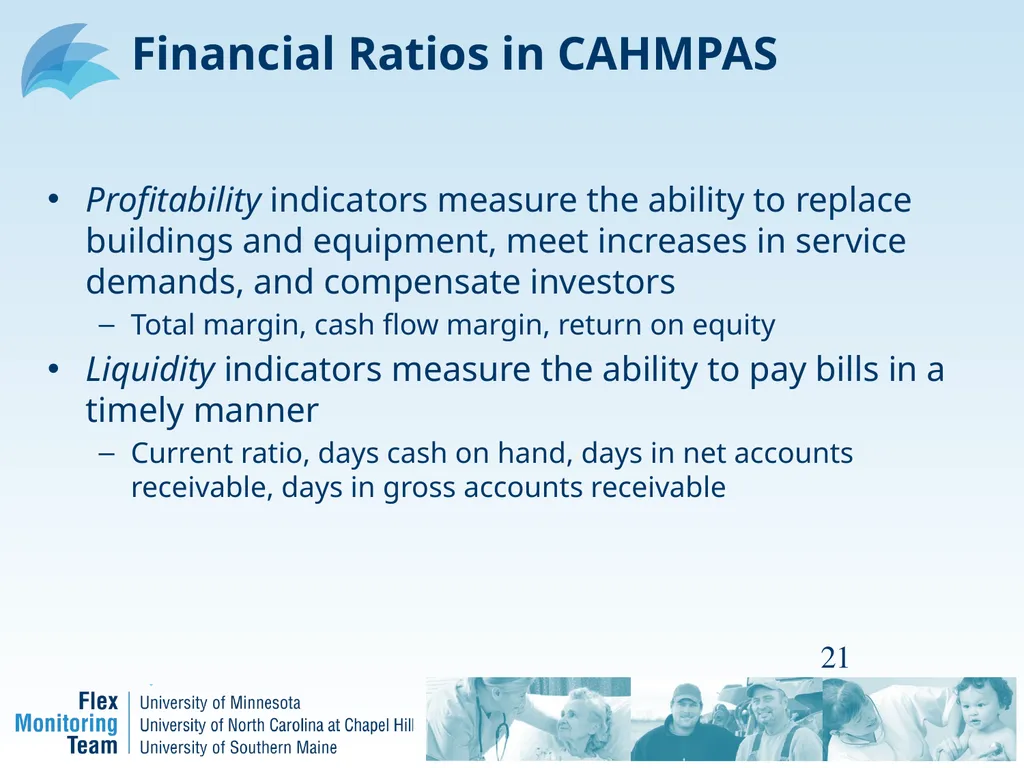
Financial Ratios in CAHMPAS Profitability indicators measure the ability to replace buildings and equipment, meet increases in service demands, and compensate investors
Total margin, cash flow margin, return on equity
Liquidity indicators measure the ability to pay bills in a timely manner
Current ratio, days cash on hand, days in net accounts receivable, days in gross accounts receivable 21<br>
Total margin, cash flow margin, return on equity
Liquidity indicators measure the ability to pay bills in a timely manner
Current ratio, days cash on hand, days in net accounts receivable, days in gross accounts receivable 21<br>
22
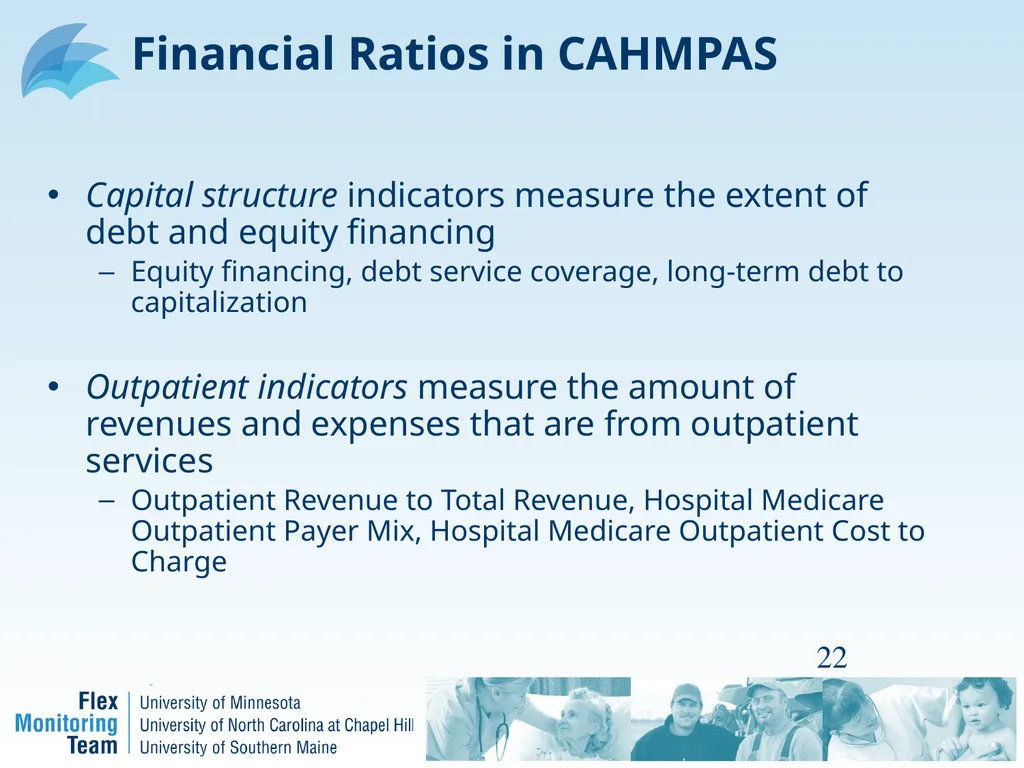
Financial Ratios in CAHMPAS Capital structure indicators measure the extent of debt and equity financing
Equity financing, debt service coverage, long-term debt to capitalization
Outpatient indicators measure the amount of revenues and expenses that are from outpatient services
Outpatient Revenue to Total Revenue, Hospital Medicare Outpatient Payer Mix, Hospital Medicare Outpatient Cost to Charge 22<br>
Equity financing, debt service coverage, long-term debt to capitalization
Outpatient indicators measure the amount of revenues and expenses that are from outpatient services
Outpatient Revenue to Total Revenue, Hospital Medicare Outpatient Payer Mix, Hospital Medicare Outpatient Cost to Charge 22<br>
23
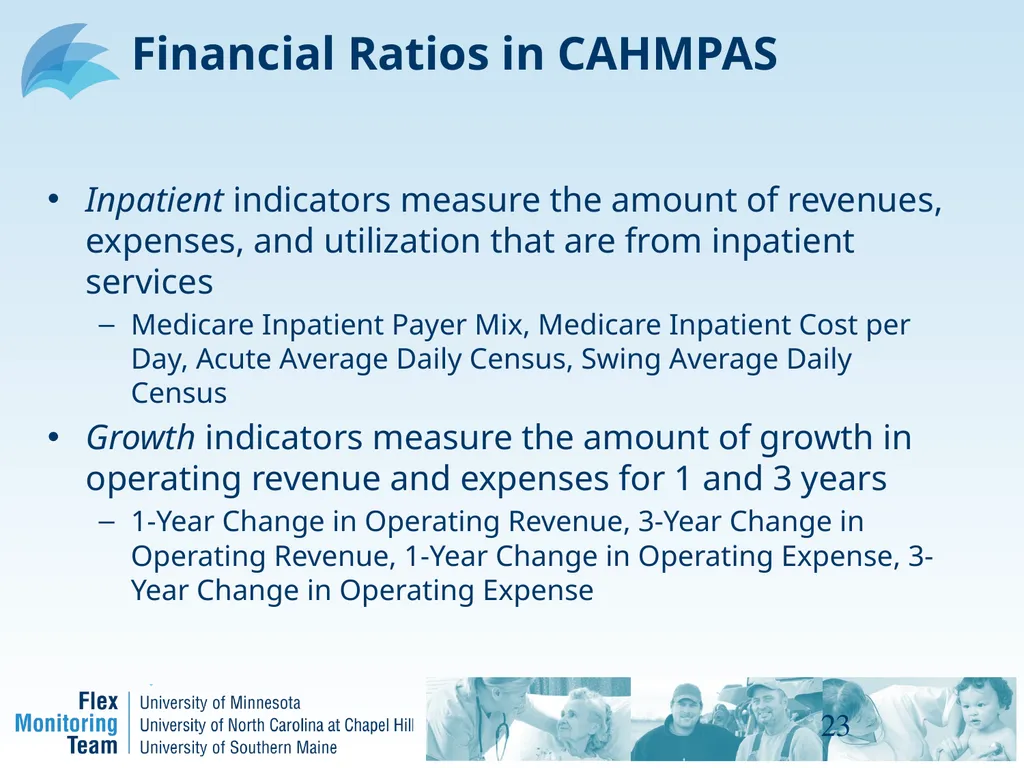
Financial Ratios in CAHMPAS Inpatient indicators measure the amount of revenues, expenses, and utilization that are from inpatient services
Medicare Inpatient Payer Mix, Medicare Inpatient Cost per Day, Acute Average Daily Census, Swing Average Daily Census
Growth indicators measure the amount of growth in operating revenue and expenses for 1 and 3 years
1-Year Change in Operating Revenue, 3-Year Change in Operating Revenue, 1-Year Change in Operating Expense, 3-Year Change in Operating Expense 23<br>
Medicare Inpatient Payer Mix, Medicare Inpatient Cost per Day, Acute Average Daily Census, Swing Average Daily Census
Growth indicators measure the amount of growth in operating revenue and expenses for 1 and 3 years
1-Year Change in Operating Revenue, 3-Year Change in Operating Revenue, 1-Year Change in Operating Expense, 3-Year Change in Operating Expense 23<br>
24
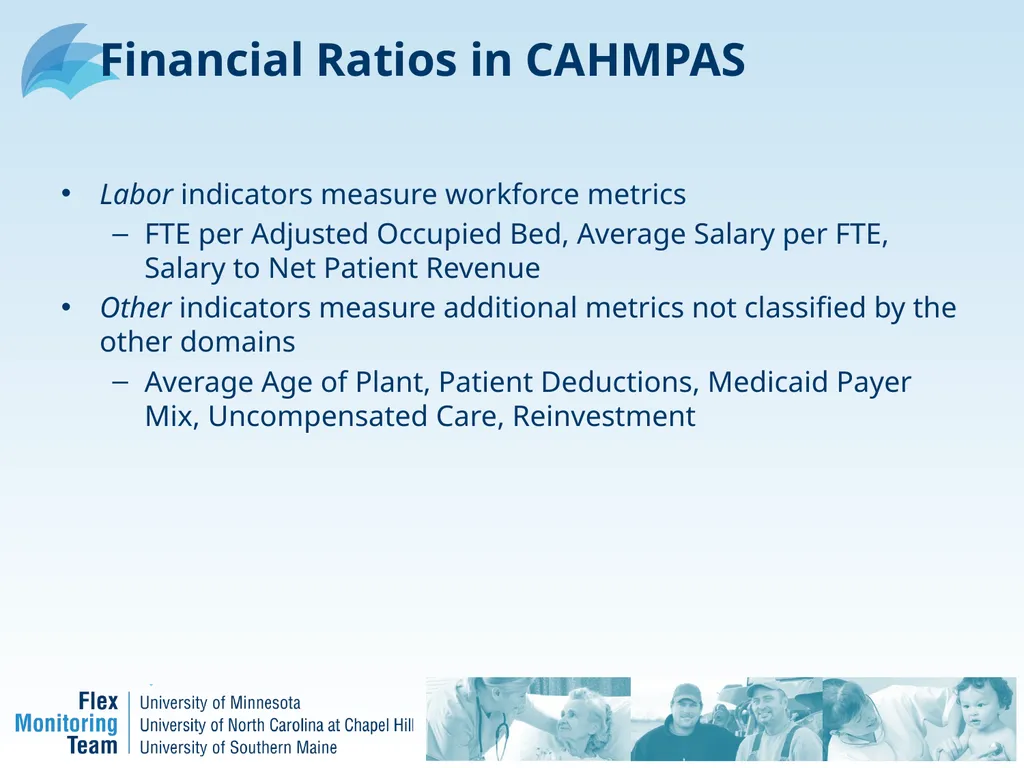
Financial Ratios in CAHMPAS Labor indicators measure workforce metrics
FTE per Adjusted Occupied Bed, Average Salary per FTE, Salary to Net Patient Revenue
Other indicators measure additional metrics not classified by the other domains
Average Age of Plant, Patient Deductions, Medicaid Payer Mix, Uncompensated Care, Reinvestment<br>
FTE per Adjusted Occupied Bed, Average Salary per FTE, Salary to Net Patient Revenue
Other indicators measure additional metrics not classified by the other domains
Average Age of Plant, Patient Deductions, Medicaid Payer Mix, Uncompensated Care, Reinvestment<br>
25
3. How to measure CAH financial
performance using the indicators 25 Pink GH, Holmes GM, D’Alpe C, McGee P, Strunk. L, Slifkin RT. Financial Indicators for Critical Access Hospitals. Journal of Rural Health 22(3):229-236, Summer 2006.<br>
26
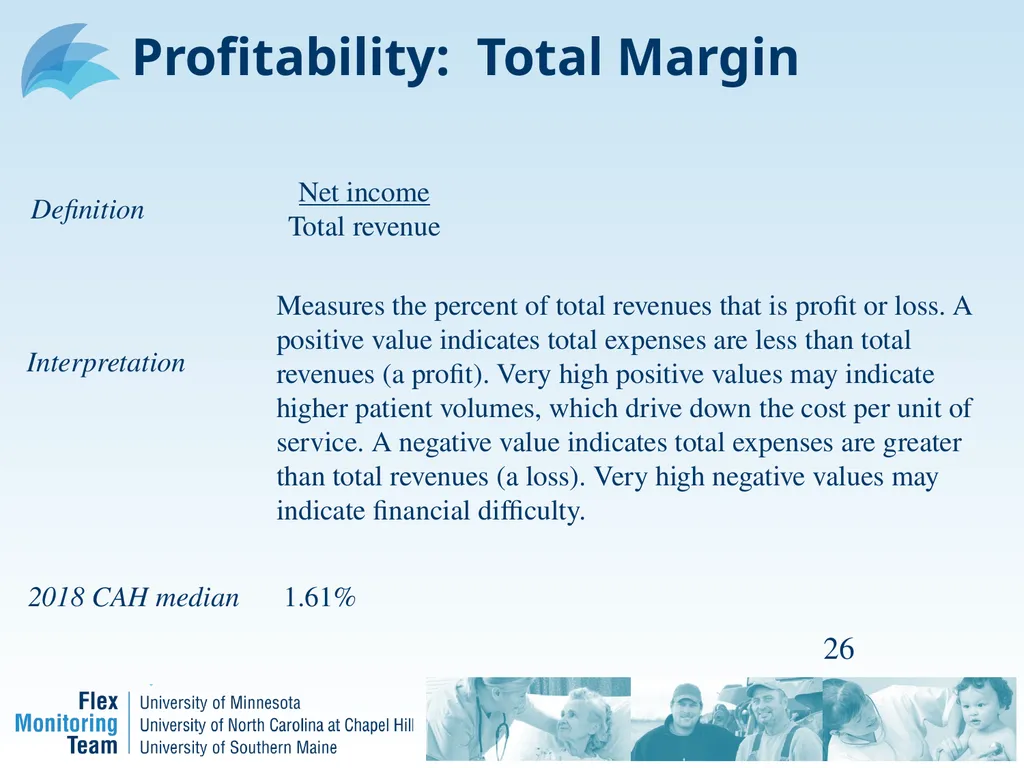
Profitability: Total Margin 26 Net income
Total revenue Measures the percent of total revenues that is profit or loss. A positive value indicates total expenses are less than total revenues (a profit). Very high positive values may indicate higher patient volumes, which drive down the cost per unit of service. A negative value indicates total expenses are greater than total revenues (a loss). Very high negative values may indicate financial difficulty. Definition Interpretation 2018 CAH median 1.61%<br>
Total revenue Measures the percent of total revenues that is profit or loss. A positive value indicates total expenses are less than total revenues (a profit). Very high positive values may indicate higher patient volumes, which drive down the cost per unit of service. A negative value indicates total expenses are greater than total revenues (a loss). Very high negative values may indicate financial difficulty. Definition Interpretation 2018 CAH median 1.61%<br>
27
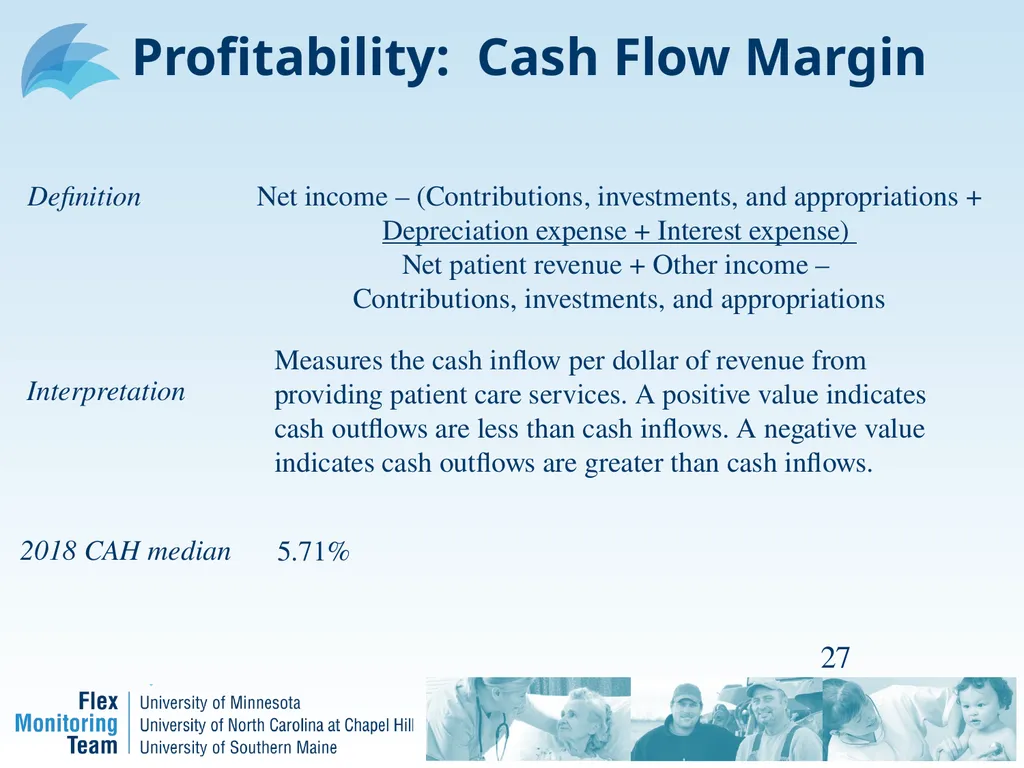
Profitability: Cash Flow Margin 27 Net income – (Contributions, investments, and appropriations +
Depreciation expense + Interest expense)
Net patient revenue + Other income –
Contributions, investments, and appropriations Measures the cash inflow per dollar of revenue from providing patient care services. A positive value indicates cash outflows are less than cash inflows. A negative value indicates cash outflows are greater than cash inflows. Definition Interpretation 2018 CAH median 5.71%<br>
Depreciation expense + Interest expense)
Net patient revenue + Other income –
Contributions, investments, and appropriations Measures the cash inflow per dollar of revenue from providing patient care services. A positive value indicates cash outflows are less than cash inflows. A negative value indicates cash outflows are greater than cash inflows. Definition Interpretation 2018 CAH median 5.71%<br>
28
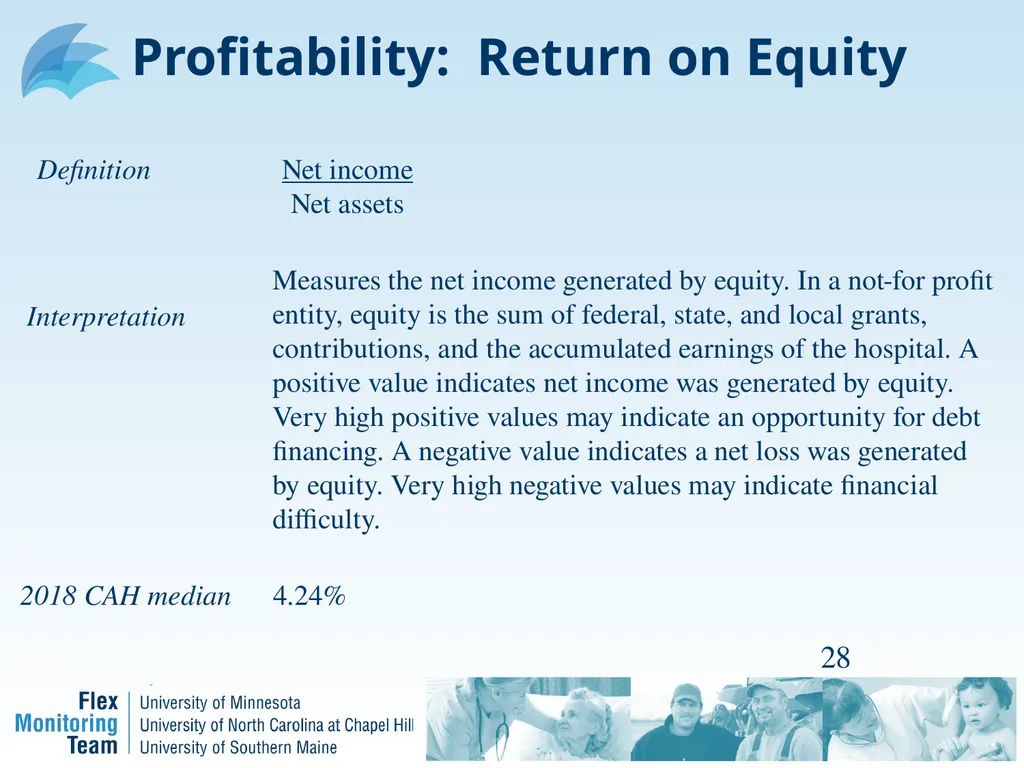
Profitability: Return on Equity 28 Net income
Net assets Measures the net income generated by equity. In a not-for profit entity, equity is the sum of federal, state, and local grants, contributions, and the accumulated earnings of the hospital. A positive value indicates net income was generated by equity. Very high positive values may indicate an opportunity for debt financing. A negative value indicates a net loss was generated by equity. Very high negative values may indicate financial difficulty. Definition Interpretation 2018 CAH median 4.24%<br>
Net assets Measures the net income generated by equity. In a not-for profit entity, equity is the sum of federal, state, and local grants, contributions, and the accumulated earnings of the hospital. A positive value indicates net income was generated by equity. Very high positive values may indicate an opportunity for debt financing. A negative value indicates a net loss was generated by equity. Very high negative values may indicate financial difficulty. Definition Interpretation 2018 CAH median 4.24%<br>
29
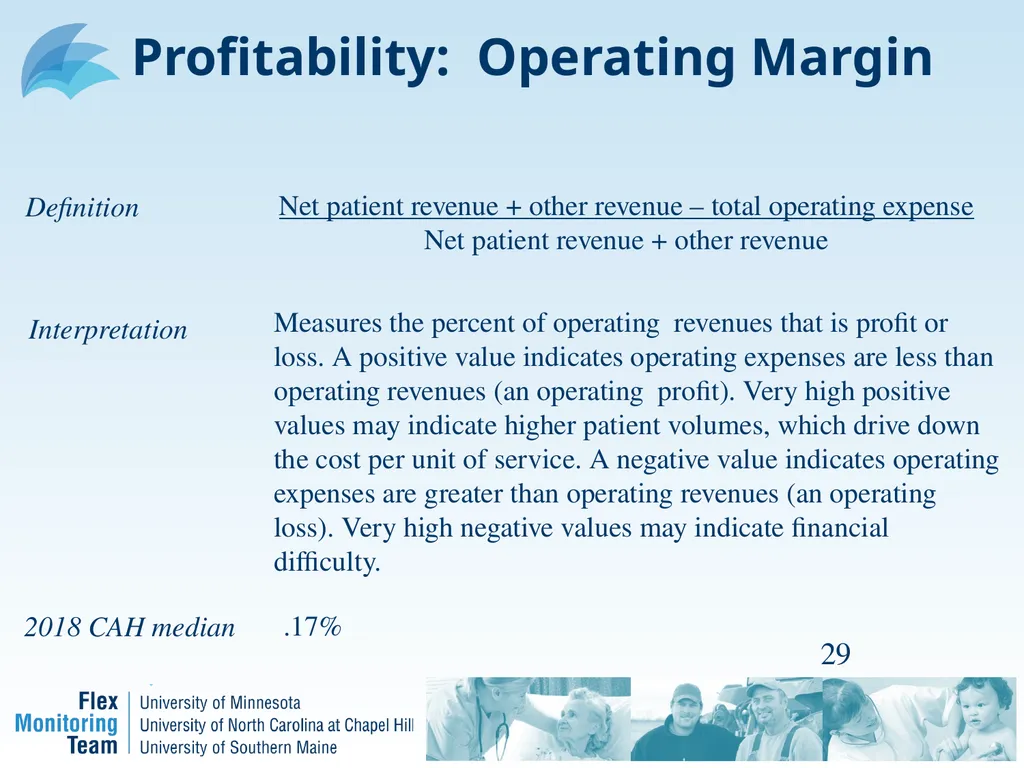
Profitability: Operating Margin 29 Net patient revenue + other revenue – total operating expense
Net patient revenue + other revenue Measures the percent of operating revenues that is profit or loss. A positive value indicates operating expenses are less than operating revenues (an operating profit). Very high positive values may indicate higher patient volumes, which drive down the cost per unit of service. A negative value indicates operating expenses are greater than operating revenues (an operating loss). Very high negative values may indicate financial difficulty. Definition Interpretation 2018 CAH median .17%<br>
Net patient revenue + other revenue Measures the percent of operating revenues that is profit or loss. A positive value indicates operating expenses are less than operating revenues (an operating profit). Very high positive values may indicate higher patient volumes, which drive down the cost per unit of service. A negative value indicates operating expenses are greater than operating revenues (an operating loss). Very high negative values may indicate financial difficulty. Definition Interpretation 2018 CAH median .17%<br>
30
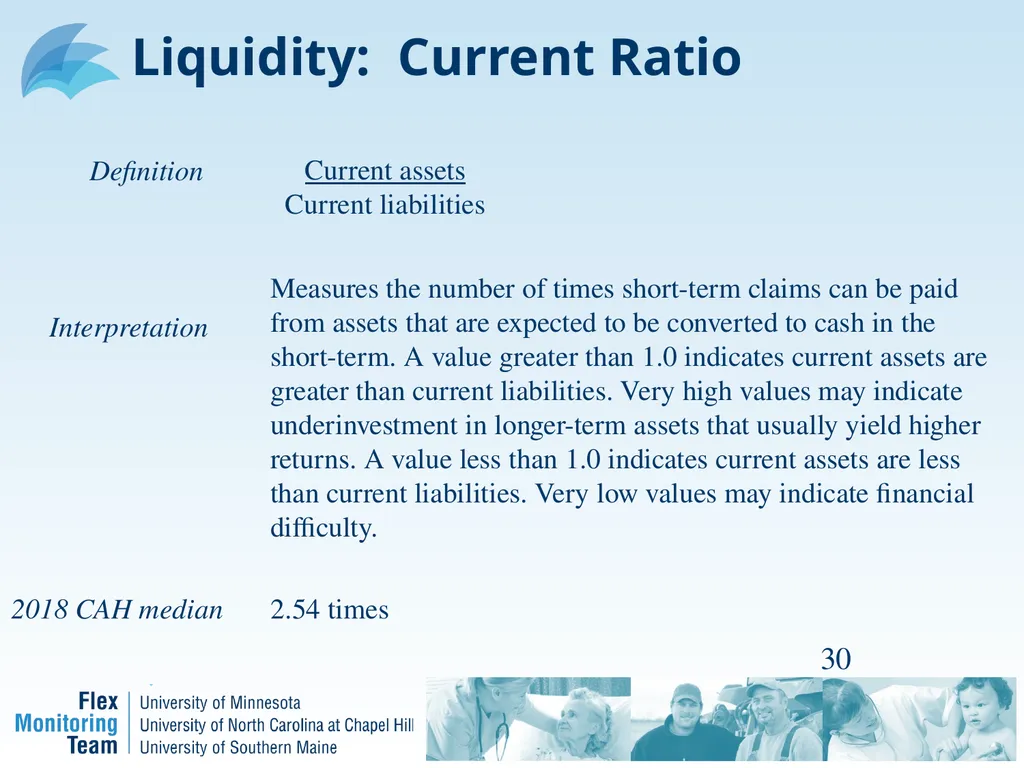
Liquidity: Current Ratio 30 Current assets
Current liabilities Measures the number of times short-term claims can be paid from assets that are expected to be converted to cash in the short-term. A value greater than 1.0 indicates current assets are greater than current liabilities. Very high values may indicate underinvestment in longer-term assets that usually yield higher returns. A value less than 1.0 indicates current assets are less than current liabilities. Very low values may indicate financial difficulty. Definition Interpretation 2018 CAH median 2.54 times<br>
Current liabilities Measures the number of times short-term claims can be paid from assets that are expected to be converted to cash in the short-term. A value greater than 1.0 indicates current assets are greater than current liabilities. Very high values may indicate underinvestment in longer-term assets that usually yield higher returns. A value less than 1.0 indicates current assets are less than current liabilities. Very low values may indicate financial difficulty. Definition Interpretation 2018 CAH median 2.54 times<br>
31
Liquidity: Days Cash on Hand 31 Cash + temporary investments + investments
(Total expenses – Depreciation) / Days in period Measures the number of days an organization could operate if no cash was collected or received. A low value indicates only a few days of cash on hand. Very low values may indicate financial difficulty. A high value indicates many days of cash on hand. Very high values may indicate under-investment in longer-term assets that usually yield higher returns. Days Cash on Hand is calculated at fiscal year end, which does not reflect
uneven cash flows throughout the year. Definition Interpretation 2018 CAH median 75.88 days<br>
(Total expenses – Depreciation) / Days in period Measures the number of days an organization could operate if no cash was collected or received. A low value indicates only a few days of cash on hand. Very low values may indicate financial difficulty. A high value indicates many days of cash on hand. Very high values may indicate under-investment in longer-term assets that usually yield higher returns. Days Cash on Hand is calculated at fiscal year end, which does not reflect
uneven cash flows throughout the year. Definition Interpretation 2018 CAH median 75.88 days<br>
32
Liquidity:
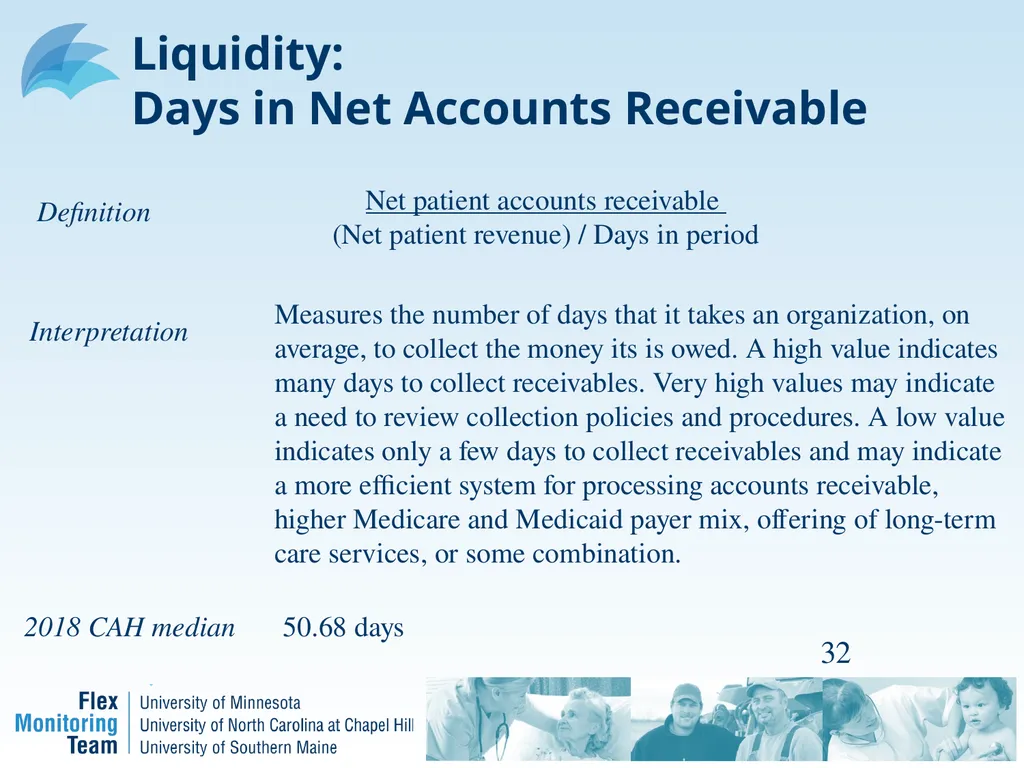
Days in Net Accounts Receivable 32 Net patient accounts receivable
(Net patient revenue) / Days in period Measures the number of days that it takes an organization, on average, to collect the money its is owed. A high value indicates many days to collect receivables. Very high values may indicate a need to review collection policies and procedures. A low value indicates only a few days to collect receivables and may indicate a more efficient system for processing accounts receivable, higher Medicare and Medicaid payer mix, offering of long-term care services, or some combination. Definition Interpretation 2018 CAH median 50.68 days<br>
(Net patient revenue) / Days in period Measures the number of days that it takes an organization, on average, to collect the money its is owed. A high value indicates many days to collect receivables. Very high values may indicate a need to review collection policies and procedures. A low value indicates only a few days to collect receivables and may indicate a more efficient system for processing accounts receivable, higher Medicare and Medicaid payer mix, offering of long-term care services, or some combination. Definition Interpretation 2018 CAH median 50.68 days<br>
33
Liquidity:
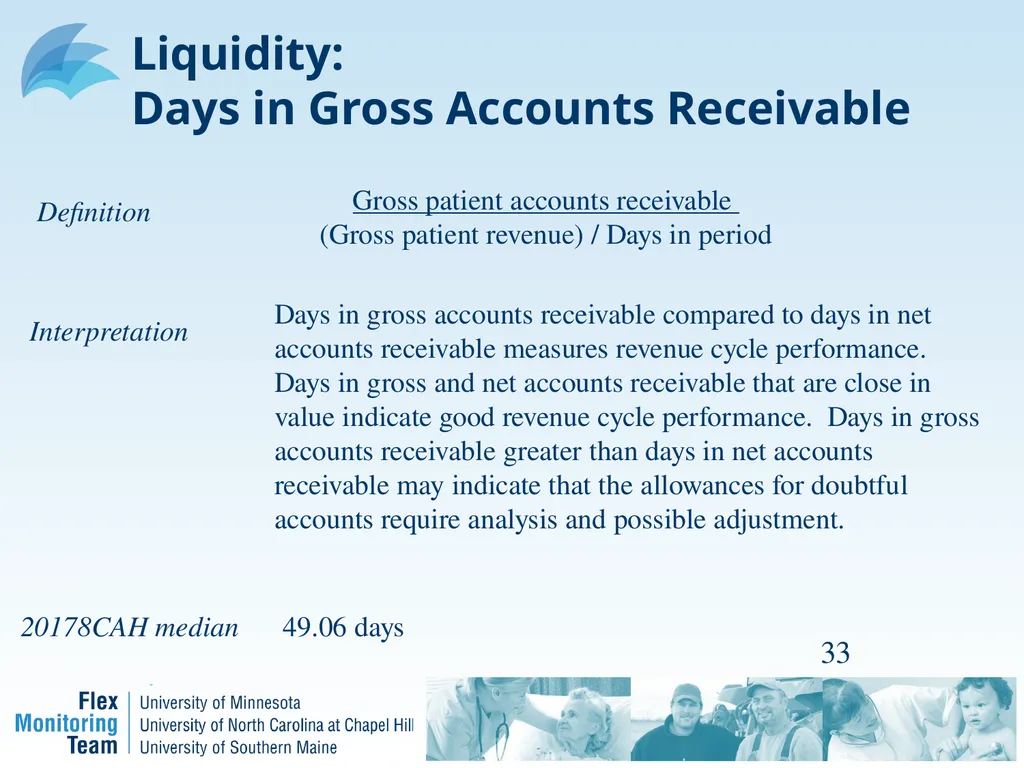
Days in Gross Accounts Receivable 33 Gross patient accounts receivable
(Gross patient revenue) / Days in period Days in gross accounts receivable compared to days in net accounts receivable measures revenue cycle performance. Days in gross and net accounts receivable that are close in value indicate good revenue cycle performance. Days in gross accounts receivable greater than days in net accounts receivable may indicate that the allowances for doubtful accounts require analysis and possible adjustment. Definition Interpretation 20178CAH median 49.06 days<br>
(Gross patient revenue) / Days in period Days in gross accounts receivable compared to days in net accounts receivable measures revenue cycle performance. Days in gross and net accounts receivable that are close in value indicate good revenue cycle performance. Days in gross accounts receivable greater than days in net accounts receivable may indicate that the allowances for doubtful accounts require analysis and possible adjustment. Definition Interpretation 20178CAH median 49.06 days<br>
34
Capital Structure: Equity Financing 34 Net assets
Total assets Measures the percentage of total assets financed by equity. In a not-for profit entity, equity is the sum of federal, state and local grants, contributions, and the accumulated earnings of the hospital. A value greater than 50 percent indicates that more of the assets are financed by equity than by debt. Very high values may indicate opportunities for debt financing. A value less than 50 percent indicates that more of the assets are financed by debt than by equity. Very low values may indicate exposure to financial risk because debt service is a fixed charge. Definition Interpretation 2018 CAH median 59.69 %<br>
Total assets Measures the percentage of total assets financed by equity. In a not-for profit entity, equity is the sum of federal, state and local grants, contributions, and the accumulated earnings of the hospital. A value greater than 50 percent indicates that more of the assets are financed by equity than by debt. Very high values may indicate opportunities for debt financing. A value less than 50 percent indicates that more of the assets are financed by debt than by equity. Very low values may indicate exposure to financial risk because debt service is a fixed charge. Definition Interpretation 2018 CAH median 59.69 %<br>
35
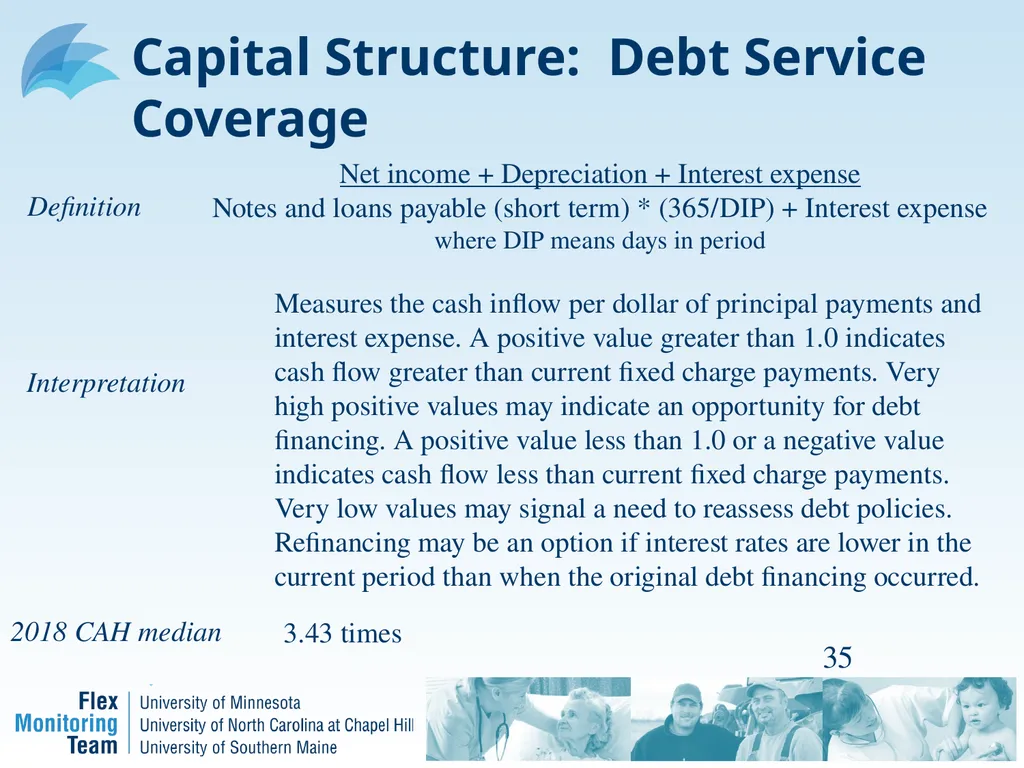
Capital Structure: Debt Service Coverage 35 Net income + Depreciation + Interest expense
Notes and loans payable (short term) * (365/DIP) + Interest expense where DIP means days in period Measures the cash inflow per dollar of principal payments and interest expense. A positive value greater than 1.0 indicates cash flow greater than current fixed charge payments. Very high positive values may indicate an opportunity for debt financing. A positive value less than 1.0 or a negative value indicates cash flow less than current fixed charge payments. Very low values may signal a need to reassess debt policies. Refinancing may be an option if interest rates are lower in the current period than when the original debt financing occurred. Definition Interpretation 2018 CAH median 3.43 times<br>
Notes and loans payable (short term) * (365/DIP) + Interest expense where DIP means days in period Measures the cash inflow per dollar of principal payments and interest expense. A positive value greater than 1.0 indicates cash flow greater than current fixed charge payments. Very high positive values may indicate an opportunity for debt financing. A positive value less than 1.0 or a negative value indicates cash flow less than current fixed charge payments. Very low values may signal a need to reassess debt policies. Refinancing may be an option if interest rates are lower in the current period than when the original debt financing occurred. Definition Interpretation 2018 CAH median 3.43 times<br>
36
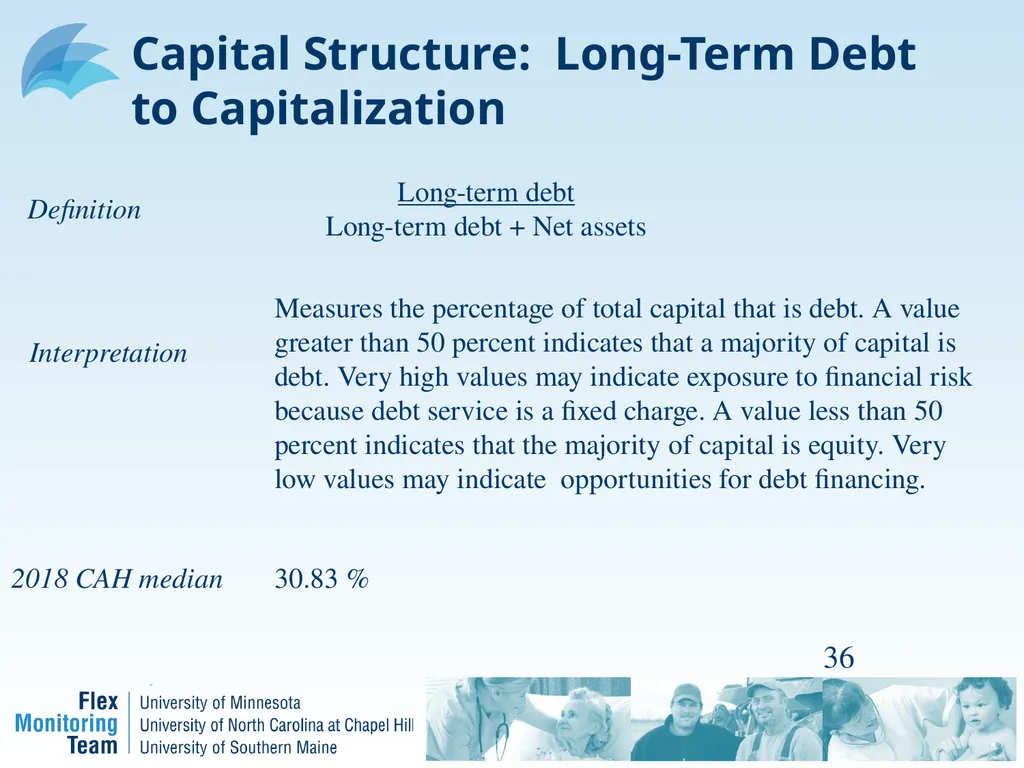
Capital Structure: Long-Term Debt to Capitalization 36 Long-term debt
Long-term debt + Net assets Measures the percentage of total capital that is debt. A value greater than 50 percent indicates that a majority of capital is debt. Very high values may indicate exposure to financial risk because debt service is a fixed charge. A value less than 50 percent indicates that the majority of capital is equity. Very low values may indicate opportunities for debt financing. Definition Interpretation 2018 CAH median 30.83 %<br>
Long-term debt + Net assets Measures the percentage of total capital that is debt. A value greater than 50 percent indicates that a majority of capital is debt. Very high values may indicate exposure to financial risk because debt service is a fixed charge. A value less than 50 percent indicates that the majority of capital is equity. Very low values may indicate opportunities for debt financing. Definition Interpretation 2018 CAH median 30.83 %<br>
37
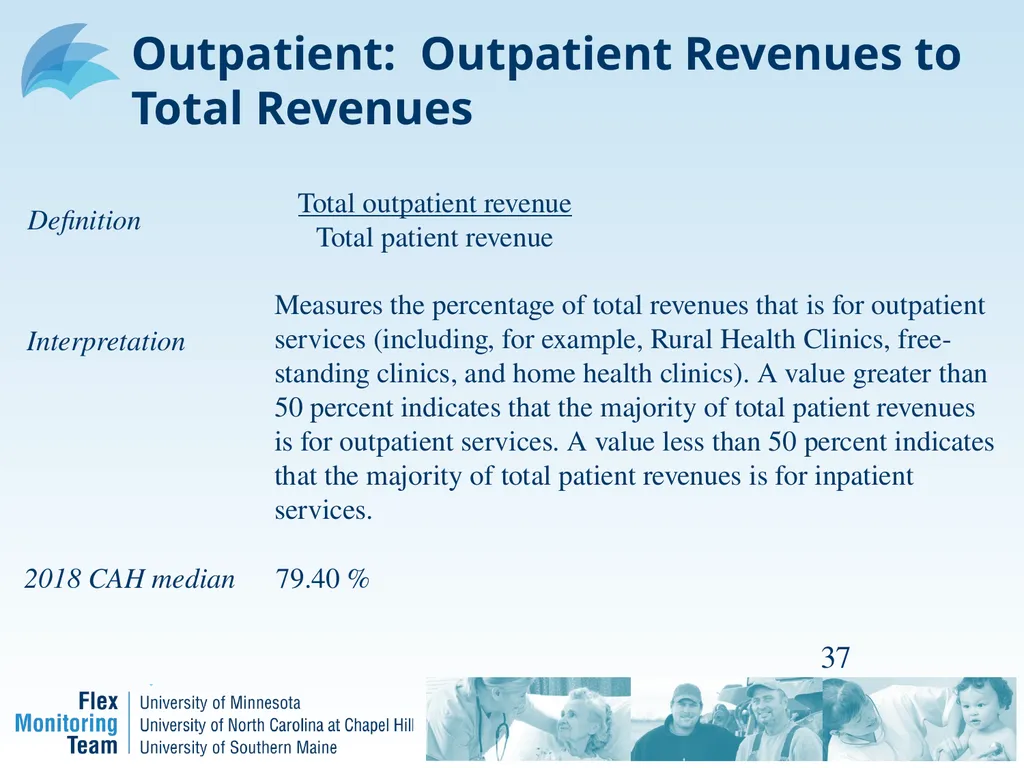
Outpatient: Outpatient Revenues to Total Revenues 37 Total outpatient revenue
Total patient revenue Measures the percentage of total revenues that is for outpatient services (including, for example, Rural Health Clinics, free-standing clinics, and home health clinics). A value greater than 50 percent indicates that the majority of total patient revenues is for outpatient services. A value less than 50 percent indicates that the majority of total patient revenues is for inpatient services. Definition Interpretation 2018 CAH median 79.40 %<br>
Total patient revenue Measures the percentage of total revenues that is for outpatient services (including, for example, Rural Health Clinics, free-standing clinics, and home health clinics). A value greater than 50 percent indicates that the majority of total patient revenues is for outpatient services. A value less than 50 percent indicates that the majority of total patient revenues is for inpatient services. Definition Interpretation 2018 CAH median 79.40 %<br>
38
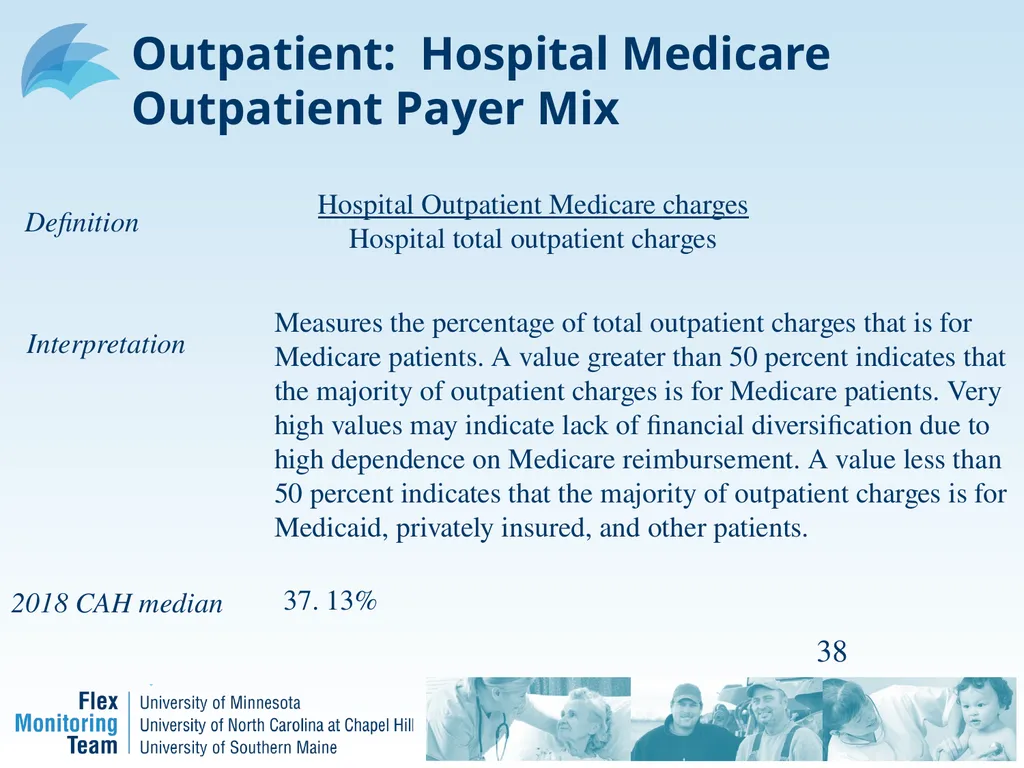
Outpatient: Hospital Medicare Outpatient Payer Mix 38 Hospital Outpatient Medicare charges
Hospital total outpatient charges Measures the percentage of total outpatient charges that is for Medicare patients. A value greater than 50 percent indicates that the majority of outpatient charges is for Medicare patients. Very high values may indicate lack of financial diversification due to high dependence on Medicare reimbursement. A value less than 50 percent indicates that the majority of outpatient charges is for Medicaid, privately insured, and other patients. Definition Interpretation 2018 CAH median 37. 13%<br>
Hospital total outpatient charges Measures the percentage of total outpatient charges that is for Medicare patients. A value greater than 50 percent indicates that the majority of outpatient charges is for Medicare patients. Very high values may indicate lack of financial diversification due to high dependence on Medicare reimbursement. A value less than 50 percent indicates that the majority of outpatient charges is for Medicaid, privately insured, and other patients. Definition Interpretation 2018 CAH median 37. 13%<br>
39
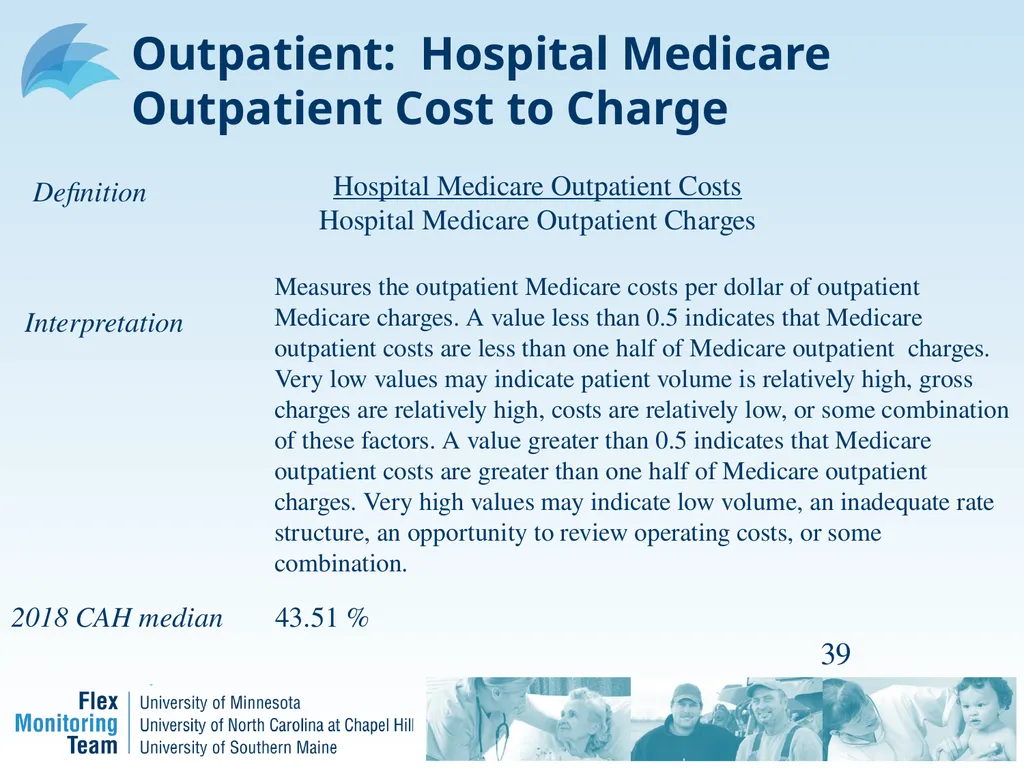
Outpatient: Hospital Medicare Outpatient Cost to Charge 39 Hospital Medicare Outpatient Costs
Hospital Medicare Outpatient Charges Measures the outpatient Medicare costs per dollar of outpatient Medicare charges. A value less than 0.5 indicates that Medicare outpatient costs are less than one half of Medicare outpatient charges. Very low values may indicate patient volume is relatively high, gross charges are relatively high, costs are relatively low, or some combination of these factors. A value greater than 0.5 indicates that Medicare outpatient costs are greater than one half of Medicare outpatient charges. Very high values may indicate low volume, an inadequate rate structure, an opportunity to review operating costs, or some combination. Definition Interpretation 2018 CAH median 43.51 %<br>
Hospital Medicare Outpatient Charges Measures the outpatient Medicare costs per dollar of outpatient Medicare charges. A value less than 0.5 indicates that Medicare outpatient costs are less than one half of Medicare outpatient charges. Very low values may indicate patient volume is relatively high, gross charges are relatively high, costs are relatively low, or some combination of these factors. A value greater than 0.5 indicates that Medicare outpatient costs are greater than one half of Medicare outpatient charges. Very high values may indicate low volume, an inadequate rate structure, an opportunity to review operating costs, or some combination. Definition Interpretation 2018 CAH median 43.51 %<br>
40
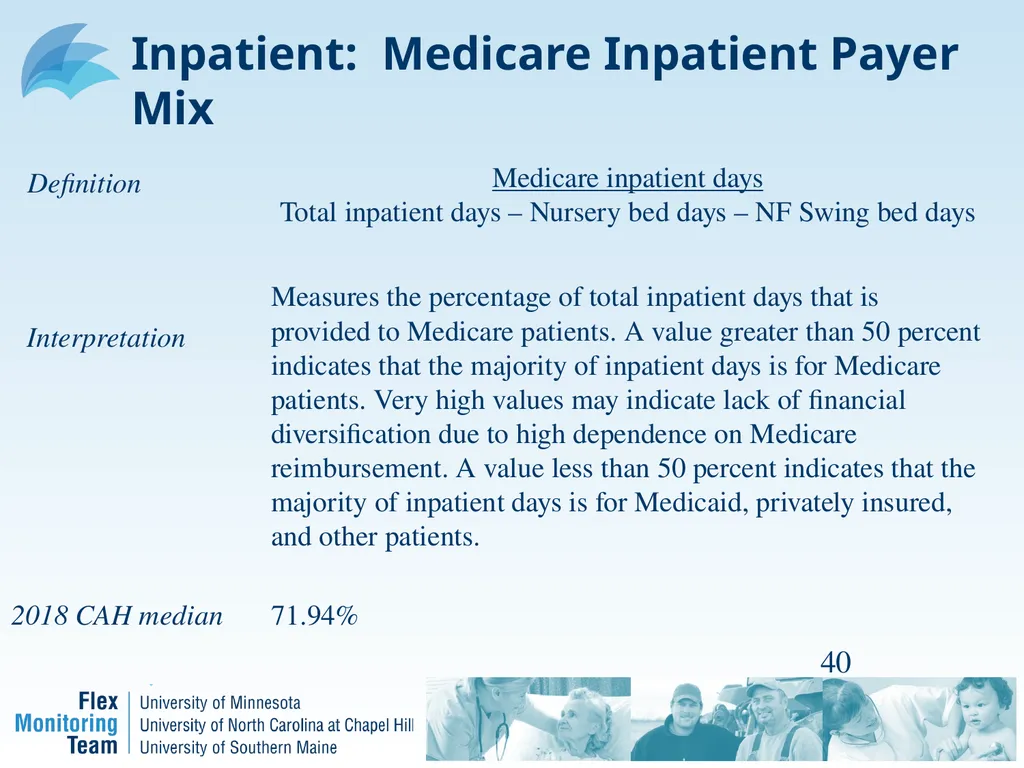
Inpatient: Medicare Inpatient Payer Mix 40 Medicare inpatient days
Total inpatient days – Nursery bed days – NF Swing bed days Measures the percentage of total inpatient days that is provided to Medicare patients. A value greater than 50 percent indicates that the majority of inpatient days is for Medicare patients. Very high values may indicate lack of financial diversification due to high dependence on Medicare reimbursement. A value less than 50 percent indicates that the majority of inpatient days is for Medicaid, privately insured, and other patients. Definition Interpretation 2018 CAH median 71.94%<br>
Total inpatient days – Nursery bed days – NF Swing bed days Measures the percentage of total inpatient days that is provided to Medicare patients. A value greater than 50 percent indicates that the majority of inpatient days is for Medicare patients. Very high values may indicate lack of financial diversification due to high dependence on Medicare reimbursement. A value less than 50 percent indicates that the majority of inpatient days is for Medicaid, privately insured, and other patients. Definition Interpretation 2018 CAH median 71.94%<br>
41
Inpatient: Medicare Acute Inpatient
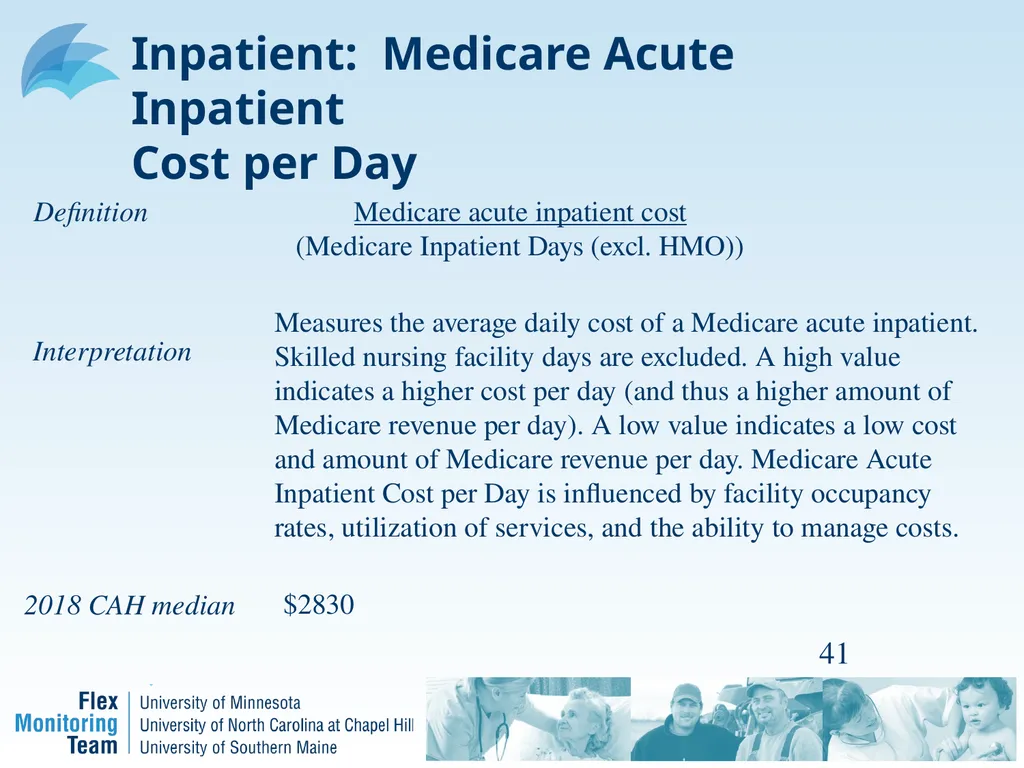
Cost per Day 41 Medicare acute inpatient cost
(Medicare Inpatient Days (excl. HMO)) Measures the average daily cost of a Medicare acute inpatient. Skilled nursing facility days are excluded. A high value indicates a higher cost per day (and thus a higher amount of Medicare revenue per day). A low value indicates a low cost and amount of Medicare revenue per day. Medicare Acute Inpatient Cost per Day is influenced by facility occupancy rates, utilization of services, and the ability to manage costs. Definition Interpretation 2018 CAH median $2830<br>
(Medicare Inpatient Days (excl. HMO)) Measures the average daily cost of a Medicare acute inpatient. Skilled nursing facility days are excluded. A high value indicates a higher cost per day (and thus a higher amount of Medicare revenue per day). A low value indicates a low cost and amount of Medicare revenue per day. Medicare Acute Inpatient Cost per Day is influenced by facility occupancy rates, utilization of services, and the ability to manage costs. Definition Interpretation 2018 CAH median $2830<br>
42
Inpatient:
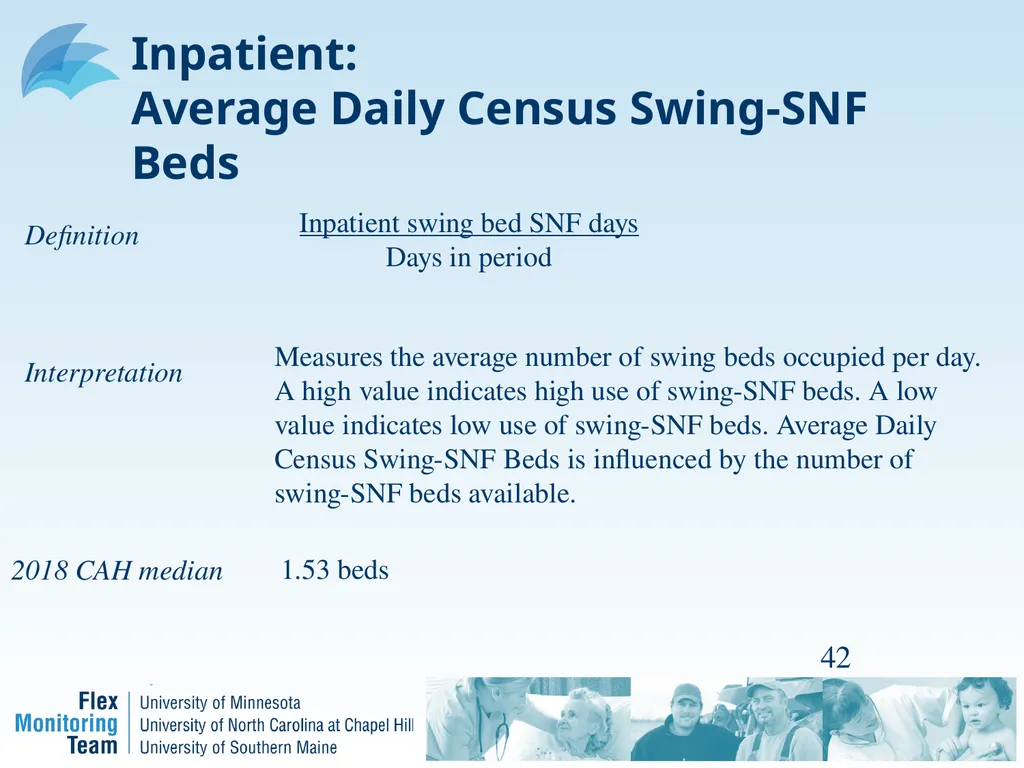
Average Daily Census Swing-SNF Beds 42 Inpatient swing bed SNF days
Days in period Measures the average number of swing beds occupied per day. A high value indicates high use of swing-SNF beds. A low value indicates low use of swing-SNF beds. Average Daily Census Swing-SNF Beds is influenced by the number of swing-SNF beds available. Definition Interpretation 2018 CAH median 1.53 beds<br>
Days in period Measures the average number of swing beds occupied per day. A high value indicates high use of swing-SNF beds. A low value indicates low use of swing-SNF beds. Average Daily Census Swing-SNF Beds is influenced by the number of swing-SNF beds available. Definition Interpretation 2018 CAH median 1.53 beds<br>
43
Inpatient:
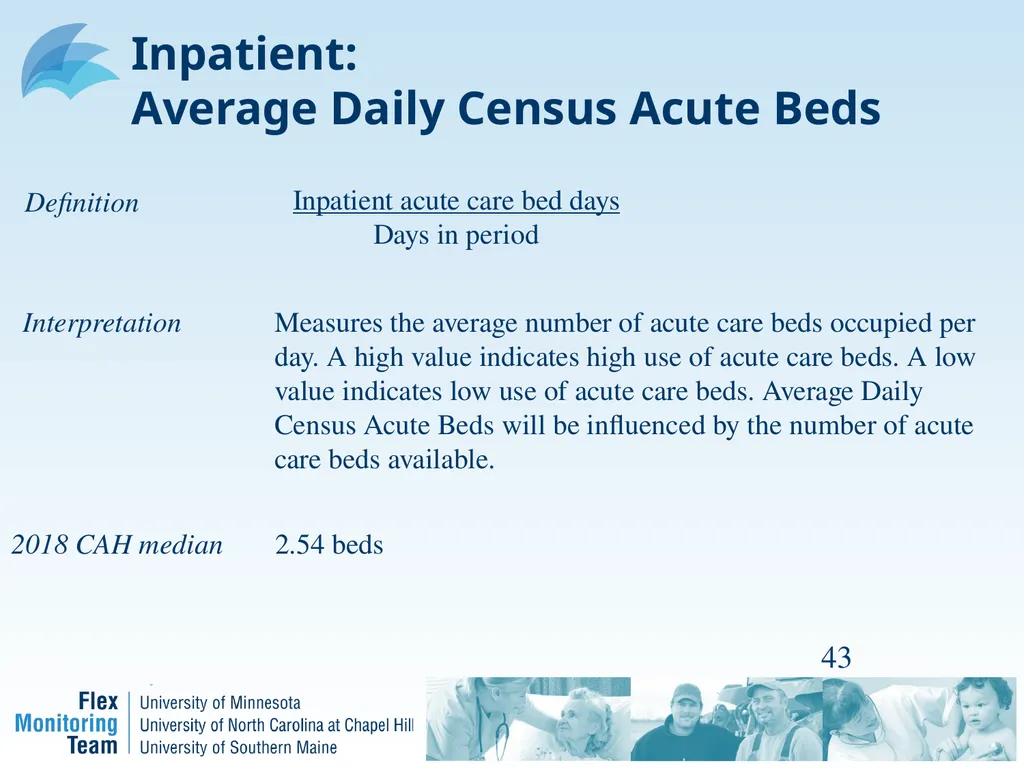
Average Daily Census Acute Beds 43 Inpatient acute care bed days
Days in period Measures the average number of acute care beds occupied per day. A high value indicates high use of acute care beds. A low value indicates low use of acute care beds. Average Daily Census Acute Beds will be influenced by the number of acute care beds available. Definition Interpretation 2018 CAH median 2.54 beds<br>
Days in period Measures the average number of acute care beds occupied per day. A high value indicates high use of acute care beds. A low value indicates low use of acute care beds. Average Daily Census Acute Beds will be influenced by the number of acute care beds available. Definition Interpretation 2018 CAH median 2.54 beds<br>
44
Growth:
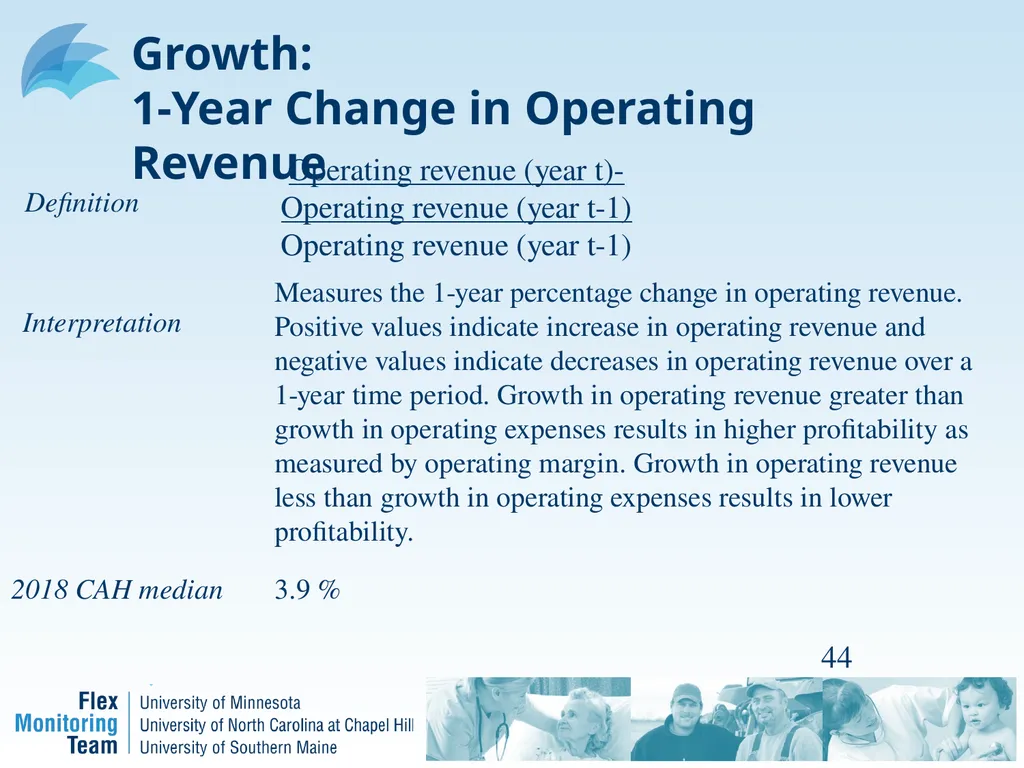
1-Year Change in Operating Revenue 44 Definition Interpretation 2018 CAH median 3.9 % Operating revenue (year t)- Operating revenue (year t-1)
Operating revenue (year t-1) Measures the 1-year percentage change in operating revenue. Positive values indicate increase in operating revenue and negative values indicate decreases in operating revenue over a 1-year time period. Growth in operating revenue greater than growth in operating expenses results in higher profitability as measured by operating margin. Growth in operating revenue less than growth in operating expenses results in lower profitability.<br>
Operating revenue (year t-1) Measures the 1-year percentage change in operating revenue. Positive values indicate increase in operating revenue and negative values indicate decreases in operating revenue over a 1-year time period. Growth in operating revenue greater than growth in operating expenses results in higher profitability as measured by operating margin. Growth in operating revenue less than growth in operating expenses results in lower profitability.<br>
45
Inpatient:
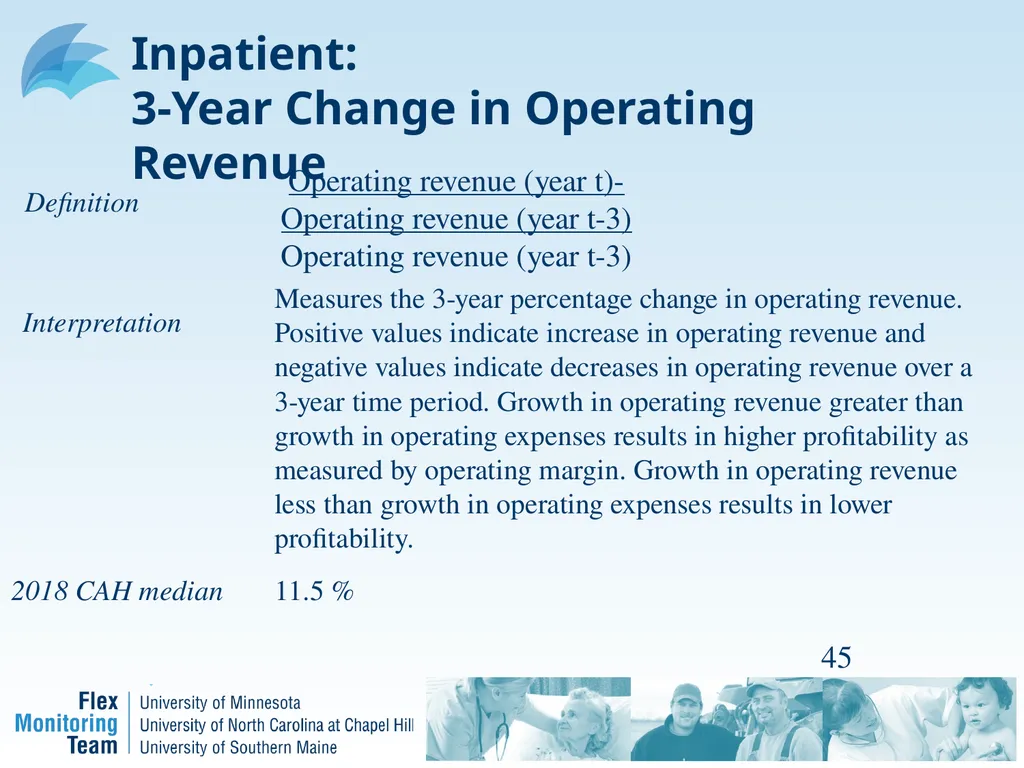
3-Year Change in Operating Revenue 45 Definition Interpretation 2018 CAH median 11.5 % Operating revenue (year t)- Operating revenue (year t-3)
Operating revenue (year t-3) Measures the 3-year percentage change in operating revenue. Positive values indicate increase in operating revenue and negative values indicate decreases in operating revenue over a 3-year time period. Growth in operating revenue greater than growth in operating expenses results in higher profitability as measured by operating margin. Growth in operating revenue less than growth in operating expenses results in lower profitability.<br>
Operating revenue (year t-3) Measures the 3-year percentage change in operating revenue. Positive values indicate increase in operating revenue and negative values indicate decreases in operating revenue over a 3-year time period. Growth in operating revenue greater than growth in operating expenses results in higher profitability as measured by operating margin. Growth in operating revenue less than growth in operating expenses results in lower profitability.<br>
46
Growth:
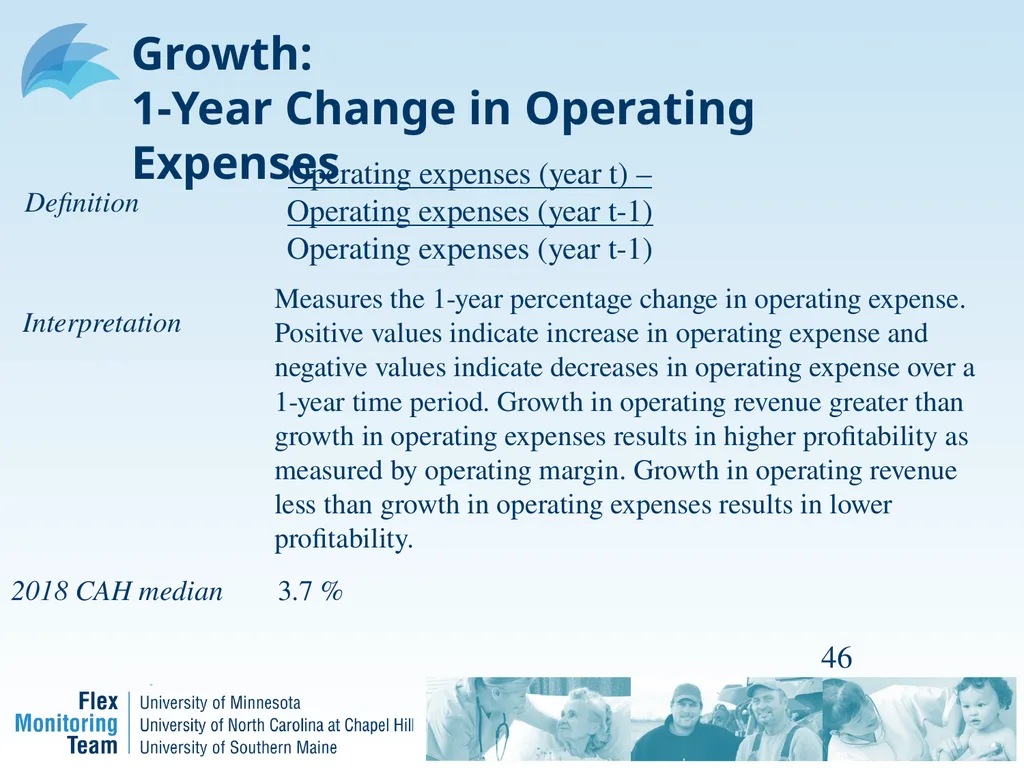
1-Year Change in Operating Expenses 46 Definition Interpretation 2018 CAH median 3.7 % Operating expenses (year t) – Operating expenses (year t-1)
Operating expenses (year t-1) Measures the 1-year percentage change in operating expense. Positive values indicate increase in operating expense and negative values indicate decreases in operating expense over a 1-year time period. Growth in operating revenue greater than growth in operating expenses results in higher profitability as measured by operating margin. Growth in operating revenue less than growth in operating expenses results in lower profitability.<br>
Operating expenses (year t-1) Measures the 1-year percentage change in operating expense. Positive values indicate increase in operating expense and negative values indicate decreases in operating expense over a 1-year time period. Growth in operating revenue greater than growth in operating expenses results in higher profitability as measured by operating margin. Growth in operating revenue less than growth in operating expenses results in lower profitability.<br>
47
Growth:
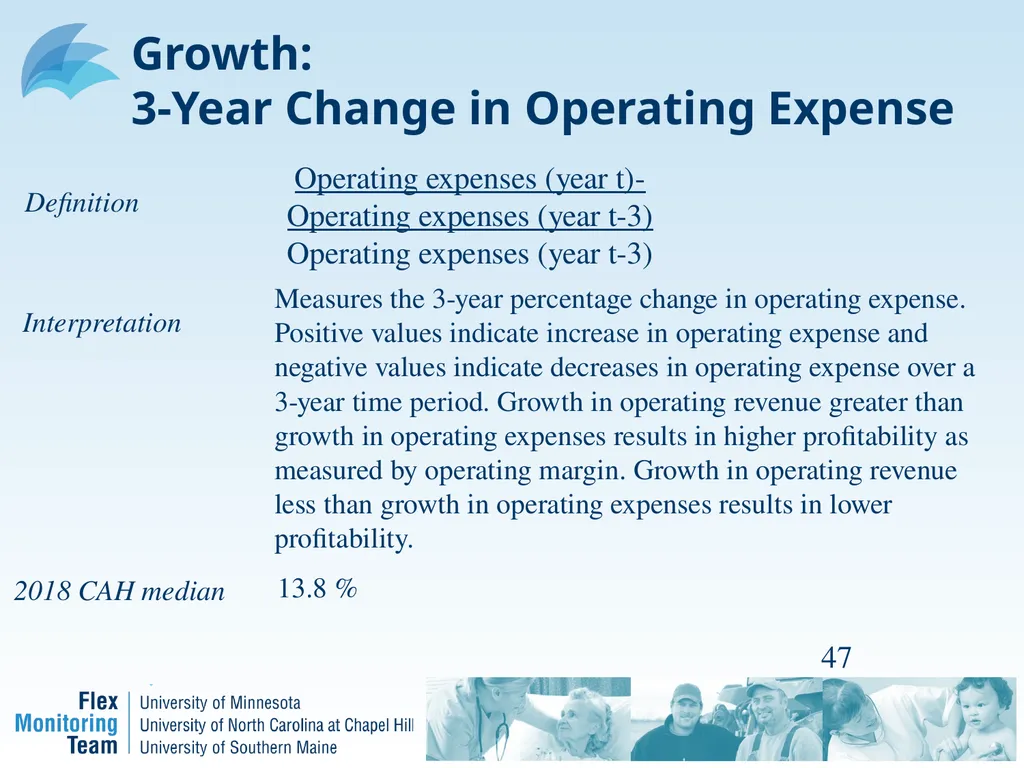
3-Year Change in Operating Expense 47 Definition Interpretation 2018 CAH median 13.8 % Operating expenses (year t)- Operating expenses (year t-3)
Operating expenses (year t-3) Measures the 3-year percentage change in operating expense. Positive values indicate increase in operating expense and negative values indicate decreases in operating expense over a 3-year time period. Growth in operating revenue greater than growth in operating expenses results in higher profitability as measured by operating margin. Growth in operating revenue less than growth in operating expenses results in lower profitability.<br>
Operating expenses (year t-3) Measures the 3-year percentage change in operating expense. Positive values indicate increase in operating expense and negative values indicate decreases in operating expense over a 3-year time period. Growth in operating revenue greater than growth in operating expenses results in higher profitability as measured by operating margin. Growth in operating revenue less than growth in operating expenses results in lower profitability.<br>
48
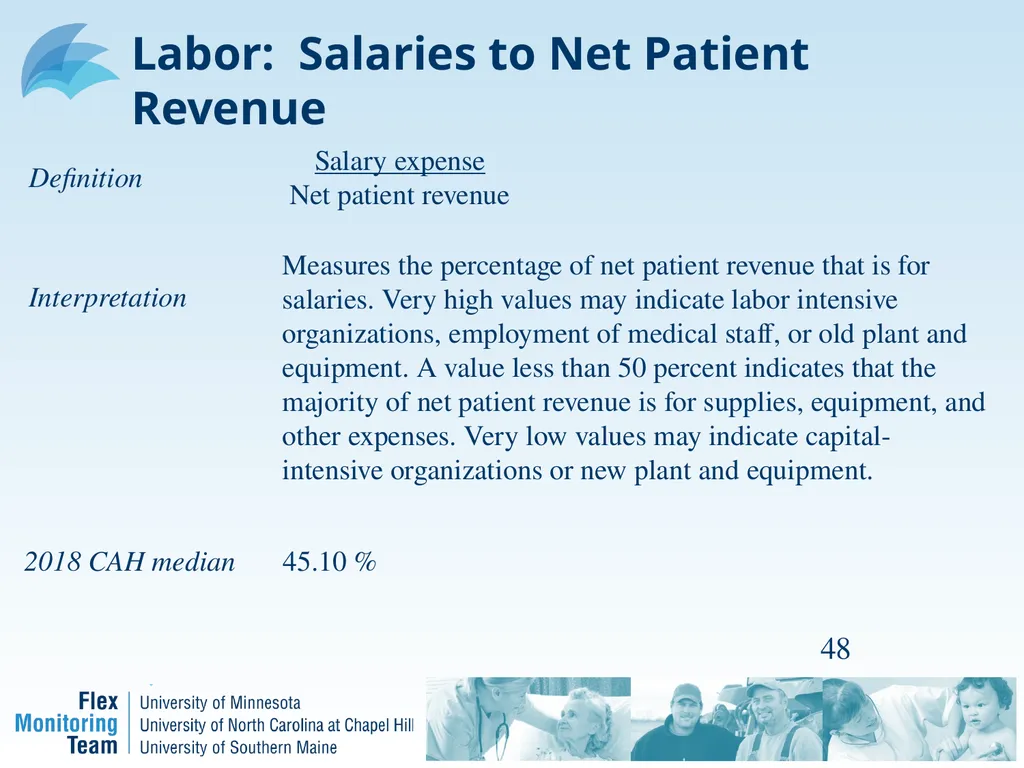
Labor: Salaries to Net Patient Revenue 48 Salary expense
Net patient revenue Measures the percentage of net patient revenue that is for salaries. Very high values may indicate labor intensive organizations, employment of medical staff, or old plant and equipment. A value less than 50 percent indicates that the majority of net patient revenue is for supplies, equipment, and other expenses. Very low values may indicate capital-intensive organizations or new plant and equipment. Definition Interpretation 45.10 % 2018 CAH median<br>
Net patient revenue Measures the percentage of net patient revenue that is for salaries. Very high values may indicate labor intensive organizations, employment of medical staff, or old plant and equipment. A value less than 50 percent indicates that the majority of net patient revenue is for supplies, equipment, and other expenses. Very low values may indicate capital-intensive organizations or new plant and equipment. Definition Interpretation 45.10 % 2018 CAH median<br>
49
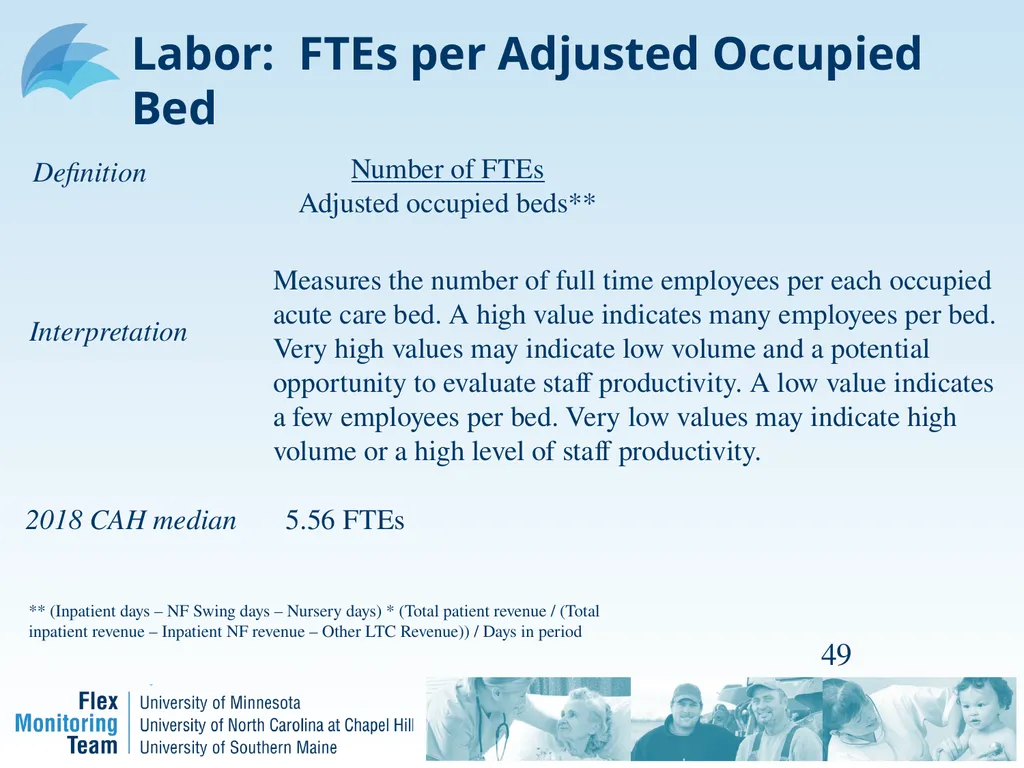
Labor: FTEs per Adjusted Occupied Bed 49 Number of FTEs
Adjusted occupied beds** Measures the number of full time employees per each occupied acute care bed. A high value indicates many employees per bed. Very high values may indicate low volume and a potential opportunity to evaluate staff productivity. A low value indicates a few employees per bed. Very low values may indicate high volume or a high level of staff productivity. Definition Interpretation ** (Inpatient days – NF Swing days – Nursery days) * (Total patient revenue / (Total inpatient revenue – Inpatient NF revenue – Other LTC Revenue)) / Days in period 2018 CAH median 5.56 FTEs<br>
Adjusted occupied beds** Measures the number of full time employees per each occupied acute care bed. A high value indicates many employees per bed. Very high values may indicate low volume and a potential opportunity to evaluate staff productivity. A low value indicates a few employees per bed. Very low values may indicate high volume or a high level of staff productivity. Definition Interpretation ** (Inpatient days – NF Swing days – Nursery days) * (Total patient revenue / (Total inpatient revenue – Inpatient NF revenue – Other LTC Revenue)) / Days in period 2018 CAH median 5.56 FTEs<br>
50
Labor: Average Salary per FTE 50 Salary Expense
Number of FTEs Measures the price and mix of labor. A high value indicates that a hospital pays above average wages / salaries and / or employs relatively more high skill occupations and / or experienced staff. A low value indicates a hospital pays below average wages / salaries and / or employs relatively fewer high skill occupations and / or experienced staff. Definition Interpretation 2018 CAH median $ 59370<br>
Number of FTEs Measures the price and mix of labor. A high value indicates that a hospital pays above average wages / salaries and / or employs relatively more high skill occupations and / or experienced staff. A low value indicates a hospital pays below average wages / salaries and / or employs relatively fewer high skill occupations and / or experienced staff. Definition Interpretation 2018 CAH median $ 59370<br>
51
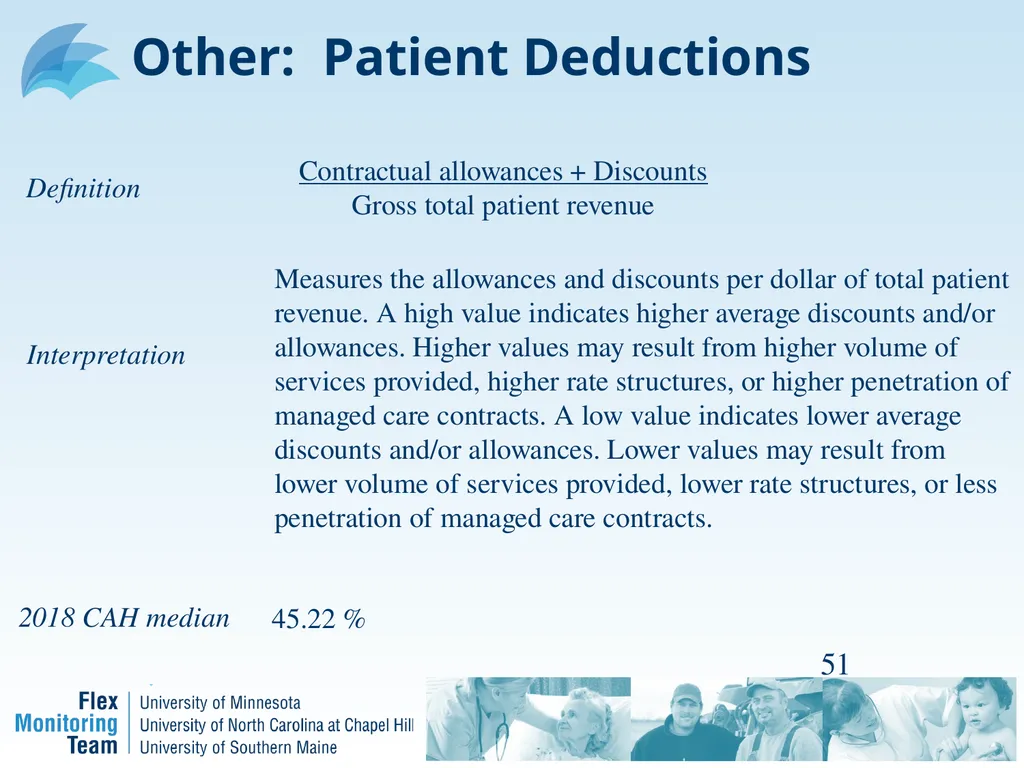
Other: Patient Deductions 51 Contractual allowances + Discounts
Gross total patient revenue Measures the allowances and discounts per dollar of total patient revenue. A high value indicates higher average discounts and/or allowances. Higher values may result from higher volume of services provided, higher rate structures, or higher penetration of managed care contracts. A low value indicates lower average discounts and/or allowances. Lower values may result from lower volume of services provided, lower rate structures, or less penetration of managed care contracts. Definition Interpretation 2018 CAH median 45.22 %<br>
Gross total patient revenue Measures the allowances and discounts per dollar of total patient revenue. A high value indicates higher average discounts and/or allowances. Higher values may result from higher volume of services provided, higher rate structures, or higher penetration of managed care contracts. A low value indicates lower average discounts and/or allowances. Lower values may result from lower volume of services provided, lower rate structures, or less penetration of managed care contracts. Definition Interpretation 2018 CAH median 45.22 %<br>
52
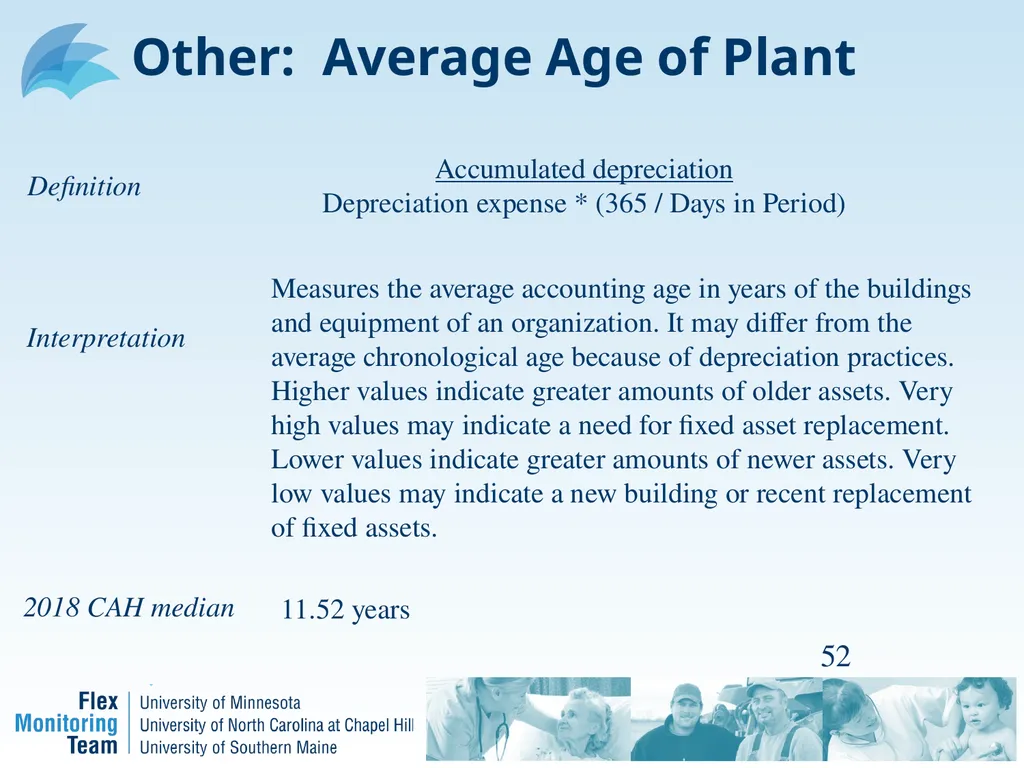
Other: Average Age of Plant 52 Accumulated depreciation
Depreciation expense * (365 / Days in Period) Measures the average accounting age in years of the buildings and equipment of an organization. It may differ from the average chronological age because of depreciation practices. Higher values indicate greater amounts of older assets. Very high values may indicate a need for fixed asset replacement. Lower values indicate greater amounts of newer assets. Very low values may indicate a new building or recent replacement of fixed assets. Definition Interpretation 2018 CAH median 11.52 years<br>
Depreciation expense * (365 / Days in Period) Measures the average accounting age in years of the buildings and equipment of an organization. It may differ from the average chronological age because of depreciation practices. Higher values indicate greater amounts of older assets. Very high values may indicate a need for fixed asset replacement. Lower values indicate greater amounts of newer assets. Very low values may indicate a new building or recent replacement of fixed assets. Definition Interpretation 2018 CAH median 11.52 years<br>
53
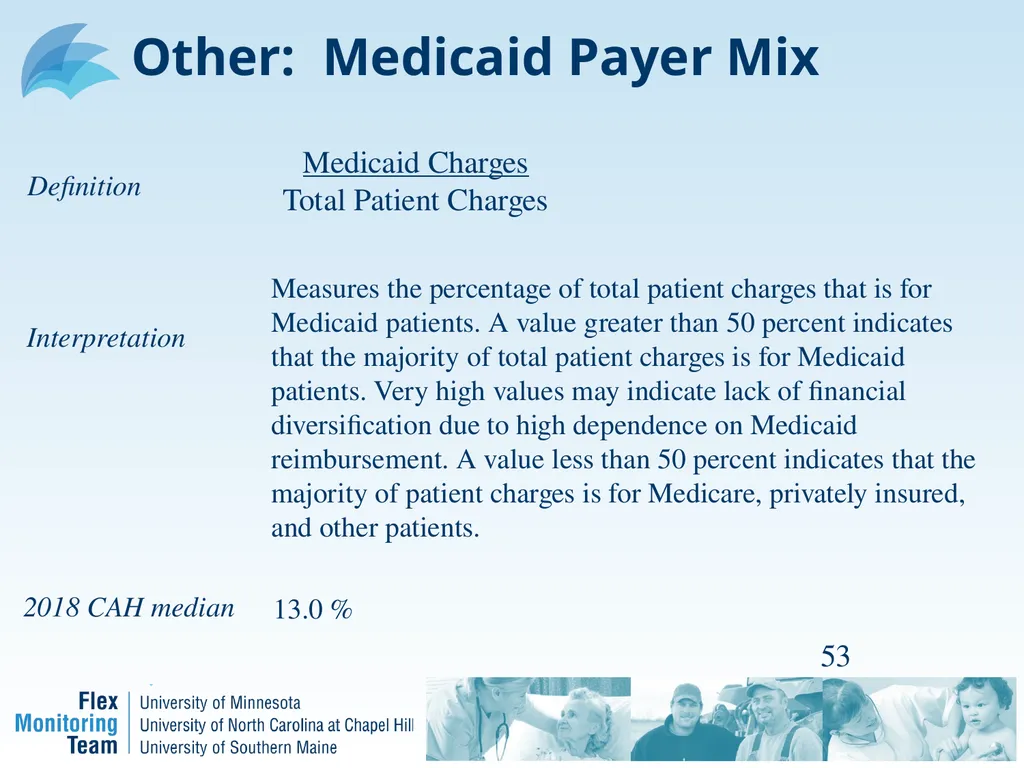
Other: Medicaid Payer Mix 53 Definition Interpretation 2018 CAH median 13.0 % Medicaid Charges
Total Patient Charges Measures the percentage of total patient charges that is for Medicaid patients. A value greater than 50 percent indicates that the majority of total patient charges is for Medicaid patients. Very high values may indicate lack of financial diversification due to high dependence on Medicaid reimbursement. A value less than 50 percent indicates that the majority of patient charges is for Medicare, privately insured, and other patients.<br>
Total Patient Charges Measures the percentage of total patient charges that is for Medicaid patients. A value greater than 50 percent indicates that the majority of total patient charges is for Medicaid patients. Very high values may indicate lack of financial diversification due to high dependence on Medicaid reimbursement. A value less than 50 percent indicates that the majority of patient charges is for Medicare, privately insured, and other patients.<br>
54
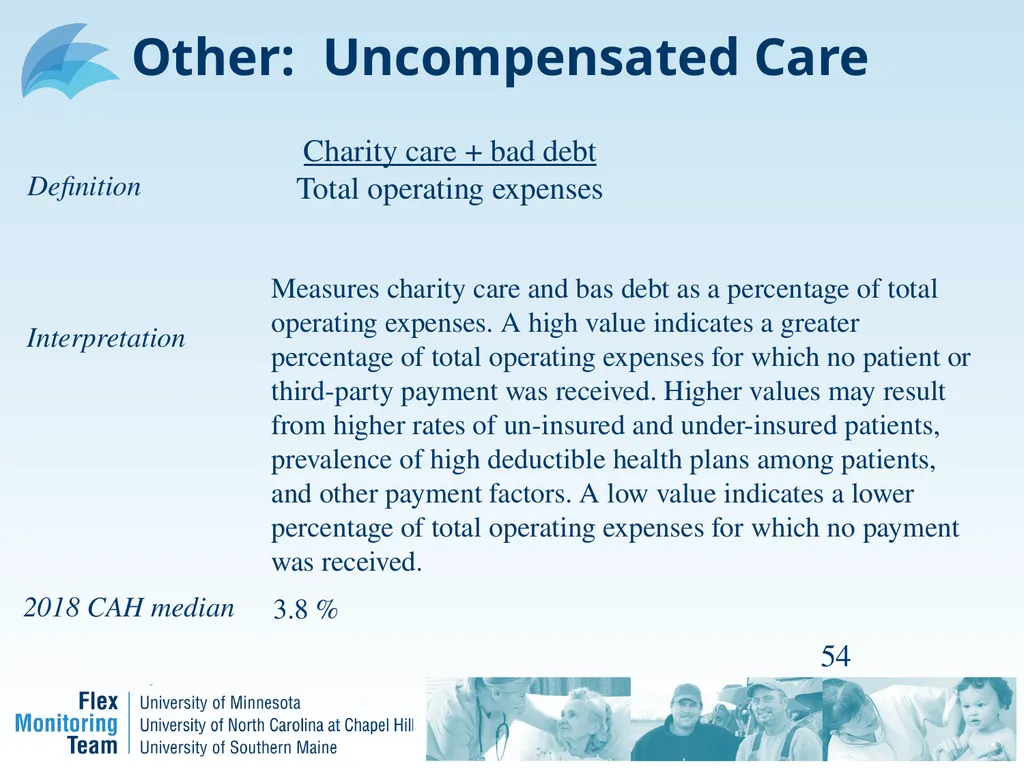
Other: Uncompensated Care 54 Definition Interpretation 2018 CAH median 3.8 % Charity care + bad debt
Total operating expenses Measures charity care and bas debt as a percentage of total operating expenses. A high value indicates a greater percentage of total operating expenses for which no patient or third-party payment was received. Higher values may result from higher rates of un-insured and under-insured patients, prevalence of high deductible health plans among patients, and other payment factors. A low value indicates a lower percentage of total operating expenses for which no payment was received.<br>
Total operating expenses Measures charity care and bas debt as a percentage of total operating expenses. A high value indicates a greater percentage of total operating expenses for which no patient or third-party payment was received. Higher values may result from higher rates of un-insured and under-insured patients, prevalence of high deductible health plans among patients, and other payment factors. A low value indicates a lower percentage of total operating expenses for which no payment was received.<br>
55
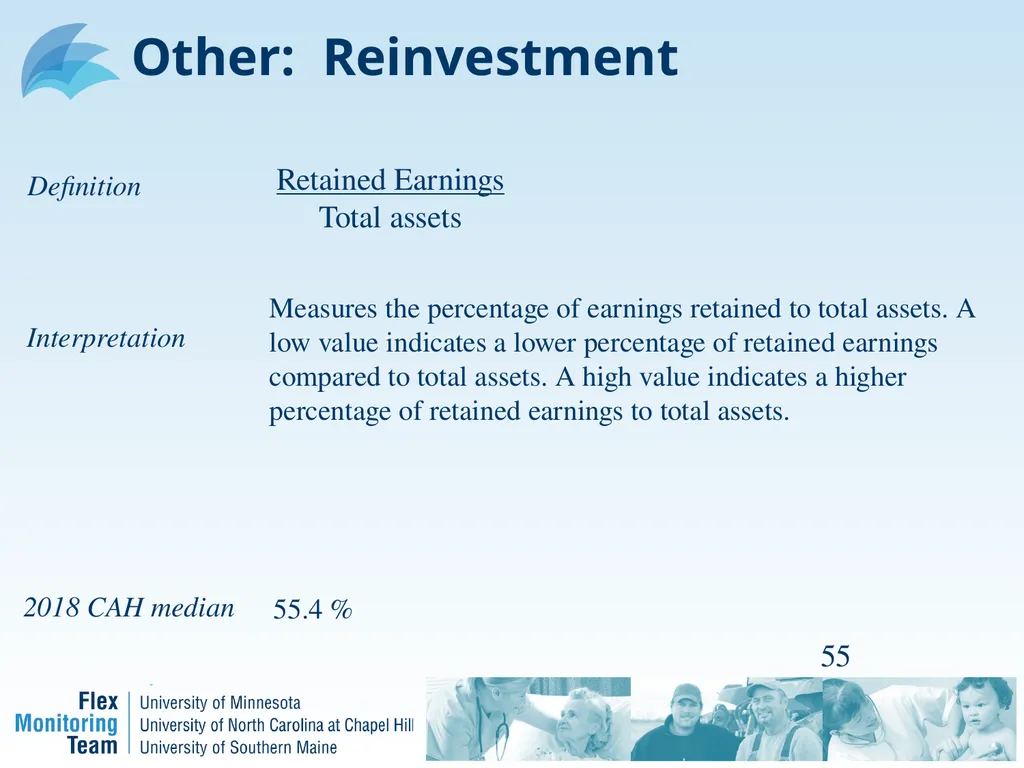
Other: Reinvestment 55 Definition Interpretation 2018 CAH median 55.4 % Retained Earnings
Total assets Measures the percentage of earnings retained to total assets. A low value indicates a lower percentage of retained earnings compared to total assets. A high value indicates a higher percentage of retained earnings to total assets.<br>
Total assets Measures the percentage of earnings retained to total assets. A low value indicates a lower percentage of retained earnings compared to total assets. A high value indicates a higher percentage of retained earnings to total assets.<br>
56
Pink GH, Holmes GM, Thompson RE, Slifkin RT. Variations in Financial Performance Among Critical Access Hospitals. Journal of Rural Health 23(4), 299-305, Fall 2007 4. How to compare CAH financial performance using peer groups 56<br>
57
First Issue of the CAH
Financial Indicators Report In Summer 2004, hospital-specific reports were sent to 853 administrators
An evaluation form was included
Many respondents requested comparison of their performance to similar CAHs 57<br>
An evaluation form was included
Many respondents requested comparison of their performance to similar CAHs 57<br>
58
Selection of CAH Peer Groups Suggestions from respondents
Literature review to identify important peer groups in other studies
Advice of Technical Advisory Group
Potential peer groups evaluated using statistical analysis
Limited to ones that can be pulled from Medicare Cost Report (or similar)
Selected peer groups:
Important influences on indicator values
Could be validly defined from Cost Reports 58<br>
Literature review to identify important peer groups in other studies
Advice of Technical Advisory Group
Potential peer groups evaluated using statistical analysis
Limited to ones that can be pulled from Medicare Cost Report (or similar)
Selected peer groups:
Important influences on indicator values
Could be validly defined from Cost Reports 58<br>
59
Creation of CAH Peer Groups From Medicare Cost Report data, we identified factors important to CAH financial performance:
Had <$10 million, $10-20 million, or >$20 million in net patient revenue
Provided long-term care
Was owned by a government entity
Operated a Rural Health Clinic 59<br>
Had <$10 million, $10-20 million, or >$20 million in net patient revenue
Provided long-term care
Was owned by a government entity
Operated a Rural Health Clinic 59<br>
60
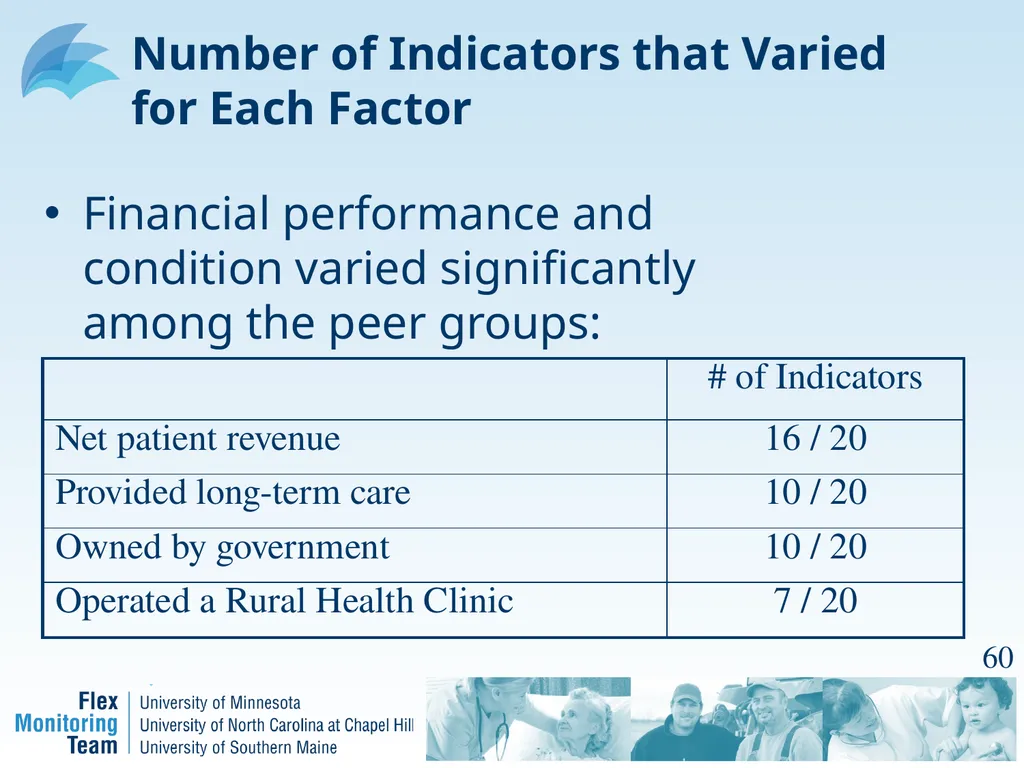
Number of Indicators that Varied for Each Factor Financial performance and condition varied significantly among the peer groups: 60<br>
61
Creation of CAH Peer Groups All combinations of the four factors were used to create 24 (=3*2*2*2) peer groups
Every CAH was assigned to one of the 24 peer groups
Indicator medians were calculated for each peer group 61<br>
Every CAH was assigned to one of the 24 peer groups
Indicator medians were calculated for each peer group 61<br>
62
Second Issue of the CAH Financial Indicators Report In Summer 2005, hospital-specific reports were sent to 1,029 administrators
Peer group, state, and national medians
Summary graph of performance relative to peer group
An evaluation form was included and most respondents affirmed the selected peer groups
Many wanted peer group comparisons for CAHs in their state 62<br>
Peer group, state, and national medians
Summary graph of performance relative to peer group
An evaluation form was included and most respondents affirmed the selected peer groups
Many wanted peer group comparisons for CAHs in their state 62<br>
63
Variation by Peer Groups Generally, hospitals with:
more revenue,
no long term care,
no rural clinic, and
not government owned
Do “better” 63<br>
more revenue,
no long term care,
no rural clinic, and
not government owned
Do “better” 63<br>
64
Net Patient Revenues Larger CAHs were more profitable and could carry more debt, possibly because:
More diagnostic and outpatient services
Higher charges, lower costs, or both
Lower proportion of Medicare patients
Higher patient volume generates higher total revenue and lower fixed costs per patient
Other reasons? 64<br>
More diagnostic and outpatient services
Higher charges, lower costs, or both
Lower proportion of Medicare patients
Higher patient volume generates higher total revenue and lower fixed costs per patient
Other reasons? 64<br>
65
Net Patient Revenues Larger CAHs also had:
Higher Medicare revenue per day (greater patient acuity, ICU/specialty service, higher wages in larger communities?)
Lower salaries to total expenses (more equipment, higher drug costs?)
Newer average age of plant (greater debt capacity?) 65<br>
Higher Medicare revenue per day (greater patient acuity, ICU/specialty service, higher wages in larger communities?)
Lower salaries to total expenses (more equipment, higher drug costs?)
Newer average age of plant (greater debt capacity?) 65<br>
66
Provided Long-Term Care CAHs that provided long-term care were less profitable, possibly because:
Higher proportion of Medicaid patients
Medicare Cost Report accounting methods
Lower patient volume
Other reasons? 66<br>
Higher proportion of Medicaid patients
Medicare Cost Report accounting methods
Lower patient volume
Other reasons? 66<br>
67
Provided Long-Term Care CAHs that provided long-term care also had:
Lower days revenue in accounts receivable (long-term care bills submitted prior to service?)
Lower outpatient revenue to total revenue (long-term care revenue is in the denominator)
Higher salaries to total expenses (high touch / low tech nature of long-term care?) 67<br>
Lower days revenue in accounts receivable (long-term care bills submitted prior to service?)
Lower outpatient revenue to total revenue (long-term care revenue is in the denominator)
Higher salaries to total expenses (high touch / low tech nature of long-term care?) 67<br>
68
Owned by Government CAHs that were owned by government were less profitable but more liquid, possibly because:
Higher charges, lower costs, or both
Lower patient volume
Other reasons?
CAHs that were owned by government also had:
Higher current ratio (lower use of debt)
Older average age of plant (lower use of debt?) 68<br>
Higher charges, lower costs, or both
Lower patient volume
Other reasons?
CAHs that were owned by government also had:
Higher current ratio (lower use of debt)
Older average age of plant (lower use of debt?) 68<br>
69
Operated a Rural Health Clinic CAHs that operated a Rural Health Clinic were less profitable, possibly because:
Lower proportion of inpatients with commercial insurance
Lower patient volume
Other reasons?
CAHs that operated a Rural Health Clinic also had:
Higher salaries to total expenses (physician compensation in numerator?) 69<br>
Lower proportion of inpatients with commercial insurance
Lower patient volume
Other reasons?
CAHs that operated a Rural Health Clinic also had:
Higher salaries to total expenses (physician compensation in numerator?) 69<br>
70
Implications for SFCs CAHs are not all the same - significant differences in financial performance and condition exist among CAH peer groups
May be misleading or unfair to compare the financial performance of a smaller CAH to a larger CAH, a CAH that does not provide LTC to a CAH that provides LTC, and so on 70<br>
May be misleading or unfair to compare the financial performance of a smaller CAH to a larger CAH, a CAH that does not provide LTC to a CAH that provides LTC, and so on 70<br>
71
Pink GH, Holmes GM, Slifkin RT, Thompson RE. Developing Financial Benchmarks for Critical Access Hospitals. Health Care Financing Review 30(3), Spring 2009. 5. How to evaluate CAH financial
performance using benchmarks 71<br>
72
CAH-Specific Benchmarks Benchmarks (standards, or goals, for the financial indicators that hospitals can evaluate against) can be useful tools for administrators
Otherwise might think they’re doing “pretty well ”
No good financial benchmarks for CAHs existed; we wanted benchmarks
Established by a large sample of informed practitioners versus academic black box or arbitrary rankings
Focus on absolute versus relative performance
Provide CAHs with ongoing management tool 72<br>
Otherwise might think they’re doing “pretty well ”
No good financial benchmarks for CAHs existed; we wanted benchmarks
Established by a large sample of informed practitioners versus academic black box or arbitrary rankings
Focus on absolute versus relative performance
Provide CAHs with ongoing management tool 72<br>
73
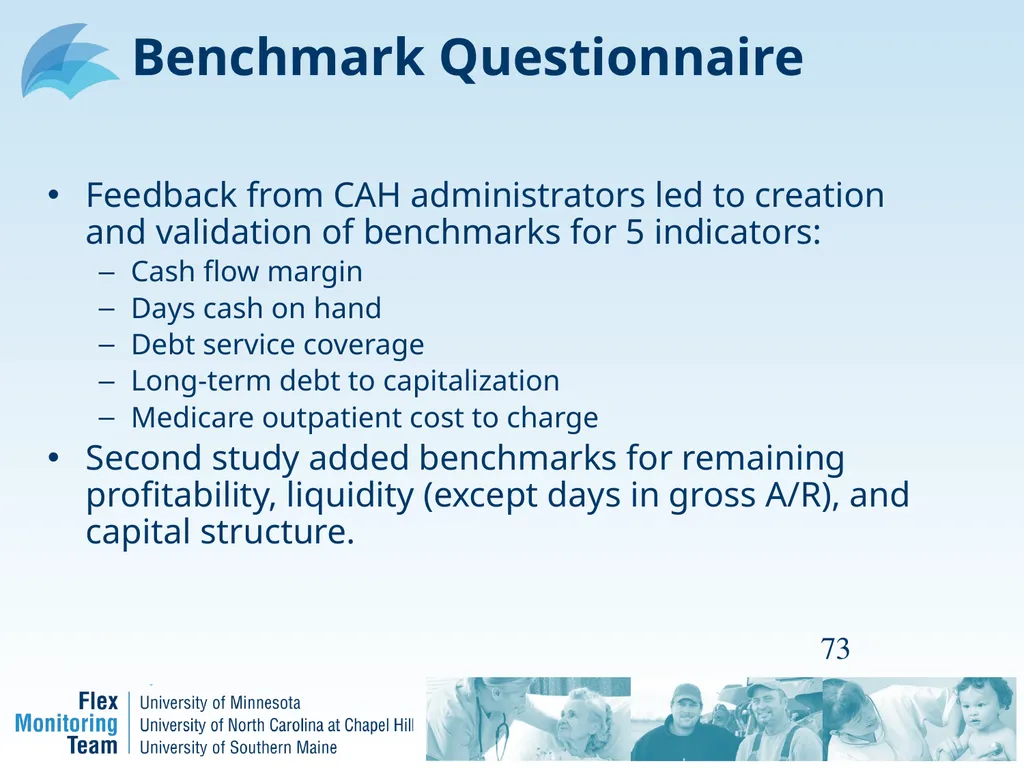
Benchmark Questionnaire Feedback from CAH administrators led to creation and validation of benchmarks for 5 indicators:
Cash flow margin
Days cash on hand
Debt service coverage
Long-term debt to capitalization
Medicare outpatient cost to charge
Second study added benchmarks for remaining profitability, liquidity (except days in gross A/R), and capital structure. 73<br>
Cash flow margin
Days cash on hand
Debt service coverage
Long-term debt to capitalization
Medicare outpatient cost to charge
Second study added benchmarks for remaining profitability, liquidity (except days in gross A/R), and capital structure. 73<br>
74
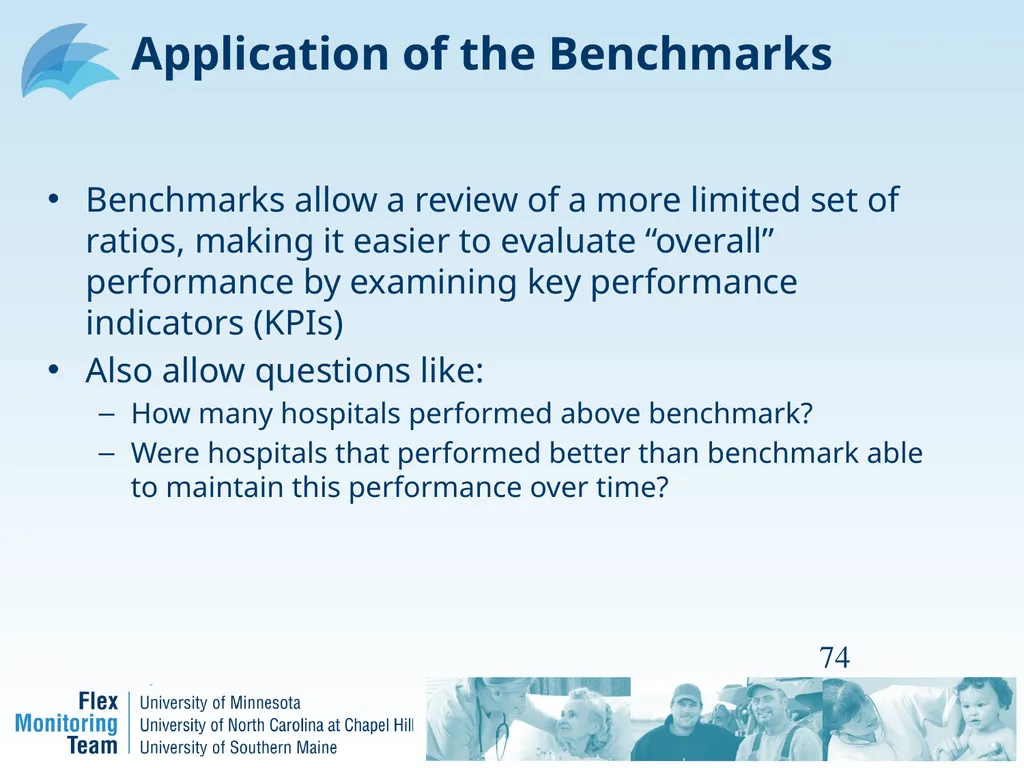
Application of the Benchmarks Benchmarks allow a review of a more limited set of ratios, making it easier to evaluate “overall” performance by examining key performance indicators (KPIs)
Also allow questions like:
How many hospitals performed above benchmark?
Were hospitals that performed better than benchmark able to maintain this performance over time? 74<br>
Also allow questions like:
How many hospitals performed above benchmark?
Were hospitals that performed better than benchmark able to maintain this performance over time? 74<br>
75
Developing Financial Benchmarks for Critical Access Hospitals
GH Pink, GM Holmes, RT Slifkin, and RE Thompson
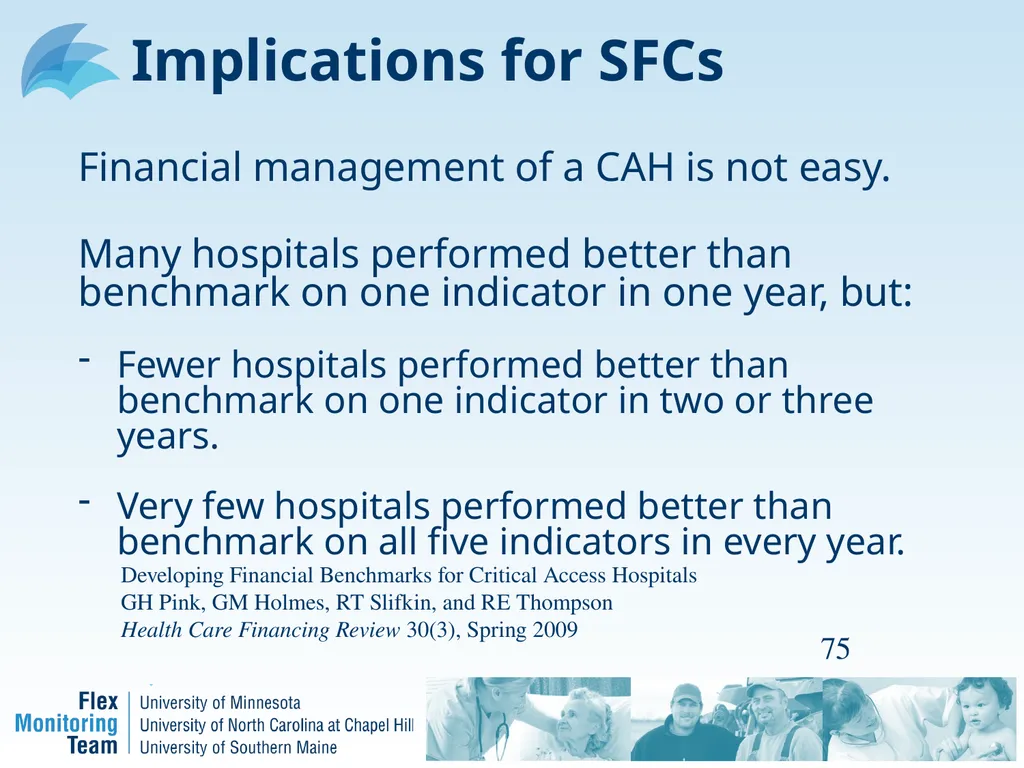
Health Care Financing Review 30(3), Spring 2009 Implications for SFCs Financial management of a CAH is not easy.
Many hospitals performed better than benchmark on one indicator in one year, but:
Fewer hospitals performed better than benchmark on one indicator in two or three years.
Very few hospitals performed better than benchmark on all five indicators in every year. 75<br>
GH Pink, GM Holmes, RT Slifkin, and RE Thompson
Health Care Financing Review 30(3), Spring 2009 Implications for SFCs Financial management of a CAH is not easy.
Many hospitals performed better than benchmark on one indicator in one year, but:
Fewer hospitals performed better than benchmark on one indicator in two or three years.
Very few hospitals performed better than benchmark on all five indicators in every year. 75<br>
76
76 6. How SFCs can use the
Financial Indicators in CAHMPAS:
An example 76<br>
77
Their Hospital Let’s look at indicator values for Their Hospital
What do you think about the financial performance and condition of Their Hospital? 77 - Profitability
- Liquidity
- Capital structure<br>
What do you think about the financial performance and condition of Their Hospital? 77 - Profitability
- Liquidity
- Capital structure<br>
78
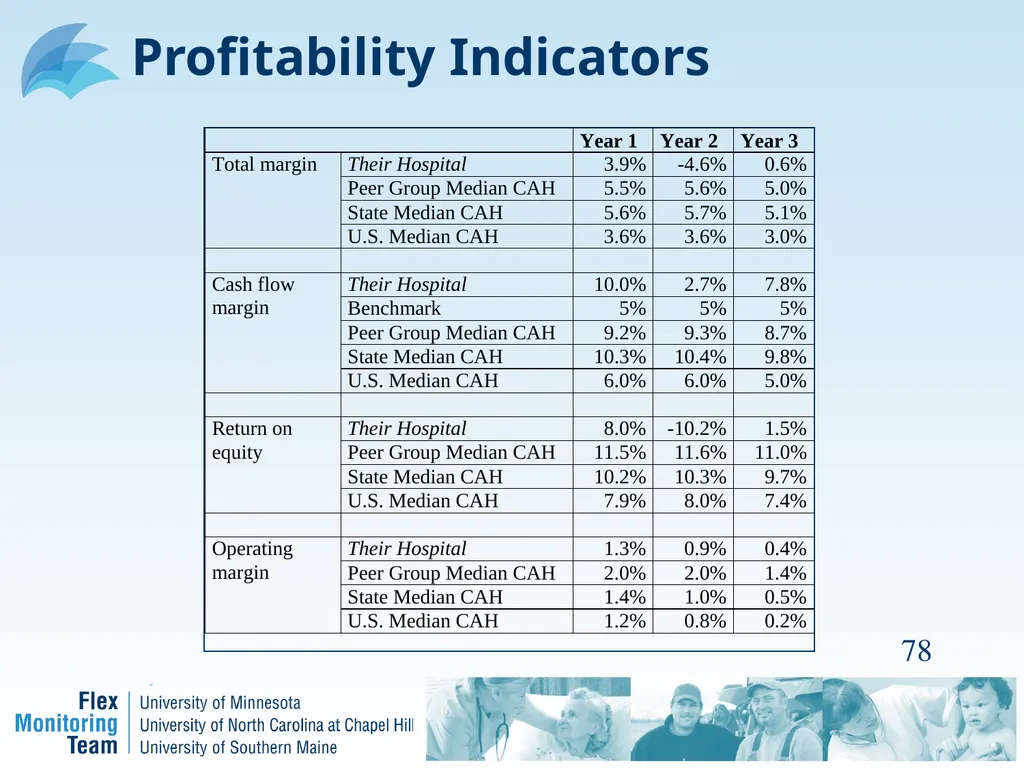
Profitability Indicators 78<br>
79
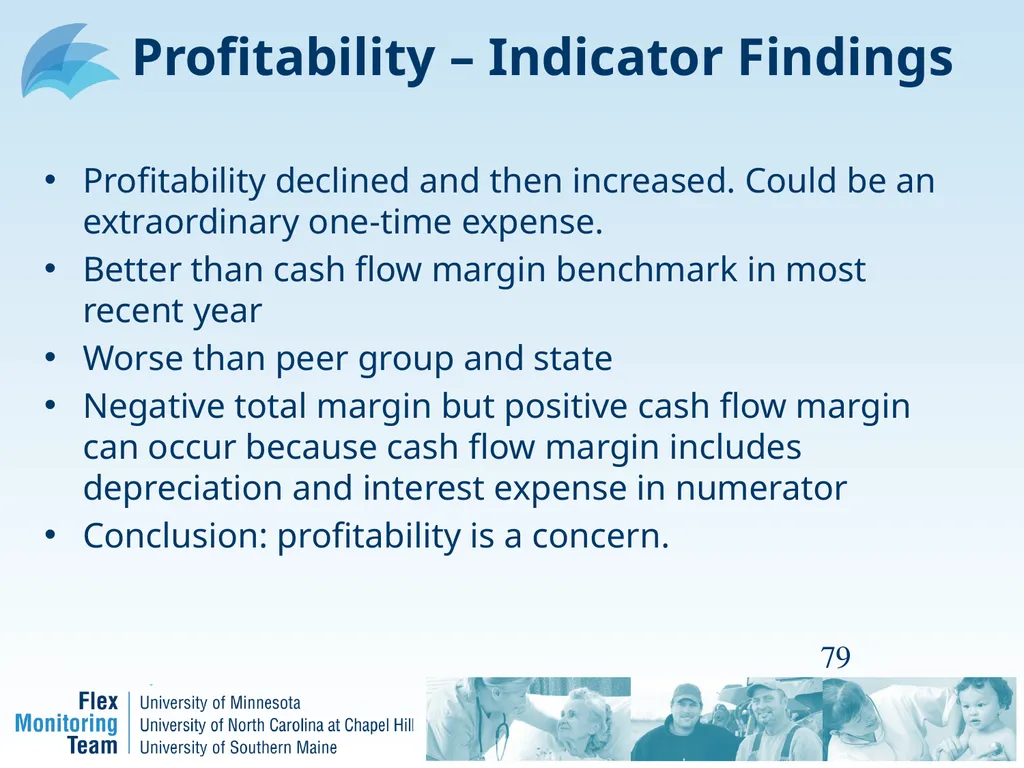
Profitability – Indicator Findings Profitability declined and then increased. Could be an extraordinary one-time expense.
Better than cash flow margin benchmark in most recent year
Worse than peer group and state
Negative total margin but positive cash flow margin can occur because cash flow margin includes depreciation and interest expense in numerator
Conclusion: profitability is a concern. 79<br>
Better than cash flow margin benchmark in most recent year
Worse than peer group and state
Negative total margin but positive cash flow margin can occur because cash flow margin includes depreciation and interest expense in numerator
Conclusion: profitability is a concern. 79<br>
80
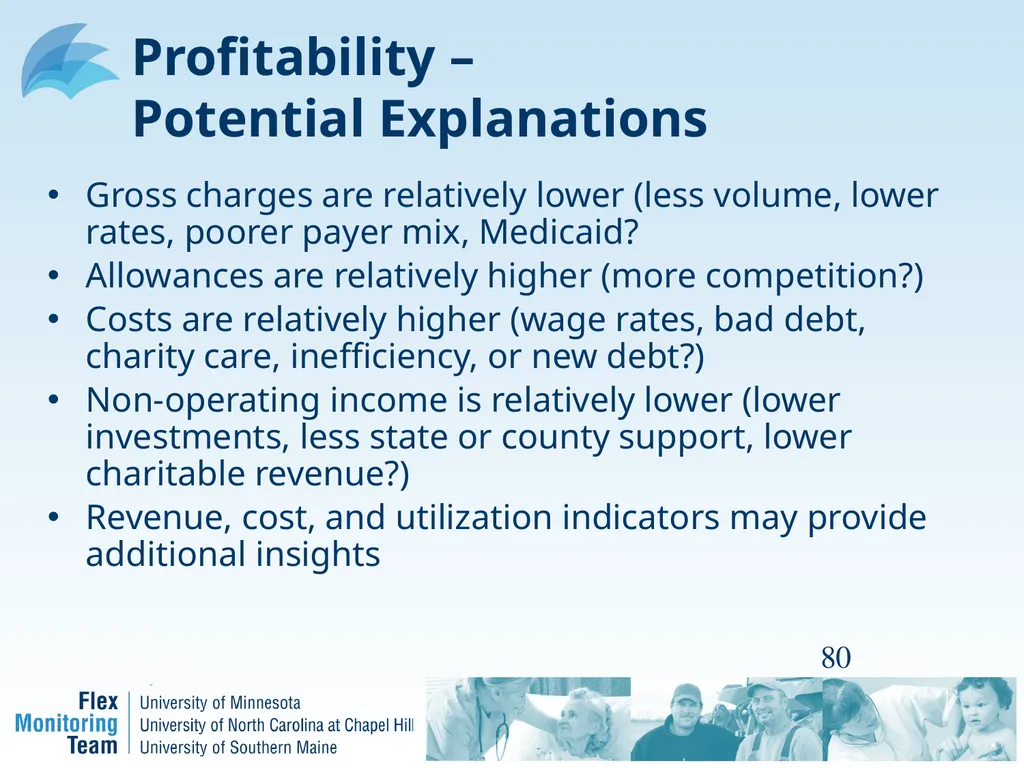
Profitability –
Potential Explanations Gross charges are relatively lower (less volume, lower rates, poorer payer mix, Medicaid?
Allowances are relatively higher (more competition?)
Costs are relatively higher (wage rates, bad debt, charity care, inefficiency, or new debt?)
Non-operating income is relatively lower (lower investments, less state or county support, lower charitable revenue?)
Revenue, cost, and utilization indicators may provide additional insights 80<br>
Allowances are relatively higher (more competition?)
Costs are relatively higher (wage rates, bad debt, charity care, inefficiency, or new debt?)
Non-operating income is relatively lower (lower investments, less state or county support, lower charitable revenue?)
Revenue, cost, and utilization indicators may provide additional insights 80<br>
81
Profitability – SFC Actions Consultation, education, networks, facilitation, policy to help hospitals:
Increase revenues (better data capture, fewer referrals, fewer denials, new services, new markets, more physicians?)
Control expenses (wage rates, staffing patterns, group purchasing, 340B, equipment management, information technology?)
Improve negotiation policy with third party payers
Increase investment returns
Reduce charity care and bad debt 81<br>
Increase revenues (better data capture, fewer referrals, fewer denials, new services, new markets, more physicians?)
Control expenses (wage rates, staffing patterns, group purchasing, 340B, equipment management, information technology?)
Improve negotiation policy with third party payers
Increase investment returns
Reduce charity care and bad debt 81<br>
82
Liquidity Indicators 82<br>
83
Liquidity – Indicator Findings Conflicting results.
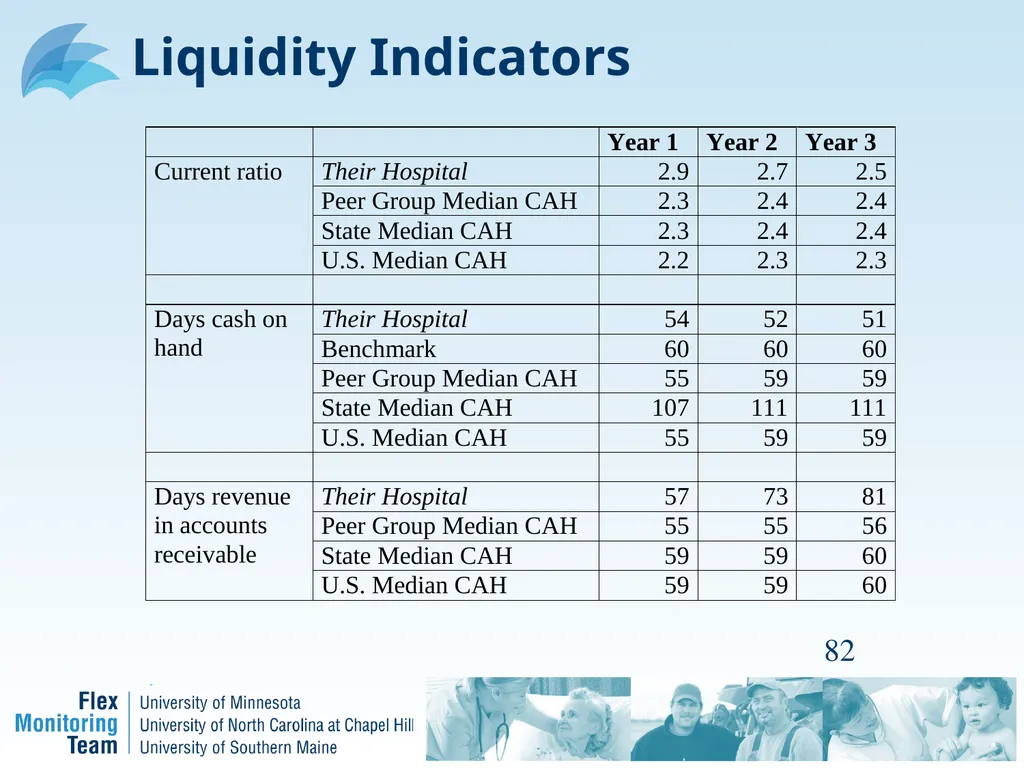
Current ratio declined over the past three years, but still better than industry. Days cash on hand declined but worse than industry
Days revenue in accounts receivable increasing and worse than industry. If credit policy has not changed, third party payers are taking longer to pay 83<br>
Current ratio declined over the past three years, but still better than industry. Days cash on hand declined but worse than industry
Days revenue in accounts receivable increasing and worse than industry. If credit policy has not changed, third party payers are taking longer to pay 83<br>
84
Liquidity –
Potential Explanations Current ratio and days cash on hand
assets are relatively lower (greater draw on cash or smaller inventory?)
Current liabilities are relatively higher (longer payment periods or new debt?)
Operating costs are relatively higher (inefficiency or new debt?)
Days revenue in accounts receivable
Change in payer mix, increasing length of stay, clerical staffing problems, a nursing strike, change in Medicaid policies, higher denial rate, etc.
Revenue, cost, and utilization indicators may provide additional insights 84<br>
assets are relatively lower (greater draw on cash or smaller inventory?)
Current liabilities are relatively higher (longer payment periods or new debt?)
Operating costs are relatively higher (inefficiency or new debt?)
Days revenue in accounts receivable
Change in payer mix, increasing length of stay, clerical staffing problems, a nursing strike, change in Medicaid policies, higher denial rate, etc.
Revenue, cost, and utilization indicators may provide additional insights 84<br>
85
Liquidity – SFC Actions Consultation, education, networks, facilitation, policy to help hospitals:
Identify reasons for the decline in cash and improve cash management strategies
Improve payables management to maintain good relations with suppliers
Implement changes to the revenue cycle for faster collection, lower collection expenses and fewer denials 85<br>
Identify reasons for the decline in cash and improve cash management strategies
Improve payables management to maintain good relations with suppliers
Implement changes to the revenue cycle for faster collection, lower collection expenses and fewer denials 85<br>
86
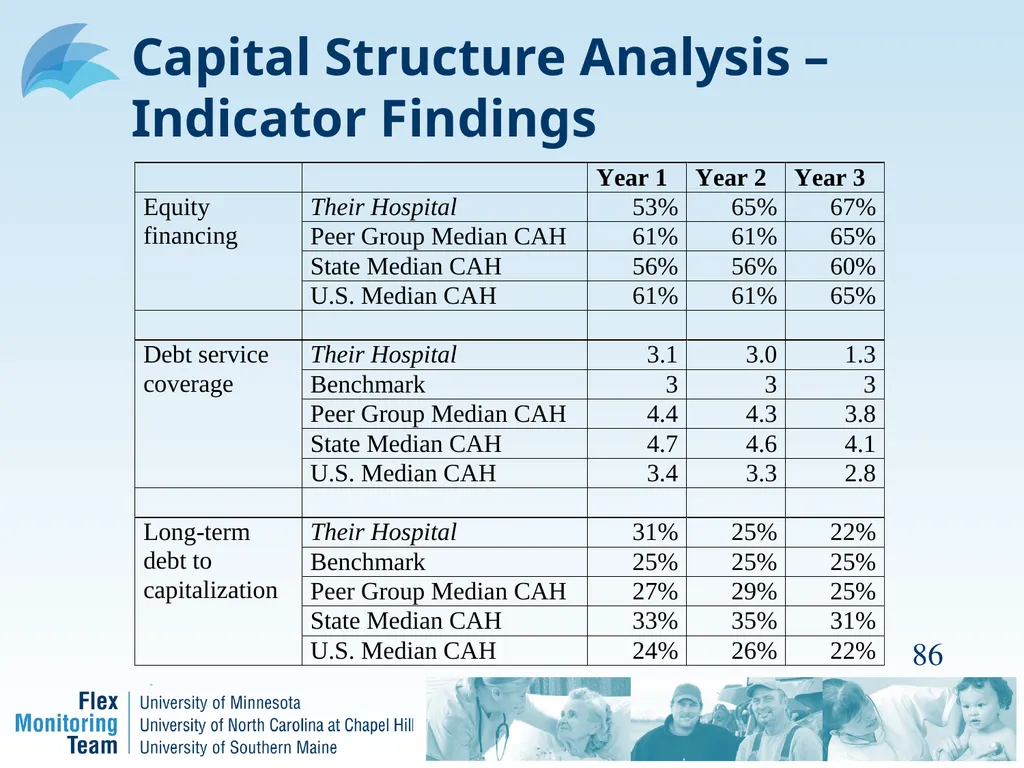
Capital Structure Analysis – Indicator Findings 86<br>
87
Capital Structure –
Indicator Findings Conflicting results.
Equity financing increased over the past three years and better than industry.
Long-term debt to capitalization declined and better than industry.
Debt service coverage declined and worse than industry 87<br>
Equity financing increased over the past three years and better than industry.
Long-term debt to capitalization declined and better than industry.
Debt service coverage declined and worse than industry 87<br>
88
Capital Structure –
Potential Explanations Hospital may have retired debt in year 3
Large principal repayments temporarily reduce debt service coverage
Revenue, cost, and utilization indicators may provide additional insights 88<br>
Large principal repayments temporarily reduce debt service coverage
Revenue, cost, and utilization indicators may provide additional insights 88<br>
89
Capital Structure – SFC Actions Consultation, education, networks, facilitation, policy to help hospitals:
Assess their ability to carry additional long-term debt and other types of capital
Educate hospitals about the many sources of capital available to CAHs
Facilitate contact between CAHs and suppliers of capital 89<br>
Assess their ability to carry additional long-term debt and other types of capital
Educate hospitals about the many sources of capital available to CAHs
Facilitate contact between CAHs and suppliers of capital 89<br>
90
Implications for SFCs Higher (lower) indicator values are not always good. Most indicators have a middle range of “good” values and extremes are “bad” values
Each CAH has some indicators that look “good” and some that look “bad” relative to other CAHs, which may make overall financial position difficult to determine 90<br>
Each CAH has some indicators that look “good” and some that look “bad” relative to other CAHs, which may make overall financial position difficult to determine 90<br>
91
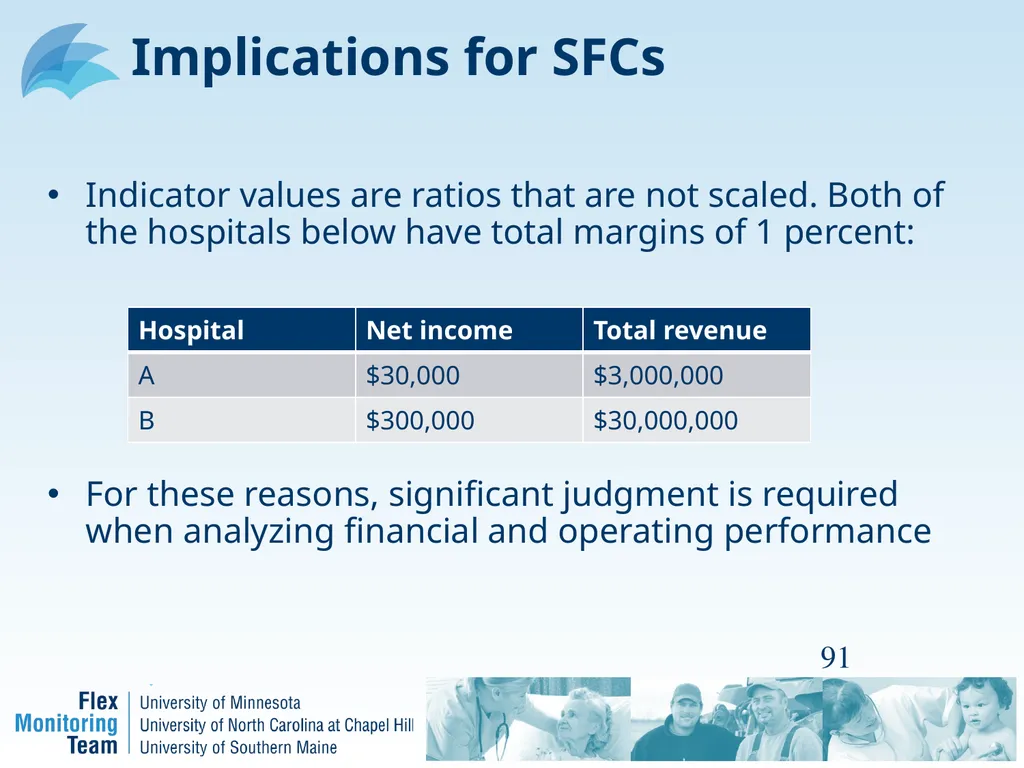
Implications for SFCs Indicator values are ratios that are not scaled. Both of the hospitals below have total margins of 1 percent:
For these reasons, significant judgment is required when analyzing financial and operating performance 91<br>
For these reasons, significant judgment is required when analyzing financial and operating performance 91<br>
92
SFC Rules of Thumb Compare relative financial performance of a CAH:
First to benchmark (when available)
Second to peer group median
Third to state median
Fourth to U.S. median
Assign greater weight to recent indicator values 92<br>
First to benchmark (when available)
Second to peer group median
Third to state median
Fourth to U.S. median
Assign greater weight to recent indicator values 92<br>
93
SFC Rules of Thumb Investigate indicator values that are:
Far above or below peer group, state, and U.S. medians
Trending in the wrong direction
Highly erratic (data quality?)
Understand the indicators as a group of measures 93<br>
Far above or below peer group, state, and U.S. medians
Trending in the wrong direction
Highly erratic (data quality?)
Understand the indicators as a group of measures 93<br>
94
Conclusion “Firms that have high profits, lots of cash, little debt, and new plants have great financial strength. Firms with losses, little cash, lots of debt, and old physical facilities will not be in business long.” (Cleverley and Cameron) 94<br>
95
7. The limitations 95<br>
96
Data Limitations Timeliness of data (although recent numbers can be produced using the Calculator from our website)
Explanations for differential performance are not identified
CAH mission, service mix and operating environment are not considered 96<br>
Explanations for differential performance are not identified
CAH mission, service mix and operating environment are not considered 96<br>
97
Examples of Data Quality Concerns Zero total revenues
Negative Net assets
Negative current assets or current liabilities
Negative days cash on hand
Zero total expenses
Negative net patient accounts receivable
Zero inpatient days
Zero outpatient charges 97<br>
Negative Net assets
Negative current assets or current liabilities
Negative days cash on hand
Zero total expenses
Negative net patient accounts receivable
Zero inpatient days
Zero outpatient charges 97<br>
98
CAHMPAS Financial Team University of North Carolina at Chapel Hill
Kristin L. Reiter, PhD
G. Mark Holmes, PhD
George H. Pink, PhD
Technical Advisor
Roger Thompson, Seim, Johnson, Sestak & Quist LLP
To contact us: CAH.finance@schsr.unc.edu 98<br>
Kristin L. Reiter, PhD
G. Mark Holmes, PhD
George H. Pink, PhD
Technical Advisor
Roger Thompson, Seim, Johnson, Sestak & Quist LLP
To contact us: CAH.finance@schsr.unc.edu 98<br>