
A Quick Start Guide to Performing a Batch Static
Description: A Quick Start Guide to Performing a Batch Static Light Scattering Experiment to determine Protein Molecular Weight with the DynaPro NanoStar Light Scattering University Wyatt Technology Corporation Santa Barbara, California Contact Us If
Related Topics
Download Presentation
"A Quick Start Guide to Performing a Batch Static" is the property of its rightful owner. Permission is granted to download and print the materials on this website for personal, non-commercial use only, and to display it on your personal computer provided you do not modify the materials and that you retain all copyright notices contained in the materials. By downloading content from our website, you accept the terms of this agreement.
Presentation Transcript
slide1. A Quick Start Guide to Performing a Batch Static Light Scattering Experiment to determine Protein Molecular Weight with the DynaPro NanoStar Light Scattering University
Wyatt Technology Corporation
Santa Barbara, California<br>
slide2. Contact Us If any questions arise as you perform an experiment with the DynaPro instrument, please do not hesitate to contact us:
Telephone:
(805) 681-9009
Email:
support@wyatt.com
Mail:
Wyatt Technology, 6300 Hollister Ave., Santa Barbara, CA 93117<br>
slide3. Introduction The purpose of this Quick Start Guide is to provide detailed instructions to the operator of a DynaPro NanoStar for performing batch static light scattering experiments, determining the absolute molecular weight of small isotropically scattering macromolecules (e.g. proteins).
Please refer to the DynaPro NanoStar User’s Guide, the Dynamics software User’s Guide, and the Wyatt Technology website (www.wyatt.com) for important safety related information, as well as detailed information regarding the operation of the instrument and software, including theory and applications.<br>
slide4. Procedure Outline Clean and dry the NanoStar quartz cuvette.
Check the clean water count rate.
Measure Solvent Offset and validate DLS results.
Determine protein concentration.
Measure the protein sample, then:
Validate results: Datalog grid; ACF; Homogeneity
Calculate Molecular Weight from Static Light Scattering
Notes:
These instructions assume the instrument calibration constant is valid (from your Certificate of Performance, IQOQ, etc.).
See Section 4 of this binder on how to calibrate and manage your cuvettes.<br>
slide5. I. Clean and Dry the NanoStar Quartz Cuvette As a first step, it is necessary to thoroughly clean and dry the NanoStar quartz cuvette, both inside and outside.
If you are not familiar with the recommended Wyatt Technology cleaning and handling protocols for quartz cuvettes, please review the section on cuvette cleaning in the DynaPro NanoStar User’s guide or the Technical Note “Quartz Cuvette Cleaning Protocol” on the Wyatt Support Center.
If you do not have a copy of this manual or technical note, please download from the Wyatt Support Center (www.wyatt.com) or contact Wyatt Technical Support at support@wyatt.com or 805-681-9009.<br>
slide6. II. Check the Clean Water Count Rate Draw 1 mL of DI water into a disposable 1 mL plastic syringe; attach a 0.02 μm Anotop filter.
Discard the first few drops of filtered solvent, then flush approximately 800 μL of water through the filter into a clean Eppendorf vial.
Load approximately 10-100 μL of 0.02 μm filtered DI water into the quartz cuvette, depending on the cuvette volume used.
Insert the cuvette into the NanoStar, and close the lid.<br>
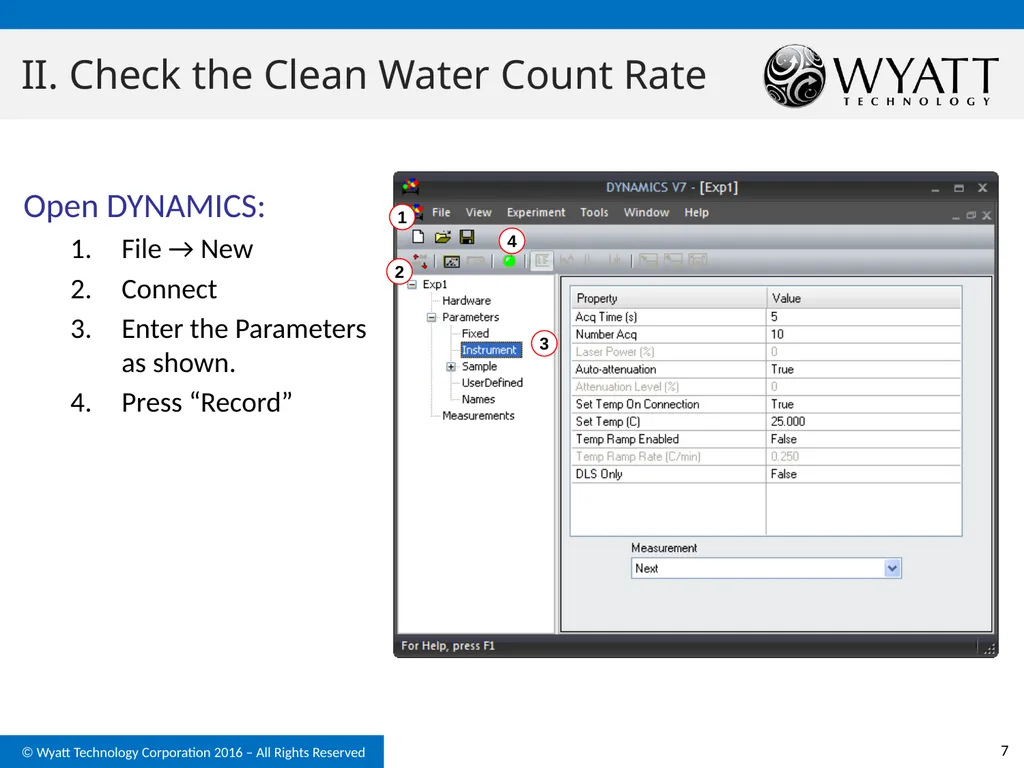
slide7. II. Check the Clean Water Count Rate Open DYNAMICS:
File → New
Connect
Enter the Parameters as shown.
Press “Record” 1 2 3 4<br>
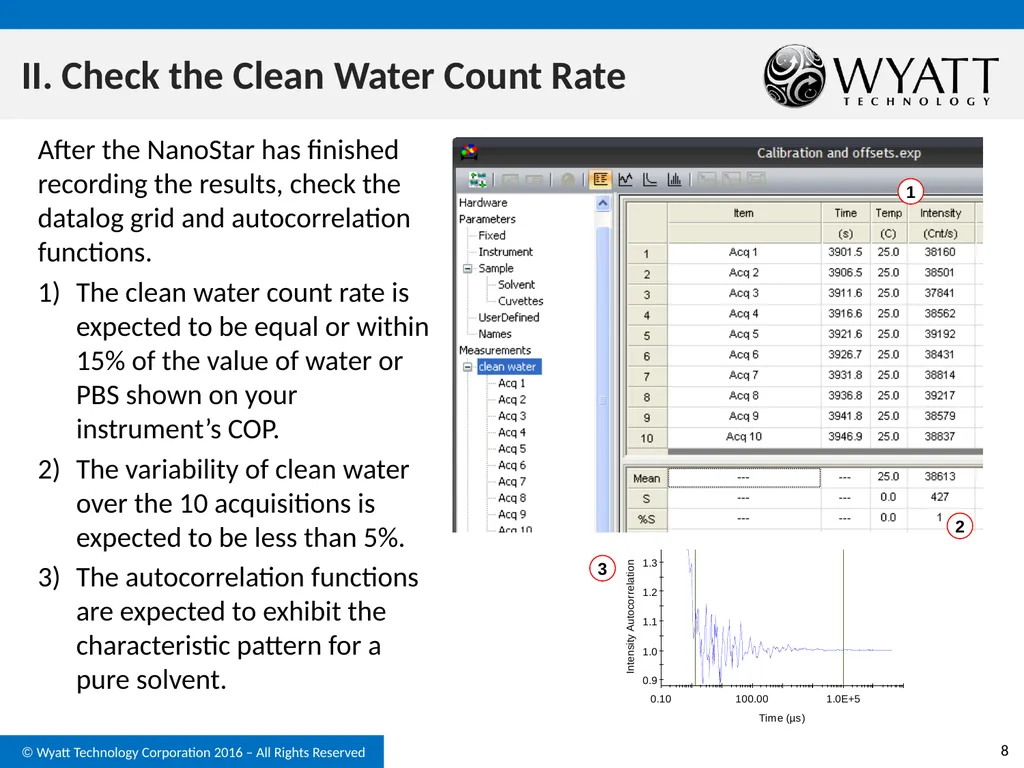
slide8. II. Check the Clean Water Count Rate After the NanoStar has finished recording the results, check the datalog grid and autocorrelation functions.
The clean water count rate is expected to be equal or within 15% of the value of water or PBS shown on your instrument’s COP.
The variability of clean water over the 10 acquisitions is expected to be less than 5%.
The autocorrelation functions are expected to exhibit the characteristic pattern for a pure solvent. 2 1 3<br>
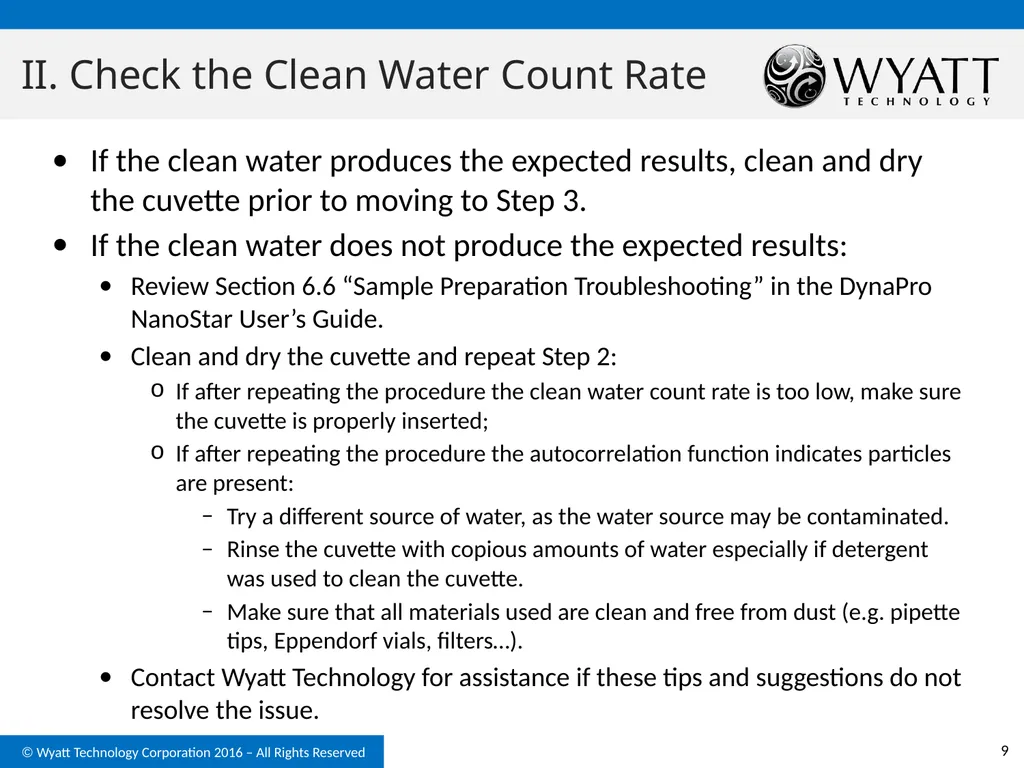
slide9. II. Check the Clean Water Count Rate If the clean water produces the expected results, clean and dry the cuvette prior to moving to Step 3.
If the clean water does not produce the expected results:
Review Section 6.6 “Sample Preparation Troubleshooting” in the DynaPro NanoStar User’s Guide.
Clean and dry the cuvette and repeat Step 2:
If after repeating the procedure the clean water count rate is too low, make sure the cuvette is properly inserted;
If after repeating the procedure the autocorrelation function indicates particles are present:
Try a different source of water, as the water source may be contaminated.
Rinse the cuvette with copious amounts of water especially if detergent was used to clean the cuvette.
Make sure that all materials used are clean and free from dust (e.g. pipette tips, Eppendorf vials, filters…).
Contact Wyatt Technology for assistance if these tips and suggestions do not resolve the issue.<br>
slide10. III. Measure the Solvent Offset Draw 1 mL of your solvent into a disposable 1 mL plastic syringe; attach a 0.02 μm Anotop filter.
Discard the first few drops of filtered solvent, then flush approximately 800 μL of water through the filter into a clean Eppendorf vial.
Load approximately 10-100 μL of 0.02 μm filtered DI water into the quartz cuvette, depending on the cuvette volume used.
Insert the cuvette into the NanoStar, and close the lid.<br>
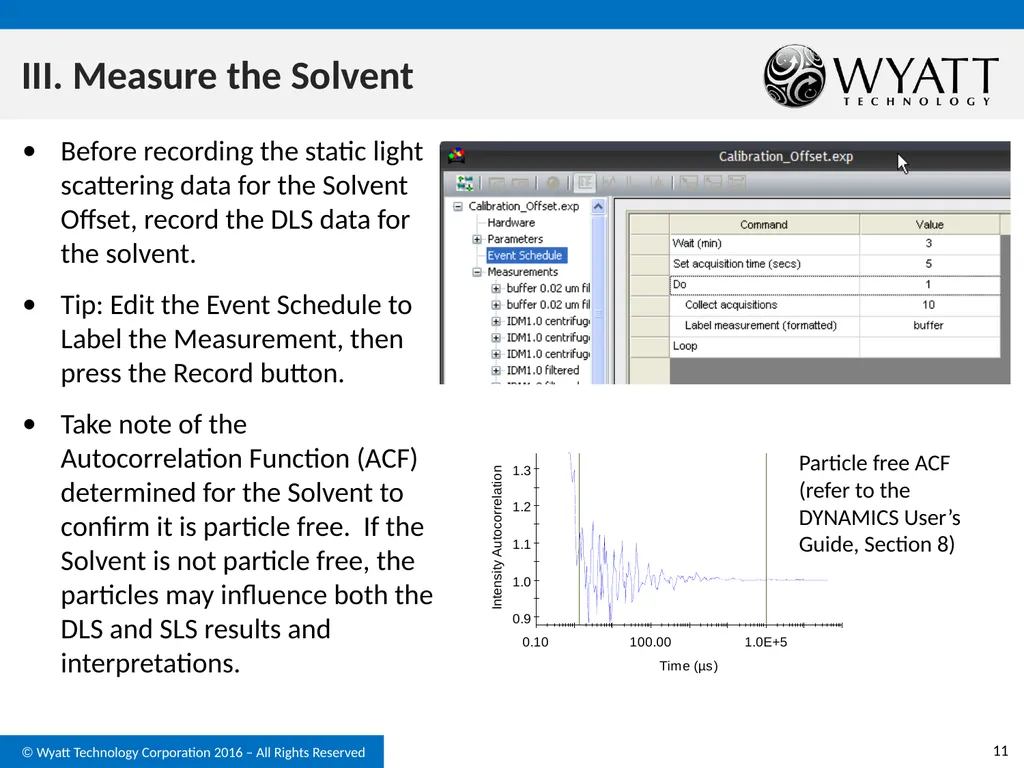
slide11. III. Measure the Solvent Before recording the static light scattering data for the Solvent Offset, record the DLS data for the solvent.
Tip: Edit the Event Schedule to Label the Measurement, then press the Record button.
Take note of the Autocorrelation Function (ACF) determined for the Solvent to confirm it is particle free. If the Solvent is not particle free, the particles may influence both the DLS and SLS results and interpretations. Particle free ACF (refer to the DYNAMICS User’s Guide, Section 8)<br>
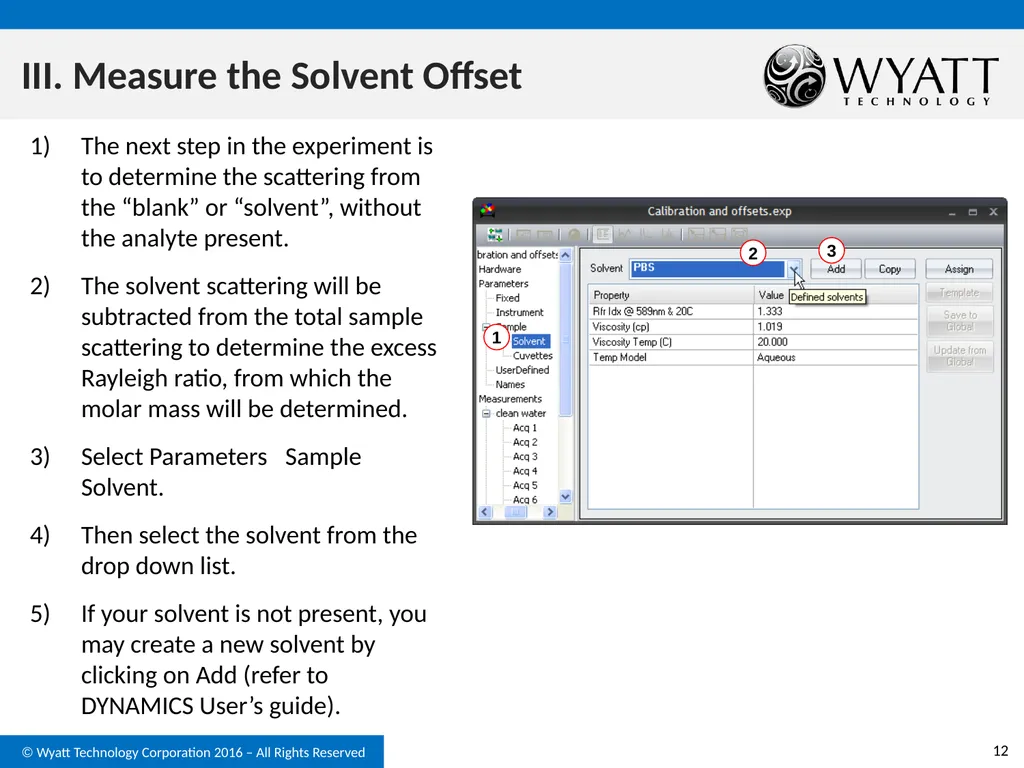
slide12. III. Measure the Solvent Offset The next step in the experiment is to determine the scattering from the “blank” or “solvent”, without the analyte present.
The solvent scattering will be subtracted from the total sample scattering to determine the excess Rayleigh ratio, from which the molar mass will be determined.
Select Parameters Sample Solvent.
Then select the solvent from the drop down list.
If your solvent is not present, you may create a new solvent by clicking on Add (refer to DYNAMICS User’s guide). 1 2 3<br>
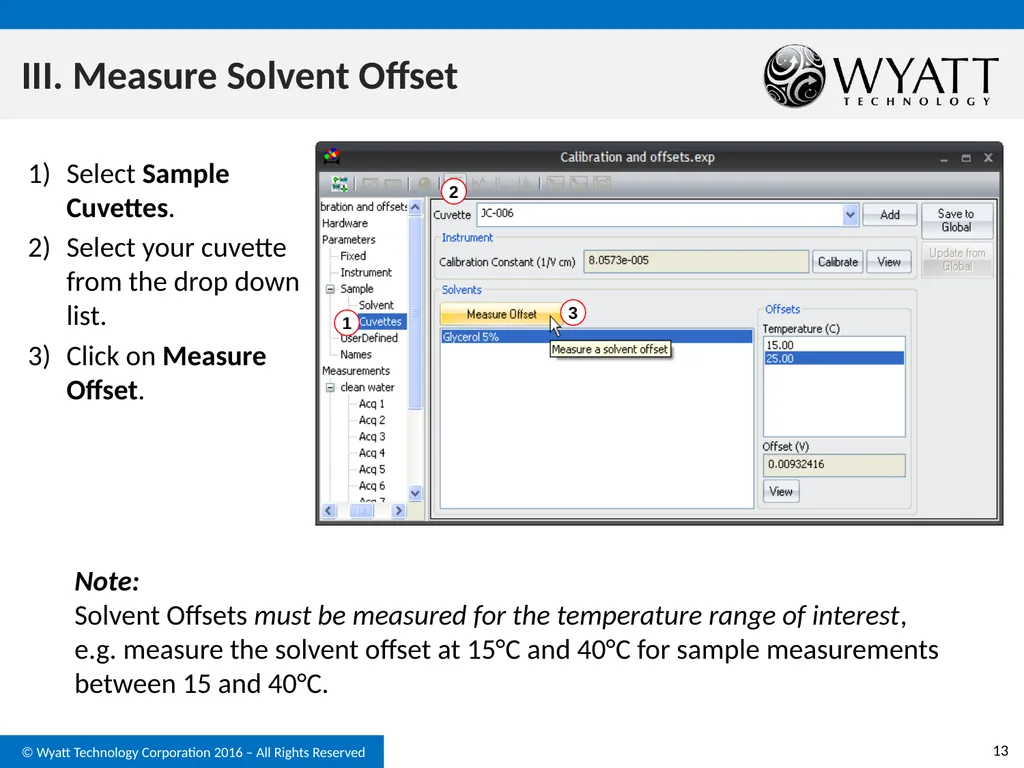
slide13. III. Measure Solvent Offset Select Sample Cuvettes.
Select your cuvette from the drop down list.
Click on Measure Offset. 1 2 3 Note: Solvent Offsets must be measured for the temperature range of interest, e.g. measure the solvent offset at 15°C and 40°C for sample measurements between 15 and 40°C.<br>
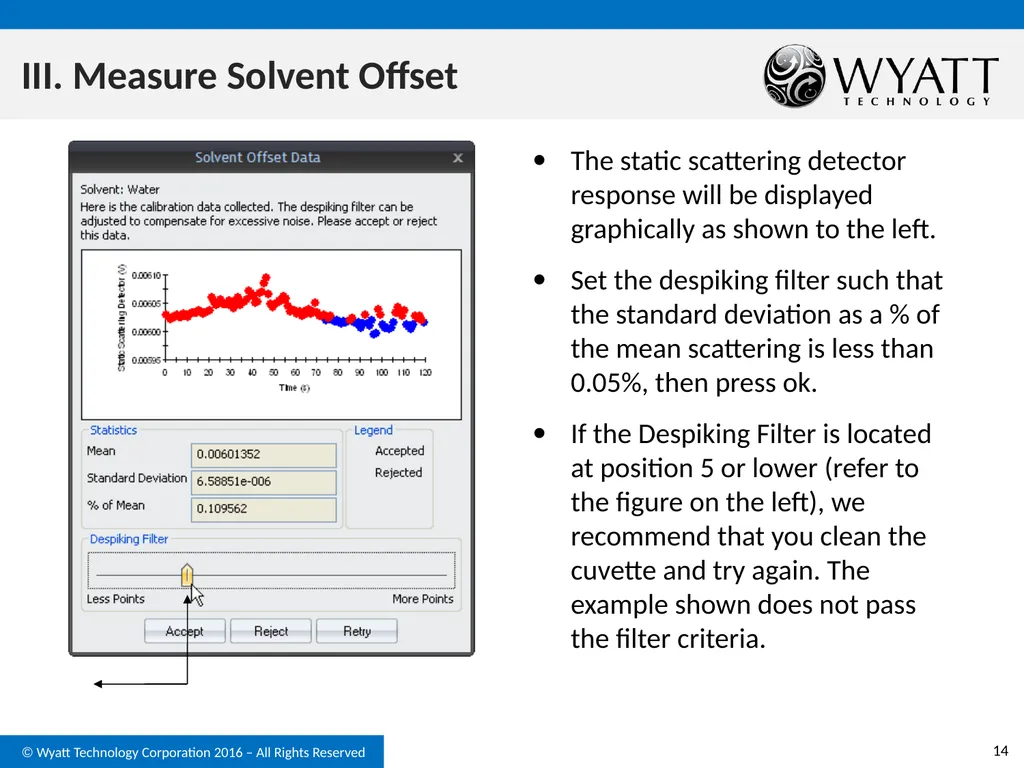
slide14. III. Measure Solvent Offset The static scattering detector response will be displayed graphically as shown to the left.
Set the despiking filter such that the standard deviation as a % of the mean scattering is less than 0.05%, then press ok.
If the Despiking Filter is located at position 5 or lower (refer to the figure on the left), we recommend that you clean the cuvette and try again. The example shown does not pass the filter criteria.<br>
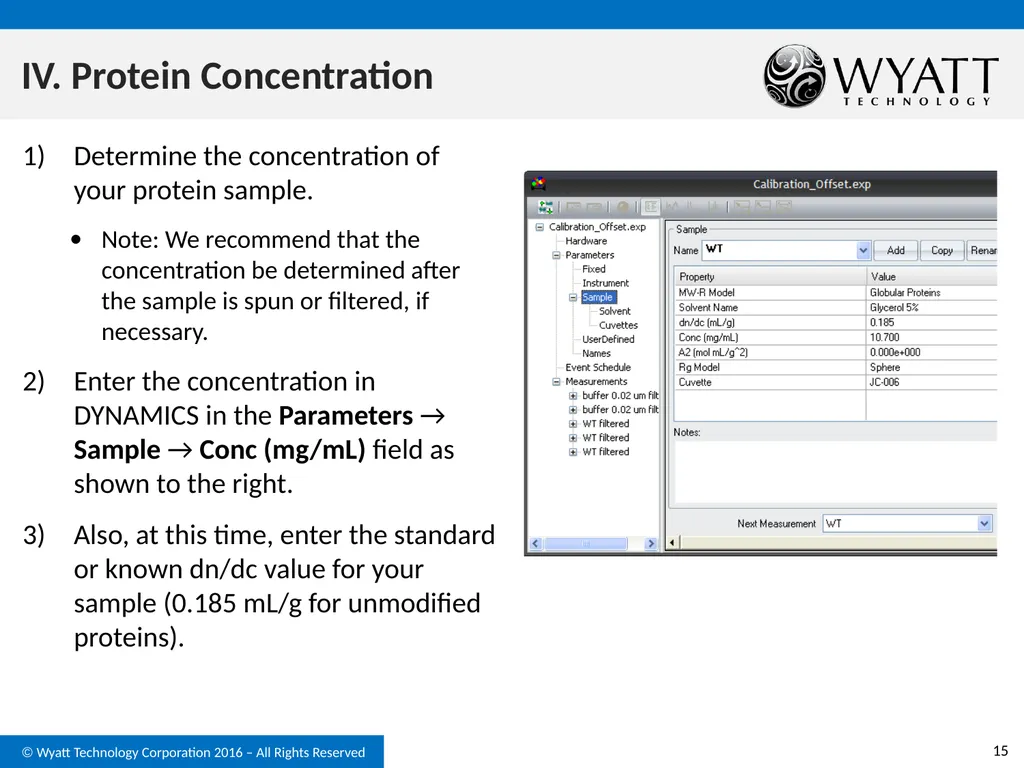
slide15. IV. Protein Concentration Determine the concentration of your protein sample.
Note: We recommend that the concentration be determined after the sample is spun or filtered, if necessary.
Enter the concentration in DYNAMICS in the Parameters → Sample → Conc (mg/mL) field as shown to the right.
Also, at this time, enter the standard or known dn/dc value for your sample (0.185 mL/g for unmodified proteins).<br>
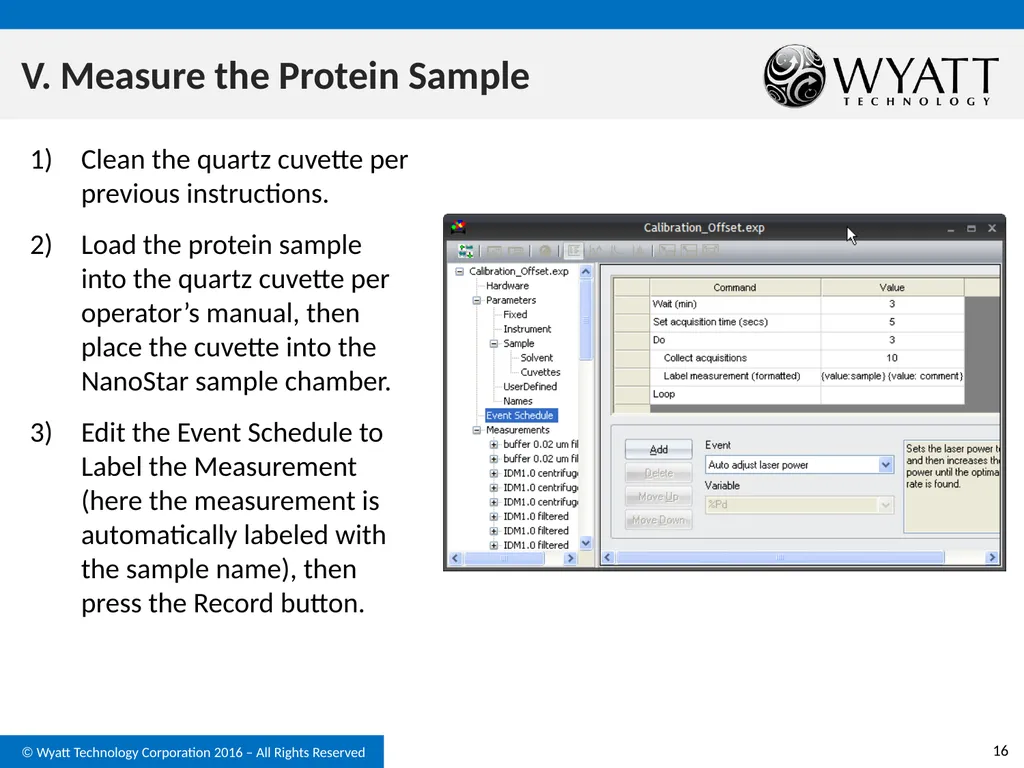
slide16. V. Measure the Protein Sample Clean the quartz cuvette per previous instructions.
Load the protein sample into the quartz cuvette per operator’s manual, then place the cuvette into the NanoStar sample chamber.
Edit the Event Schedule to Label the Measurement (here the measurement is automatically labeled with the sample name), then press the Record button.<br>
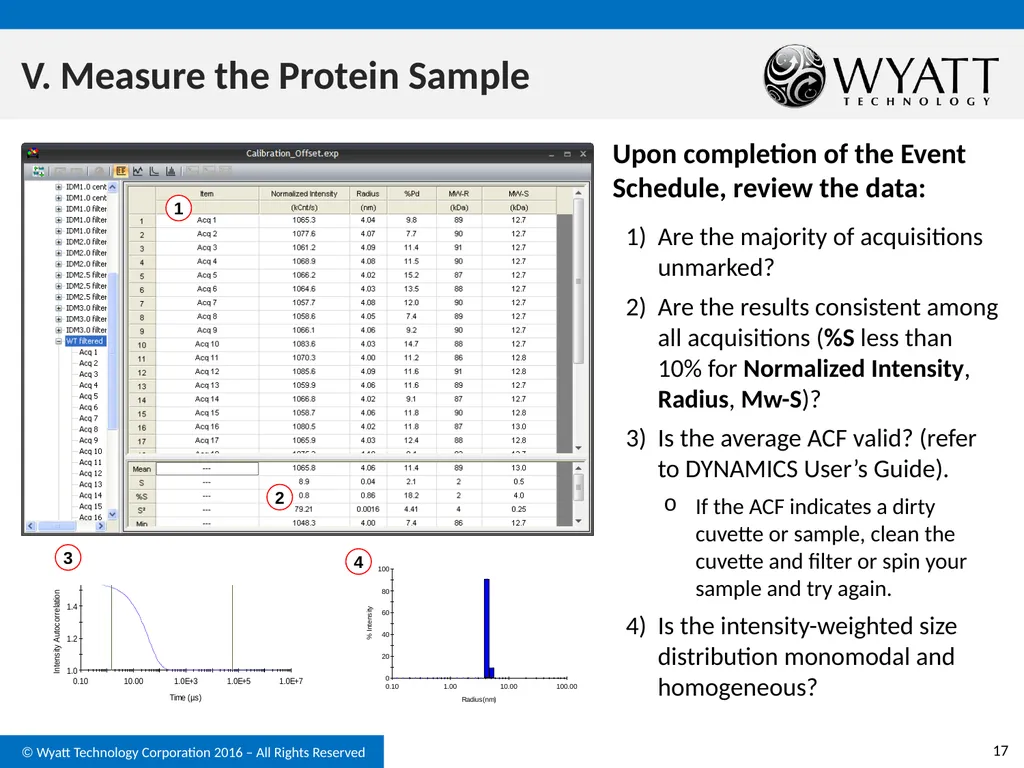
slide17. V. Measure the Protein Sample Upon completion of the Event Schedule, review the data:
Are the majority of acquisitions unmarked?
Are the results consistent among all acquisitions (%S less than 10% for Normalized Intensity, Radius, Mw-S)?
Is the average ACF valid? (refer to DYNAMICS User’s Guide).
If the ACF indicates a dirty cuvette or sample, clean the cuvette and filter or spin your sample and try again.
Is the intensity-weighted size distribution monomodal and homogeneous? 1 2 3 4<br>
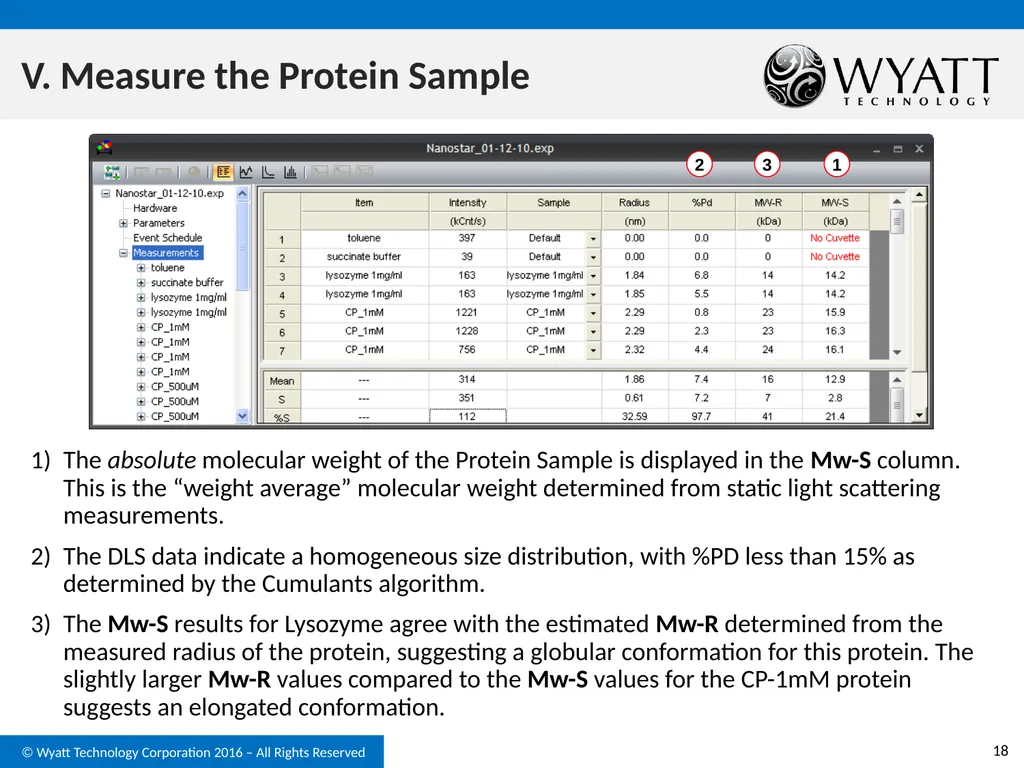
slide18. V. Measure the Protein Sample The absolute molecular weight of the Protein Sample is displayed in the Mw-S column. This is the “weight average” molecular weight determined from static light scattering measurements.
The DLS data indicate a homogeneous size distribution, with %PD less than 15% as determined by the Cumulants algorithm.
The Mw-S results for Lysozyme agree with the estimated Mw-R determined from the measured radius of the protein, suggesting a globular conformation for this protein. The slightly larger Mw-R values compared to the Mw-S values for the CP-1mM protein suggests an elongated conformation. 2 1 3<br>
Wyatt Technology Corporation
Santa Barbara, California<br>
slide2. Contact Us If any questions arise as you perform an experiment with the DynaPro instrument, please do not hesitate to contact us:
Telephone:
(805) 681-9009
Email:
support@wyatt.com
Mail:
Wyatt Technology, 6300 Hollister Ave., Santa Barbara, CA 93117<br>
slide3. Introduction The purpose of this Quick Start Guide is to provide detailed instructions to the operator of a DynaPro NanoStar for performing batch static light scattering experiments, determining the absolute molecular weight of small isotropically scattering macromolecules (e.g. proteins).
Please refer to the DynaPro NanoStar User’s Guide, the Dynamics software User’s Guide, and the Wyatt Technology website (www.wyatt.com) for important safety related information, as well as detailed information regarding the operation of the instrument and software, including theory and applications.<br>
slide4. Procedure Outline Clean and dry the NanoStar quartz cuvette.
Check the clean water count rate.
Measure Solvent Offset and validate DLS results.
Determine protein concentration.
Measure the protein sample, then:
Validate results: Datalog grid; ACF; Homogeneity
Calculate Molecular Weight from Static Light Scattering
Notes:
These instructions assume the instrument calibration constant is valid (from your Certificate of Performance, IQOQ, etc.).
See Section 4 of this binder on how to calibrate and manage your cuvettes.<br>
slide5. I. Clean and Dry the NanoStar Quartz Cuvette As a first step, it is necessary to thoroughly clean and dry the NanoStar quartz cuvette, both inside and outside.
If you are not familiar with the recommended Wyatt Technology cleaning and handling protocols for quartz cuvettes, please review the section on cuvette cleaning in the DynaPro NanoStar User’s guide or the Technical Note “Quartz Cuvette Cleaning Protocol” on the Wyatt Support Center.
If you do not have a copy of this manual or technical note, please download from the Wyatt Support Center (www.wyatt.com) or contact Wyatt Technical Support at support@wyatt.com or 805-681-9009.<br>
slide6. II. Check the Clean Water Count Rate Draw 1 mL of DI water into a disposable 1 mL plastic syringe; attach a 0.02 μm Anotop filter.
Discard the first few drops of filtered solvent, then flush approximately 800 μL of water through the filter into a clean Eppendorf vial.
Load approximately 10-100 μL of 0.02 μm filtered DI water into the quartz cuvette, depending on the cuvette volume used.
Insert the cuvette into the NanoStar, and close the lid.<br>
slide7. II. Check the Clean Water Count Rate Open DYNAMICS:
File → New
Connect
Enter the Parameters as shown.
Press “Record” 1 2 3 4<br>
slide8. II. Check the Clean Water Count Rate After the NanoStar has finished recording the results, check the datalog grid and autocorrelation functions.
The clean water count rate is expected to be equal or within 15% of the value of water or PBS shown on your instrument’s COP.
The variability of clean water over the 10 acquisitions is expected to be less than 5%.
The autocorrelation functions are expected to exhibit the characteristic pattern for a pure solvent. 2 1 3<br>
slide9. II. Check the Clean Water Count Rate If the clean water produces the expected results, clean and dry the cuvette prior to moving to Step 3.
If the clean water does not produce the expected results:
Review Section 6.6 “Sample Preparation Troubleshooting” in the DynaPro NanoStar User’s Guide.
Clean and dry the cuvette and repeat Step 2:
If after repeating the procedure the clean water count rate is too low, make sure the cuvette is properly inserted;
If after repeating the procedure the autocorrelation function indicates particles are present:
Try a different source of water, as the water source may be contaminated.
Rinse the cuvette with copious amounts of water especially if detergent was used to clean the cuvette.
Make sure that all materials used are clean and free from dust (e.g. pipette tips, Eppendorf vials, filters…).
Contact Wyatt Technology for assistance if these tips and suggestions do not resolve the issue.<br>
slide10. III. Measure the Solvent Offset Draw 1 mL of your solvent into a disposable 1 mL plastic syringe; attach a 0.02 μm Anotop filter.
Discard the first few drops of filtered solvent, then flush approximately 800 μL of water through the filter into a clean Eppendorf vial.
Load approximately 10-100 μL of 0.02 μm filtered DI water into the quartz cuvette, depending on the cuvette volume used.
Insert the cuvette into the NanoStar, and close the lid.<br>
slide11. III. Measure the Solvent Before recording the static light scattering data for the Solvent Offset, record the DLS data for the solvent.
Tip: Edit the Event Schedule to Label the Measurement, then press the Record button.
Take note of the Autocorrelation Function (ACF) determined for the Solvent to confirm it is particle free. If the Solvent is not particle free, the particles may influence both the DLS and SLS results and interpretations. Particle free ACF (refer to the DYNAMICS User’s Guide, Section 8)<br>
slide12. III. Measure the Solvent Offset The next step in the experiment is to determine the scattering from the “blank” or “solvent”, without the analyte present.
The solvent scattering will be subtracted from the total sample scattering to determine the excess Rayleigh ratio, from which the molar mass will be determined.
Select Parameters Sample Solvent.
Then select the solvent from the drop down list.
If your solvent is not present, you may create a new solvent by clicking on Add (refer to DYNAMICS User’s guide). 1 2 3<br>
slide13. III. Measure Solvent Offset Select Sample Cuvettes.
Select your cuvette from the drop down list.
Click on Measure Offset. 1 2 3 Note: Solvent Offsets must be measured for the temperature range of interest, e.g. measure the solvent offset at 15°C and 40°C for sample measurements between 15 and 40°C.<br>
slide14. III. Measure Solvent Offset The static scattering detector response will be displayed graphically as shown to the left.
Set the despiking filter such that the standard deviation as a % of the mean scattering is less than 0.05%, then press ok.
If the Despiking Filter is located at position 5 or lower (refer to the figure on the left), we recommend that you clean the cuvette and try again. The example shown does not pass the filter criteria.<br>
slide15. IV. Protein Concentration Determine the concentration of your protein sample.
Note: We recommend that the concentration be determined after the sample is spun or filtered, if necessary.
Enter the concentration in DYNAMICS in the Parameters → Sample → Conc (mg/mL) field as shown to the right.
Also, at this time, enter the standard or known dn/dc value for your sample (0.185 mL/g for unmodified proteins).<br>
slide16. V. Measure the Protein Sample Clean the quartz cuvette per previous instructions.
Load the protein sample into the quartz cuvette per operator’s manual, then place the cuvette into the NanoStar sample chamber.
Edit the Event Schedule to Label the Measurement (here the measurement is automatically labeled with the sample name), then press the Record button.<br>
slide17. V. Measure the Protein Sample Upon completion of the Event Schedule, review the data:
Are the majority of acquisitions unmarked?
Are the results consistent among all acquisitions (%S less than 10% for Normalized Intensity, Radius, Mw-S)?
Is the average ACF valid? (refer to DYNAMICS User’s Guide).
If the ACF indicates a dirty cuvette or sample, clean the cuvette and filter or spin your sample and try again.
Is the intensity-weighted size distribution monomodal and homogeneous? 1 2 3 4<br>
slide18. V. Measure the Protein Sample The absolute molecular weight of the Protein Sample is displayed in the Mw-S column. This is the “weight average” molecular weight determined from static light scattering measurements.
The DLS data indicate a homogeneous size distribution, with %PD less than 15% as determined by the Cumulants algorithm.
The Mw-S results for Lysozyme agree with the estimated Mw-R determined from the measured radius of the protein, suggesting a globular conformation for this protein. The slightly larger Mw-R values compared to the Mw-S values for the CP-1mM protein suggests an elongated conformation. 2 1 3<br>